Survey Slide
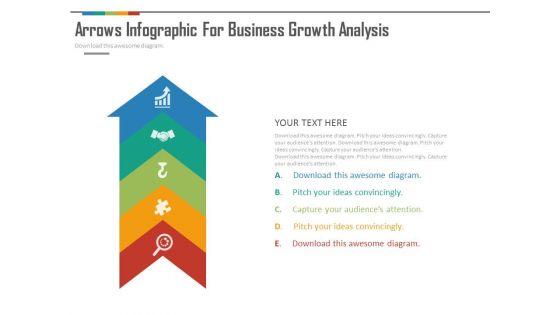
Arrow Infographics For Strategic Analysis Powerpoint Slides
This PowerPoint template contains design of arrow infographic. Download this diagram slide to depict strategic analysis. Use this PPT slide to make impressive presentations.
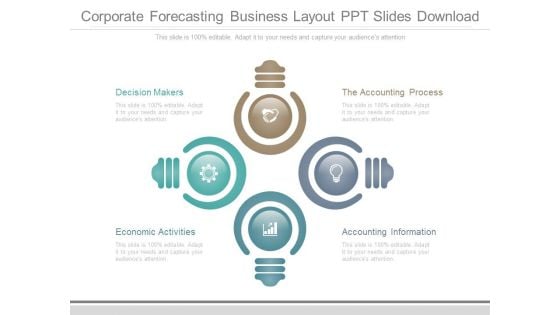
Corporate Forecasting Business Layout Ppt Slides Download
This is a corporate forecasting business layout ppt slides download. This is a four stage process. The stages in this process are decision makers, economic activities, the accounting process, accounting information.
Statistics Graph Business PowerPoint Presentation Slides C
Microsoft Powerpoint Slides and Backgrounds with business statistics in white with a green arrow Exercise creativity with our Statistics Graph Business PowerPoint Presentation Slides C. You will come out on top.
Statistics Graph Business PowerPoint Presentation Slides Cc
Microsoft Powerpoint Slides and Backgrounds with business statistics in white with a green arrow Display your even handedness with our Statistics Graph Business PowerPoint Presentation Slides Cc. Show them that you make fair assessments.
Statistics Graph Business PowerPoint Presentation Slides F
Microsoft Powerpoint Slides and Backgrounds with business statistics in white with a green arrow Double your growth with our Statistics Graph Business PowerPoint Presentation Slides F. Download without worries with our money back guaranteee.
Statistics Graph Business PowerPoint Presentation Slides R
Microsoft Powerpoint Slides and Backgrounds with business statistics in white with a green arrow Motivate teams with our Statistics Graph Business PowerPoint Presentation Slides R. Download without worries with our money back guaranteee.
Bar Graph Business PowerPoint Presentation Slides S
Microsoft PowerPoint Slides and Backgrounds with style of a vector bar graph Enumerate your ideas with our Bar Graph Business PowerPoint Presentation Slides S. Prioritize them as per your wish.
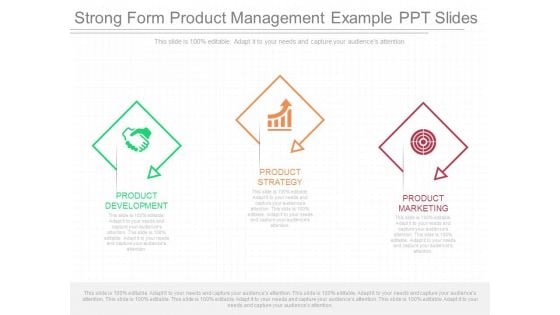
Strong Form Product Management Example Ppt Slides
This is a strong form product management example ppt slides. This is a three stage process. The stages in this process are product development, product strategy, product marketing.
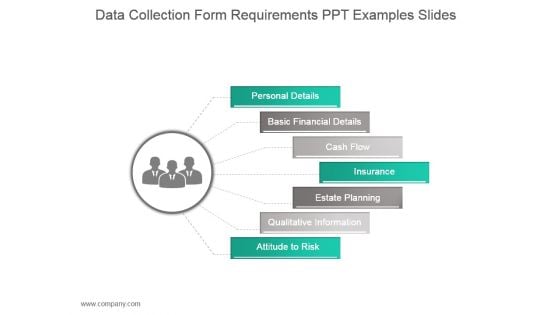
Data Collection Form Requirements Ppt Examples Slides
This is a data collection form requirements ppt examples slides. This is a seven stage process. The stages in this process are personal details, basic financial details, cash flow, insurance, estate planning, qualitative information, attitude to risk.
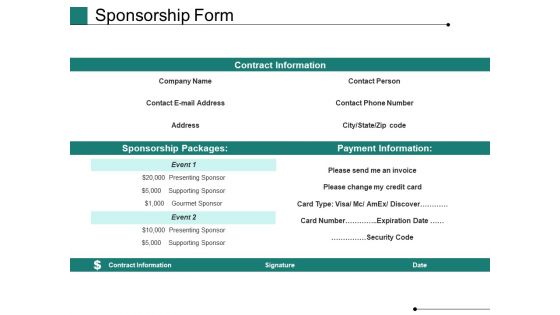
Sponsorship Form Ppt PowerPoint Presentation Summary Slides
This is a sponsorship form ppt powerpoint presentation summary slides. This is a three stage process. The stages in this process are contract information, sponsorship packages, payment information, contract information, signature.
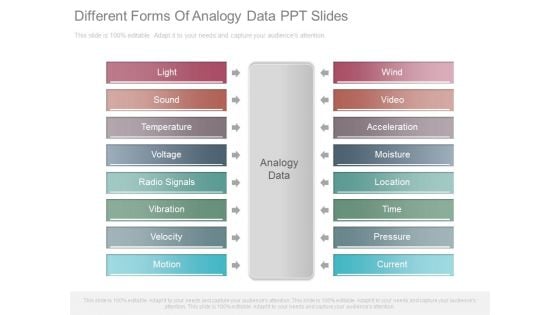
Different Forms Of Analogy Data Ppt Slides
This is a different forms of analogy data ppt slides. This is a eight stage process. The stages in this process are analogy data, light, sound, temperature, voltage, radio signals, vibration, velocity, motion, wind, video, acceleration, moisture, location, time, pressure, current.

Business Strategy Analysis With Team Powerpoint Slides
On this template you can layout of team meeting. This PowerPoint slide is an excellent tool for business strategy analysis. Download this PPT slide for team strategy and planning related topics.
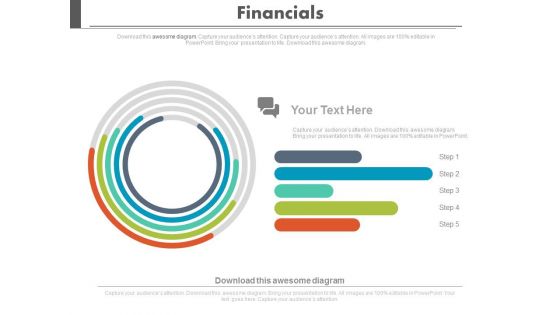
Financial Growth Analysis Circular Chart Powerpoint Slides
Visually support your presentation with our above template containing graphics of circular chart. This diagram slide helps to display financial growth analysis. Etch your views in the brains of your audience with this diagram slide.
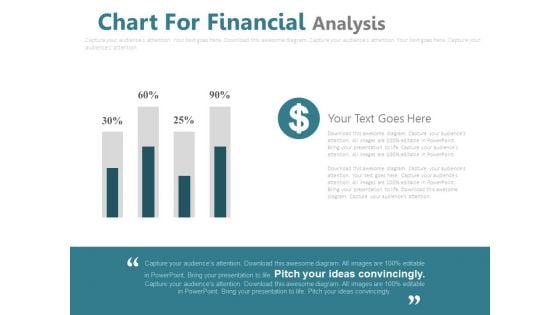
Chart For Financial Percentage Analysis Powerpoint Slides
This PowerPoint template has been designed with financial chart with dollar icon. This PPT slide may be used to display dollar value analysis chart. Download this slide to build unique presentation.
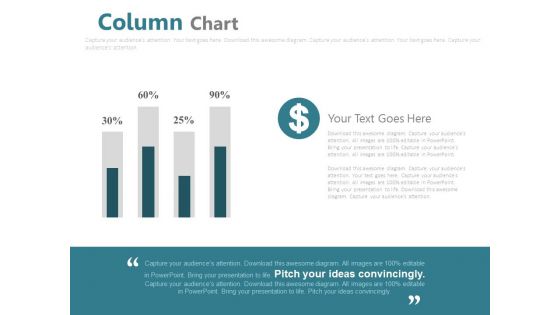
Column Chart For Financial Analysis Powerpoint Slides
This PowerPoint template has been designed with graphics of column chart with percentage values. You may use this business slide design for topics like financial analysis and planning. This PPT slide is powerful tool to describe your ideas.
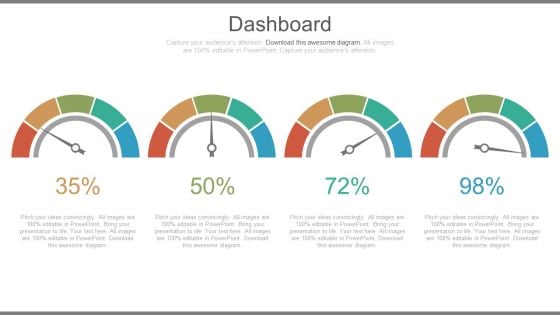
Dashboards For Profit Growth Analysis Powerpoint Slides
This PowerPoint template has been designed with graphics of dashboard. You may use this dashboard slide design to exhibit profit growth analysis. This PPT slide is powerful tool to describe your ideas.
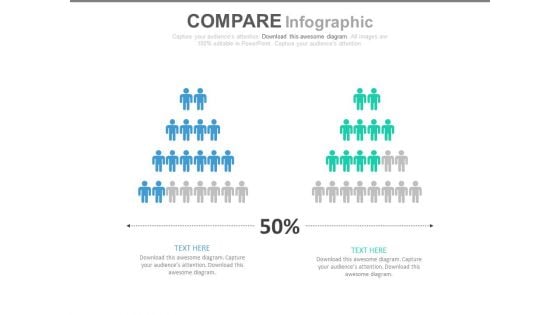
Two Teams Performance Analysis Chart Powerpoint Slides
This PowerPoint template has been designed with icons of two teams with percentage values. Download this PPT slide to depict team?s performance analysis. Deliver amazing presentations to mesmerize your audience by using this PPT slide design.
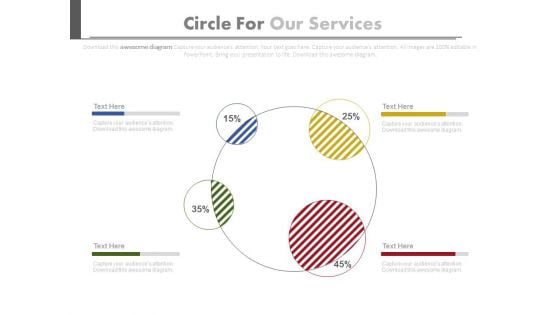
Circle Chart For Value Analysis Powerpoint Slides
This PowerPoint template has been designed for business presentations and corporate slides. The PowerPoint template has a high quality design. You can download this PowerPoint slide for corporate presentations or annual meeting and business plans.
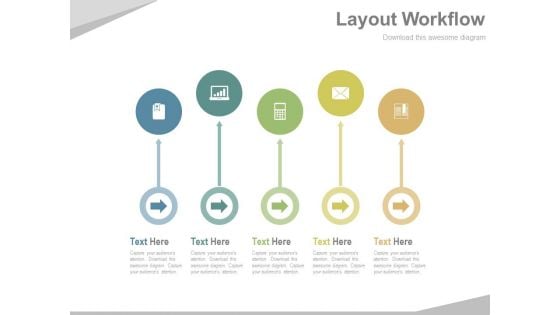
Roadmap Diagram For Project Analysis Powerpoint Slides
You can use this PPT template as a timeline for business development project. This business timeline slide contains graphics of linear circles. Chart the course you intend to take with this slide.
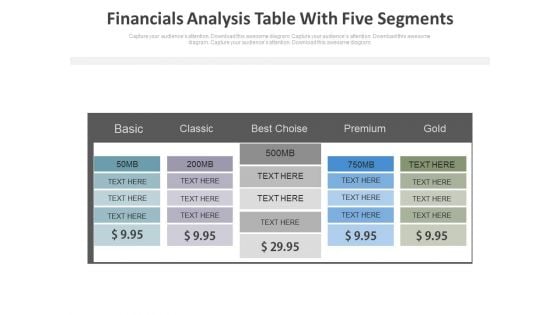
Five Steps Financial Analysis Table Powerpoint Slides
This PowerPoint template has been designed with dollar value pricing table chart. This PPT slide may be used for sample marketing proposal. Download this slide to build unique presentation.
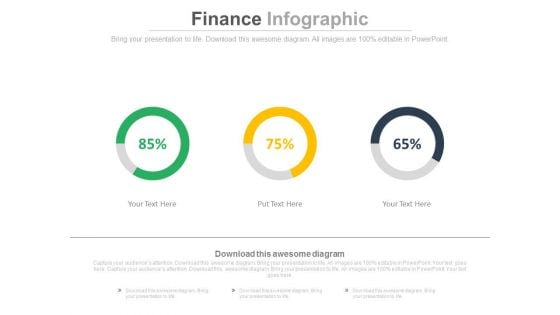
Linear Circles Percentage Analysis Charts Powerpoint Slides
This PowerPoint template has been designed with graphics of three circles and percentage ratios. You may use this dashboard slide design for topics like profit growth and financial planning. This PPT slide is powerful tool to describe your ideas.
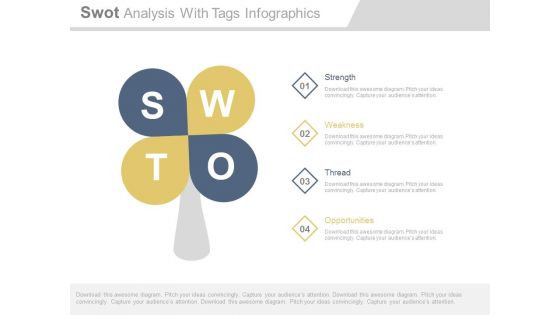
Swot Analysis Layout For Business PowerPoint Slides
This slide is also among the most downloaded template for PowerPoint presentations being used by corporate sectors. This PPT slide has a tree and a flower shaped figure with petals depicting the SWOT (Strength, Weaknesses, Opportunity, Threats) analysis. The colored slide brings a different and innovative look to an otherwise theoretical or text centered topic. The slide is a creative piece of work and can alternatively be used for some other process as well which takes place in 4 steps. The slide can be an effective tool to explain the sales strategy to the professionals to reach the desired targets and goals. The slide is customizable and the colors and font styles can be edited to match the theme of the slide or as per the needs and requirements of the presenter. \n

Agenda Checklist Ppt PowerPoint Presentation Slides Show
Presenting this set of slides with name agenda checklist ppt powerpoint presentation slides show. This is a five stage process. The stages in this process are agenda, business, management, marketing, strategy. This is a completely editable PowerPoint presentation and is available for immediate download. Download now and impress your audience.
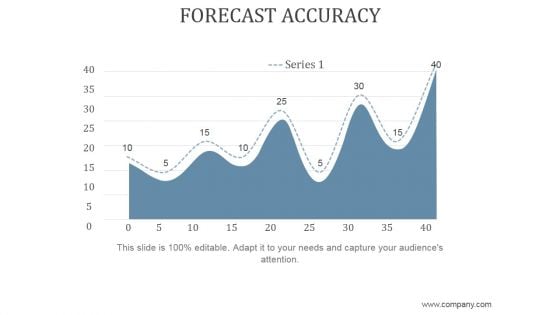
Forecast Accuracy Ppt PowerPoint Presentation Slides
This is a forecast accuracy ppt powerpoint presentation slides. This is a nine stage process. The stages in this process are business, strategy, marketing, finance, growth strategy.
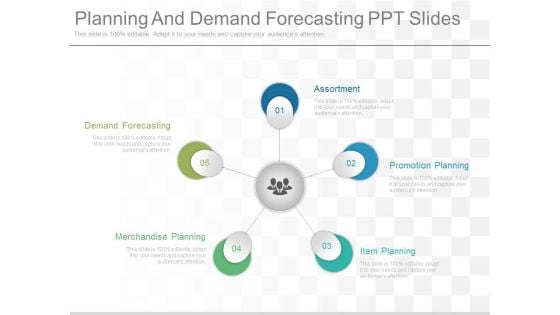
Planning And Demand Forecasting Ppt Slides
This is a planning and demand forecasting ppt slides. This is a five stage process. The stages in this process are demand forecasting, merchandise planning, assortment, promotion planning, item planning.
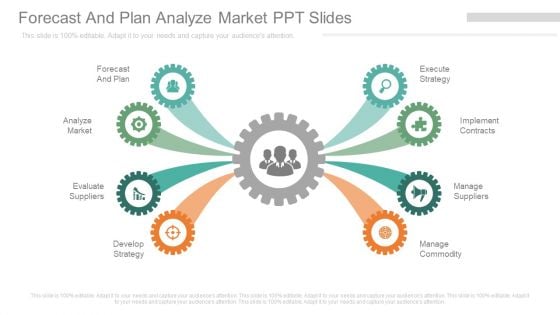
Forecast And Plan Analyze Market Ppt Slides
This is a forecast and plan analyze market ppt slides. This is a eight stage process. The stages in this process are forecast and plan, analyze market, evaluate suppliers, develop strategy, execute strategy, implement contracts, manage suppliers, manage commodity.
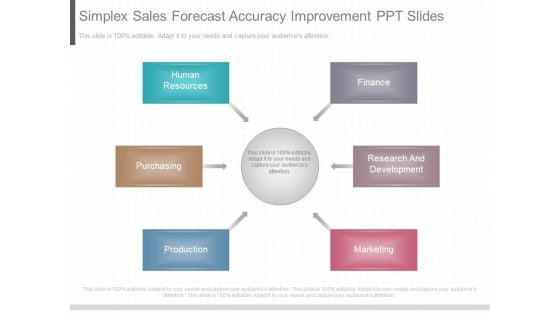
Simplex Sales Forecast Accuracy Improvement Ppt Slides
This is a simplex sales forecast accuracy improvement ppt slide. This is a six stage process. The stages in this process are finance, research and development, marketing, production, purchasing, human resources.
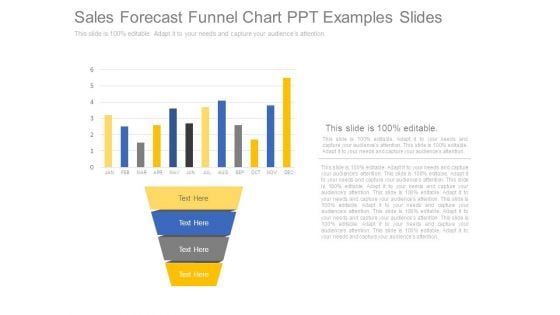
Sales Forecast Funnel Chart Ppt Examples Slides
This is a sales forecast funnel chart ppt examples slides. This is a four stage process. The stages in this process are jan, feb, mar, apr, may, jun, jul, aug, sep, oct, nov, dec.
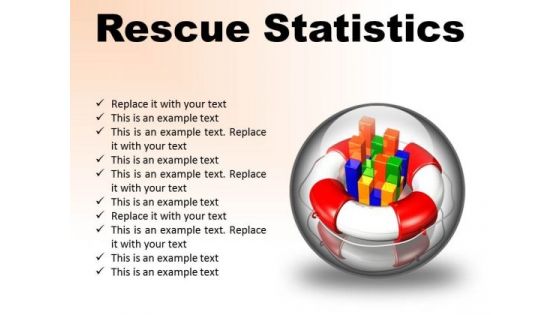
Rescue Statistics Business PowerPoint Presentation Slides C
Microsoft PowerPoint Templates and Backgrounds with a multi segment colorful bar chart placed inside of a large red and white lifesaver on a reflective surface Address them in your charismatic style. Boost your aura with our Rescue Statistics Business PowerPoint Presentation Slides C.
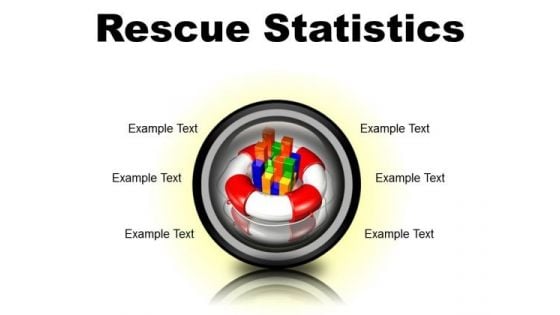
Rescue Statistics Business PowerPoint Presentation Slides Cc
Microsoft PowerPoint Templates and Backgrounds with a multi segment colorful bar chart placed inside of a large red and white lifesaver on a reflective surface Experience bliss with our Rescue Statistics Business PowerPoint Presentation Slides Cc. They bring pure comfort with them.
Rescue Statistics Business PowerPoint Presentation Slides F
Microsoft PowerPoint Templates and Backgrounds with a multi segment colorful bar chart placed inside of a large red and white lifesaver on a reflective surface See your plans begin to crystallize. Our Rescue Statistics Business PowerPoint Presentation Slides F make it feasible.
Rescue Statistics Business PowerPoint Presentation Slides R
Microsoft PowerPoint Templates and Backgrounds with a multi segment colorful bar chart placed inside of a large red and white lifesaver on a reflective surface Spice up the discourse with our Rescue Statistics Business PowerPoint Presentation Slides R. Strengthen the flavour of your thoughts.
Rescue Statistics Business PowerPoint Presentation Slides S
Microsoft PowerPoint Templates and Backgrounds with a multi segment colorful bar chart placed inside of a large red and white lifesaver on a reflective surface Entice them with our Rescue Statistics Business PowerPoint Presentation Slides S. Lure them with your thoughts.
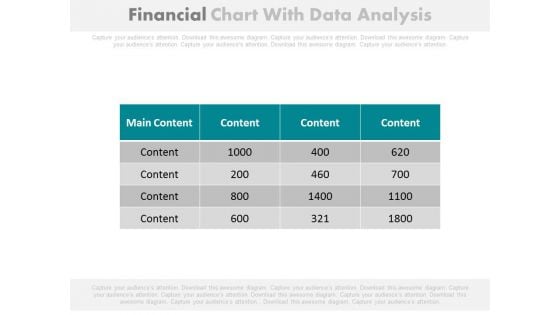
Financial Figures Data Analysis Report Powerpoint Slides
Our above PowerPoint template contains table chart with financial figures. This professional slide may be used to display data analysis report. Enlighten your audience with your breathtaking ideas.
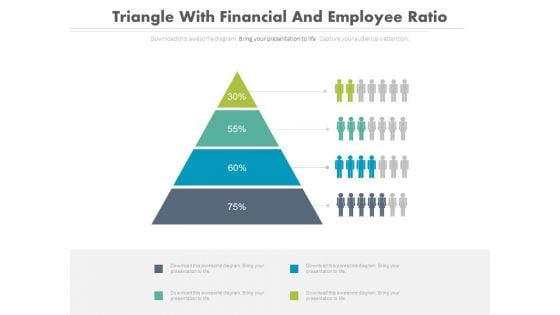
Triangle For Teams Performance Analysis Powerpoint Slides
This PPT slide displays graphics of triangle diagram with teams icons. Download this PowerPoint template for teams performances analysis. Use this PowerPoint template to emphasize your views.
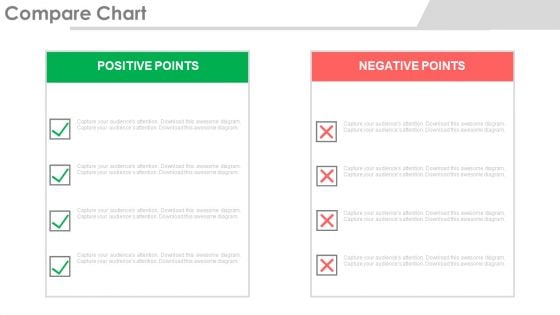
Compare Chart For Interactive Session Powerpoint Slides
This professional slide contains design of checklists of positive and negative points. You may use this compare chart for interactive session. Add this slide to your presentation and impress your superiors.
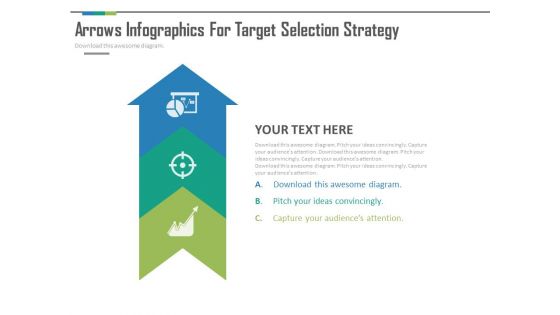
Arrow Infographics With Three Steps Powerpoint Slides
This PowerPoint template contains design of arrow infographic. Download this diagram slide to depict three steps of strategic analysis. Use this PPT slide to make impressive presentations.

Mobile For Team Performance Analysis Powerpoint Slides
This PowerPoint template graphics of mobile with team members photos. Download this PPT slide for team performance analysis. This PowerPoint slide is of great help in the business sector to make realistic presentations and provides effective way of presenting your newer thoughts.
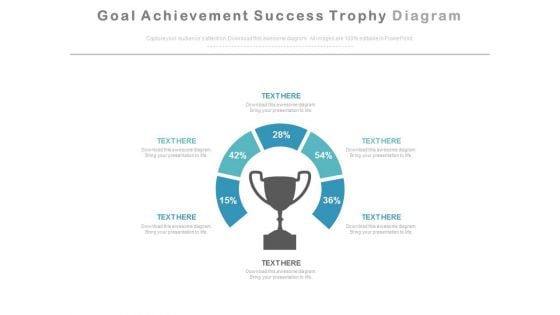
Goal Achievement Success Trophy Diagram Powerpoint Slides
This PPT slide contains circular graphics around trophy. You may download this PowerPoint template to display goal achievement facts, figures and achievement statistics. Impress your audiences by using this PPT slide.
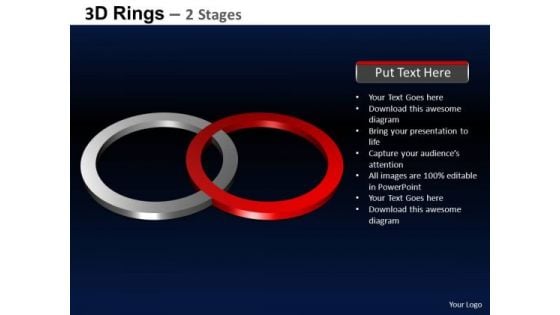
PowerPoint Design Slides Process Rings Ppt Process
PowerPoint Design Slides Process Rings PPT Process-These high quality, editable pre-designed powerpoint slides have been carefully created by our professional team to help you impress your audience. Each graphic in every slide is vector based and is 100% editable in powerpoint. Each and every property of any slide - color, size, shading etc can be modified to build an effective powerpoint presentation. Use these slides to convey complex business concepts in a simplified manner. Any text can be entered at any point in the powerpoint slide. Simply DOWNLOAD, TYPE and PRESENT! Check the air with our PowerPoint Design Slides Process Rings Ppt Process. Your feelers will recieve appropriate responses.
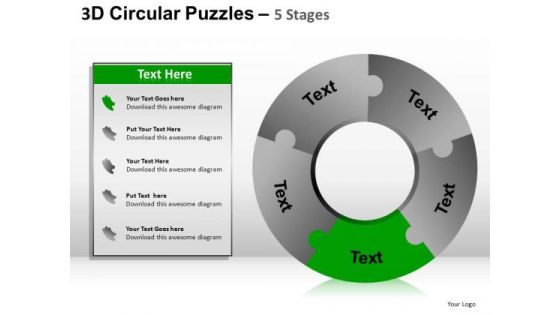
PowerPoint Templates Cycle Diagram Puzzle Ppt Slides
PowerPoint Templates Cycle Diagram puzzle PPT Slides-These high quality, editable pre-designed powerpoint slides have been carefully created by our professional team to help you impress your audience. Each graphic in every slide is vector based and is 100% editable in powerpoint. Each and every property of any slide - color, size, shading etc can be modified to build an effective powerpoint presentation. Use these slides to convey complex business concepts in a simplified manner. Any text can be entered at any point in the powerpoint slide. Simply DOWNLOAD, TYPE and PRESENT! Identify probable false alarms in advance. Establish correct checks with our PowerPoint Templates Cycle Diagram Puzzle Ppt Slides.
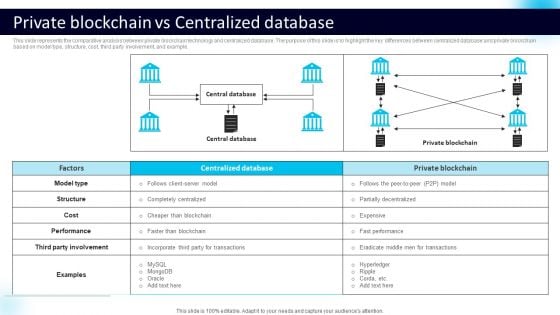
Private Blockchain Vs Centralized Database Slides PDF
This slide represents the comparative analysis between private blockchain technology and centralized database. The purpose of this slide is to highlight the key differences between centralized database and private blockchain based on model type, structure, cost, third party involvement, and example. Are you searching for a Private Blockchain Vs Centralized Database Slides PDF that is uncluttered, straightforward, and original Its easy to edit, and you can change the colors to suit your personal or business branding. For a presentation that expresses how much effort you have put in, this template is ideal With all of its features, including tables, diagrams, statistics, and lists, its perfect for a business plan presentation. Make your ideas more appealing with these professional slides. Download Private Blockchain Vs Centralized Database Slides PDF from Slidegeeks today.
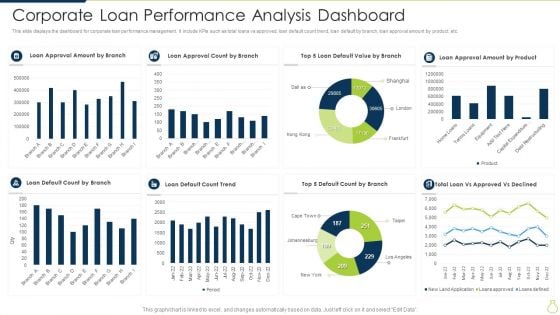
Corporate Loan Performance Analysis Dashboard Slides PDF
This slide displays the dashboard for corporate loan performance management. It include KPIs such as total loans vs approved, loan default count trend, loan default by branch, loan approval amount by product, etc. Showcasing this set of slides titled Corporate Loan Performance Analysis Dashboard Slides PDF. The topics addressed in these templates are Loan Default Count Trend, Loan Approval Count By Branch, Loan Approval Amount By Product. All the content presented in this PPT design is completely editable. Download it and make adjustments in color, background, font etc. as per your unique business setting.
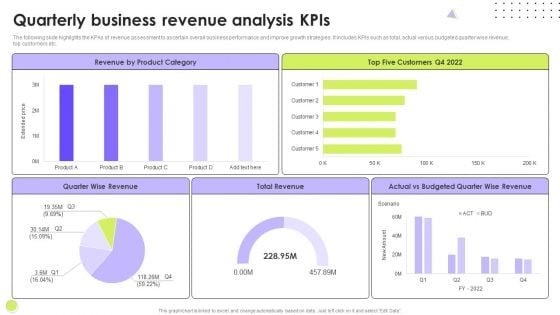
Quarterly Business Revenue Analysis Kpis Slides PDF
The following slide highlights the KPAs of revenue assessment to ascertain overall business performance and improve growth strategies. It includes KPIs such as total, actual versus budgeted quarter wise revenue, top customers etc. Showcasing this set of slides titled Quarterly Business Revenue Analysis Kpis Slides PDF. The topics addressed in these templates are Quarter Wise Revenue, Customers, Budgeted Quarter. All the content presented in this PPT design is completely editable. Download it and make adjustments in color, background, font etc. as per your unique business setting.
Icons Slides For Environmental Marketing Rules PDF
Introducing our well designed Icons Slides For Environmental Marketing Rules PDF set of slides. The slide displays editable icons to enhance your visual presentation. The icons can be edited easily. So customize according to your business to achieve a creative edge. Download and share it with your audience.
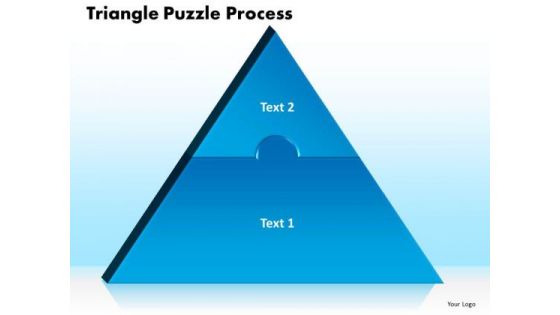
PowerPoint Theme Triangle Puzzle Process Ppt Slides
PowerPoint Theme Triangle Puzzle Process PPT Slides-This PowerPoint Diagram shows you the Triangle formed by two Jigsaw puzzles. It portrays obscure, perplex, pose, profundicate, psych out, put off, rattle, snow, stir, stumble, stump, and throw. You can apply other 3D Styles and shapes to the slide to enhance your presentations.-PowerPoint Theme Triangle Puzzle Process PPT Slides Our PowerPoint Theme Triangle Puzzle Process Ppt Slides will faithfully convey your message. They will adhere to your way of thinking.
Swot Analysis Diagram With Icons Powerpoint Slides
This PowerPoint template has been designed with circular diagram of SWOT analysis. This PPT slide displays infographic diagram of SWOT analysis. Present your opinions in impressive manner using this professional template.
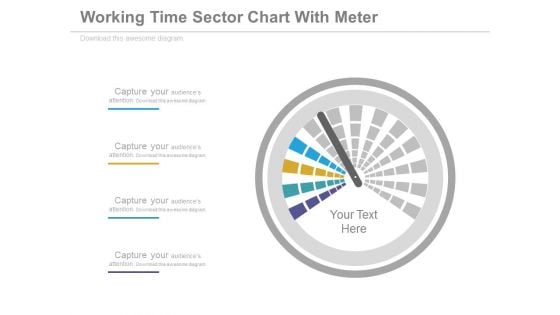
Dashboard Performance Analysis Chart Powerpoint Slides
This PowerPoint template graphics of meter chart. Download this PPT chart for business performance analysis. This PowerPoint slide is of great help in the business sector to make realistic presentations and provides effective way of presenting your newer thoughts.
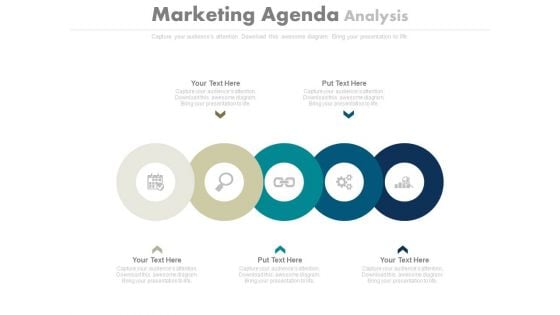
Circles For Marketing Agenda Analysis Powerpoint Slides
This PowerPoint template contains five circles in linear flow with icons. You may download this slide to display marketing agenda analysis. You can easily customize this template to make it more unique as per your need.
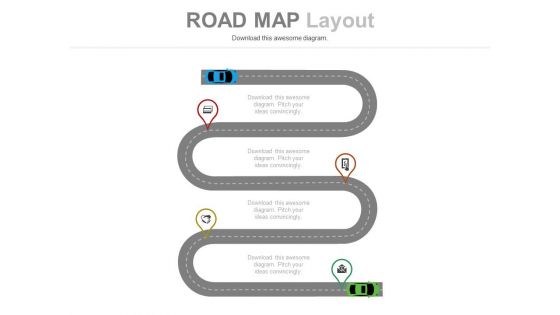
Linear Roadmap For Success Analysis Powerpoint Slides
This infographic timeline template can be used for multiple purposes including event planning, new milestones and tasks. This PPT slide may be helpful to display success steps and analysis. Download this PowerPoint timeline template to make impressive presentations.
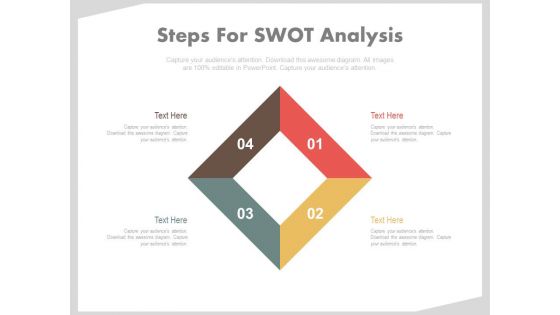
Diamond Design For Swot Analysis Powerpoint Slides
This PPT slide has been designed with graphics of four steps diamond diagram. This business diagram helps to exhibit SWOT analysis. Use this PowerPoint template to build an exclusive presentation.
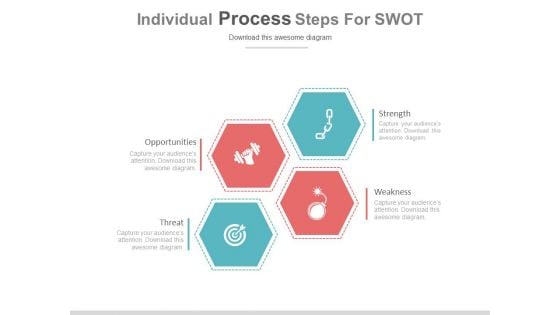
Infographic Diagram For Swot Analysis Powerpoint Slides
This PPT slide has been designed with infographic diagram of four boxes. This business diagram helps to exhibit SWOT analysis. Use this PowerPoint template to build an exclusive presentation.
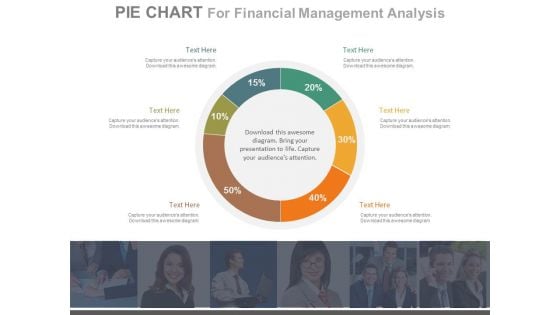
Pie Chart For Customer Analysis Powerpoint Slides
This PowerPoint template has been designed with percentage ratio pie chart. This PPT slide can be used to display customer analysis. You can download finance PowerPoint template to prepare awesome presentations.
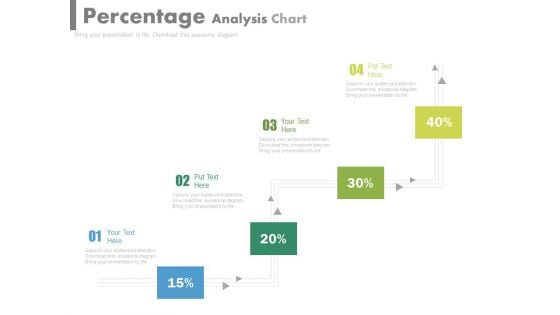
Pipeline Percentage Analysis Chart Powerpoint Slides
This PowerPoint template has been designed with pipeline percentage analysis chart. This PPT slide can be used to display business strategy plan. You can download finance PowerPoint template to prepare awesome presentations.
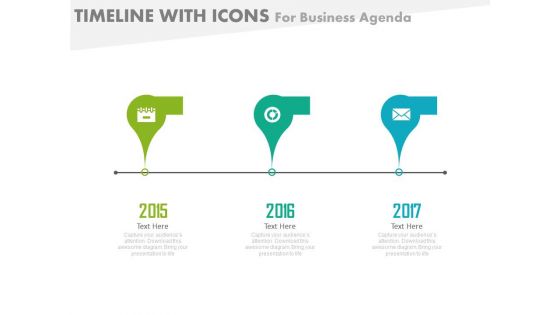
Three Staged Business Strategy Analysis Powerpoint Slides
This PowerPoint template contains three staged timeline diagram. It may be used to display analysis of business strategy. Download this PPT slide to demonstrate how you intend to navigate your steps towards the desired corporate goal.
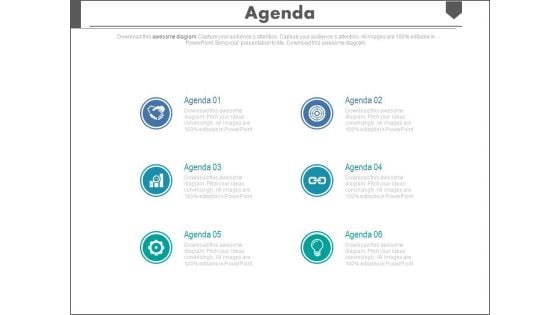
Sales Agenda Analysis Infographic Diagram Powerpoint Slides
This PowerPoint template has been designed with sales agenda analysis infographic diagram. Download this PPT slide to depict important matters of business meeting. The structure of our template allows you to effectively highlight the key issues concerning to your agenda.
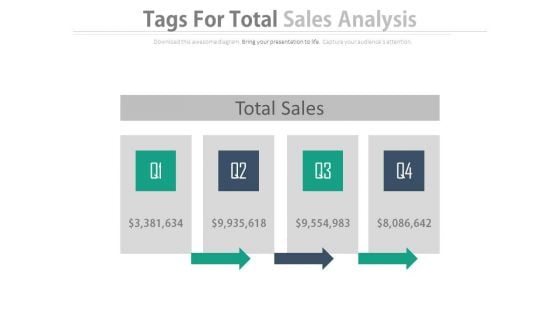
Table For Total Sales Analysis Powerpoint Slides
This PowerPoint template has been designed with four steps table chart. Use this PPT slide to display total sales analysis. Download this template to leave permanent impression on your audience.
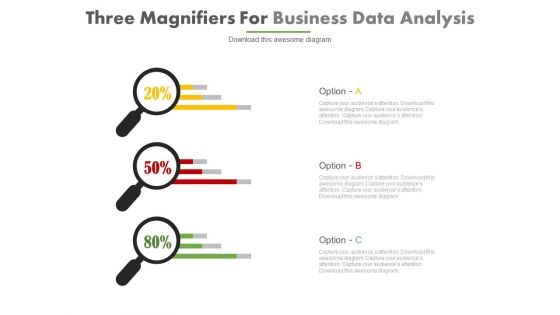
Three Magnifiers Situation Analysis Template Powerpoint Slides
This PowerPoint template has been designed with graphics of three magnifiers. This PPT slide can be used to analyze business situation. You can download finance PowerPoint template to prepare awesome presentations.

Stopwatch With Percentage Value Analysis Powerpoint Slides
The above template displays a diagram of stopwatch with percentage value. This diagram has been professionally designed to emphasize on time management. Grab center stage with this slide and capture the attention of your audience.
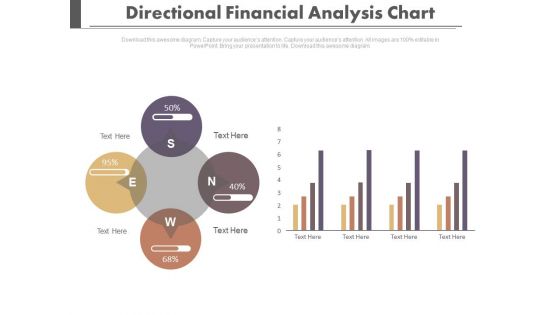
Four Directions Circular Analysis Chart Powerpoint Slides
Our professionally designed business diagram is as an effective tool for communicating business strategy. It contains four directional circular charts. Above slide is also suitable to display financial planning and strategy.


 Continue with Email

 Home
Home


