Technology Architecture
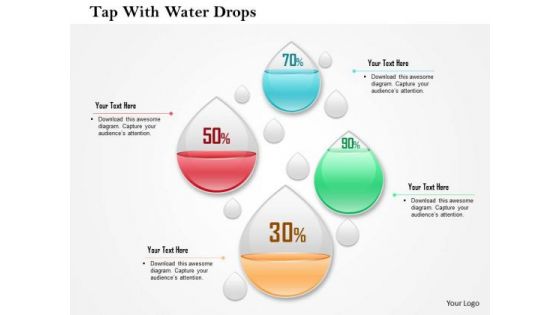
Business Diagram Four Water Drops With Percentage Values Presentation Template
This business diagram has been designed with graphic of four water drops and percentage values. This slide may be used to display percentage values for business analysis. Use this editable diagram for finance and business related presentations.

3d Man On The Top Of Puzzle Bar Graph
This PPT has been designed with graphic of 3d man and puzzle are graph. This PPT displays the concept of result analysis and financial growth. Use this PPT for your business and finance related presentations.
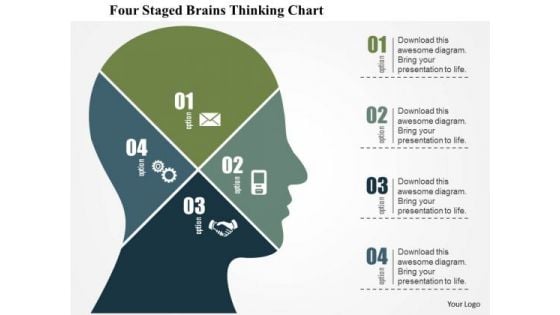
Business Diagram Four Staged Brains Thinking Chart Presentation Template
Graphic of four staged chart in human brain has been used to design this business diagram. This slide depicts concept of thinking process and analysis. Make your presentation more interactive with this business slide.
Business Diagram Six Icons For Communication Presentation Template
Our above business diagram has been designed with six business icons. You may present market analysis using this diagram. Pressure cooks your views with this diagram. You will hear whistles of appreciation.
Business Diagram Business Man With Puzzles Icon Presentation Template
Graphic of business man with puzzles icons has been used to design this power point template. This diagram slide helps to portray concept like business strategy and analysis. Use this diagram to organize your thoughts and ideas.
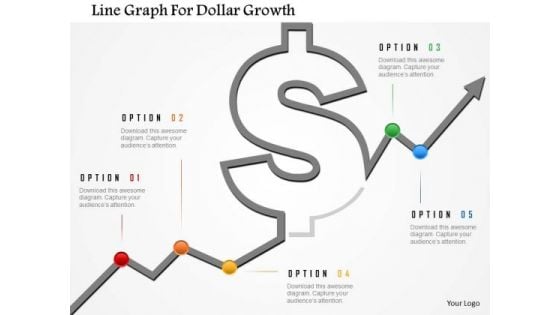
Business Diagram Line Graph For Dollar Growth Presentation Template
Graphic of dollar symbol and growth arrow has been used to design this power point template. This diagram contains the concept of financial result analysis. Use this business diagram for finance related presentations
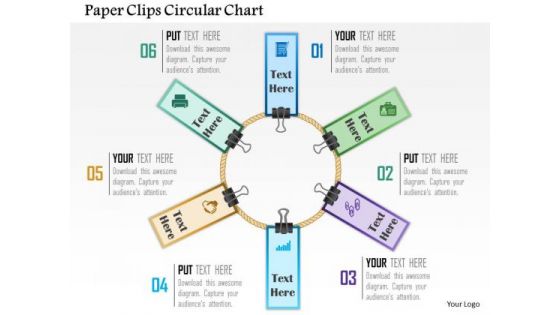
Business Diagram Paper Clips Circular Chart Presentation Template
This power point template has been designed with graphic of circular chart made with paper clips. These business icons are used to display the concept of business result analysis and meeting. Use this diagram for business and marketing presentations.
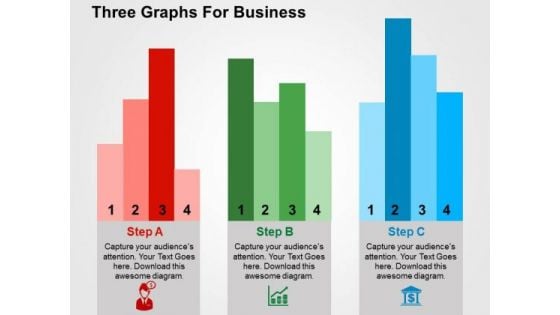
Three Graphs For Business PowerPoint Template
Adjust the above image into your Presentations to visually support your content. This slide has been professionally designed to exhibit business analysis. This template offers an excellent background to build impressive presentation.
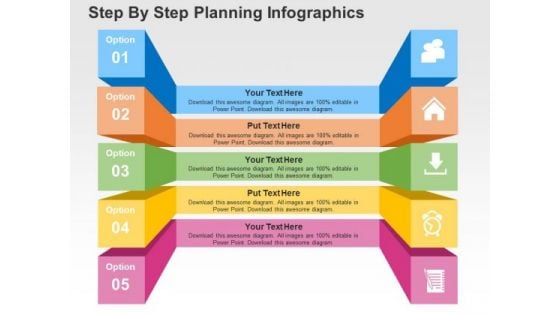
Step By Step Planning Infographics PowerPoint Templates
The above slide displays five text boxes with icons. This template has been designed to present market plan and analysis. Imprint your concepts with this PPT slide in your presentations.
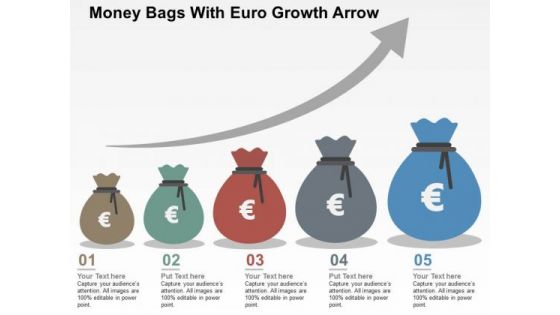
Money Bags With Euro Growth Arrow PowerPoint Templates
The above PPT slide contains graphics of money bag with Euro growth graph. This professionally designed slide may be used to depict financial growth analysis. This slide will help your viewers automatically empathize with your thoughts
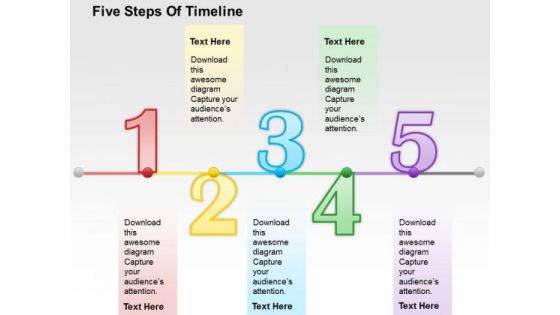
Five Steps Of Timeline PowerPoint Template
This business slide has been designed with graphics of business timeline. You may download this diagram to display timeline, planning and business analysis. Download this diagram slide to make impressive presentations.
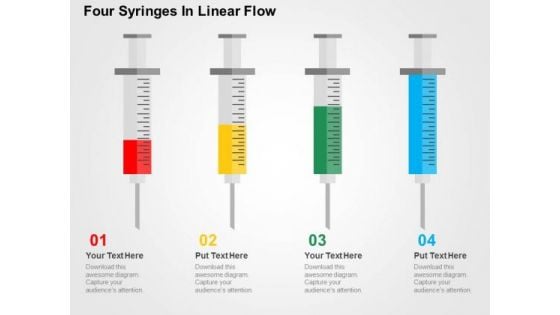
Four Syringes In Linear Flow PowerPoint Template
Graphic of four syringes in linear flow has been used to design this business diagram. This diagram slide may be used to depict business steps in linear flow. Download this diagram for business research and analysis.
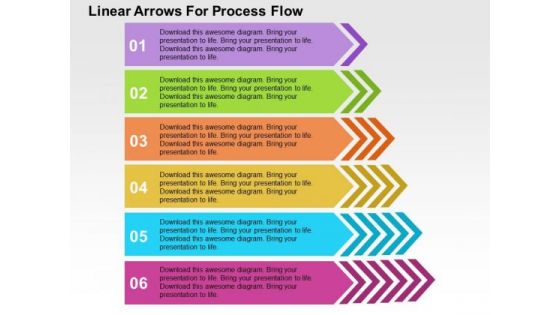
Linear Arrows For Process Flow PowerPoint Template
Graphic of arrows in linear flow has been used to design this business diagram. This diagram slide may be used to depict business steps in linear flow. Download this diagram for business research and analysis.
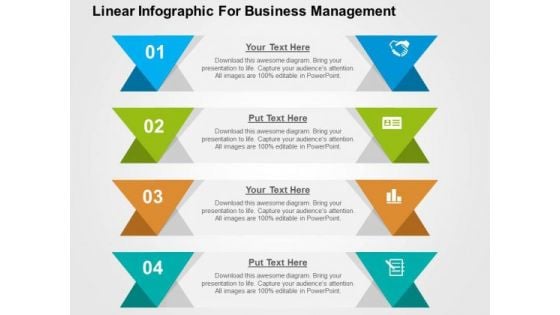
Linear Infographic For Business Management PowerPoint Template
Graphic of tags in linear flow has been used to design this business diagram. This diagram slide may be used to depict business steps in linear flow. Download this diagram for business research and analysis.
Five Options Bar Graph With Icons Powerpoint Template
This PowerPoint slide has been designed with five options bar graph and icons. This slide of bar graph is suitable for statistical analysis. This professional slide helps in making an instant impact on viewers.
Five Circular Steps With Business Icons Powerpoint Templates
This business diagram has been designed with circular graphics with business icons. This slide suitable for business analysis and strategy presentation. Use this diagram to present your views in a wonderful manner.
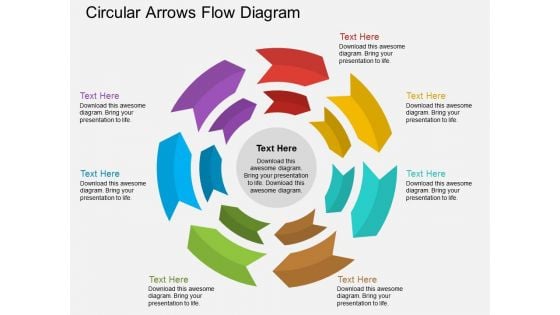
Circular Arrows Flow Diagram Powerpoint Template
This power point template has been designed with graphics of circular arrow flow diagram. This PPT diagram may be used to display marketing analysis. Use this PPT diagram for business presentations.
Circular Infographics Puzzle Diagram With Icons Powerpoint Template
This power point template has been designed with circular infographic puzzle diagram. This PPT diagram may be used to display marketing analysis. Use this PPT diagram for business presentations.
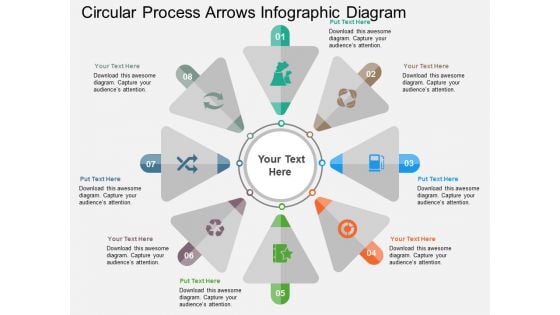
Circular Process Arrows Infographic Diagram Powerpoint Template
This power point template has been designed with graphics of circular arrow flow diagram. This PPT diagram may be used to display marketing analysis. Use this PPT diagram for business presentations.
Circular Process Flow Diagram And Icons Powerpoint Template
This power point template has been designed with graphics of circular process flow diagram. This PPT diagram may be used to display marketing analysis. Use this PPT diagram for business presentations.
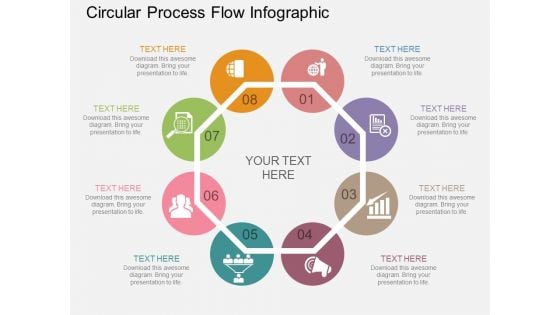
Circular Process Flow Infographic Powerpoint Template
This power point template has been designed with graphics of circular process infographic. This PPT diagram may be used to display marketing analysis. Use this PPT diagram for business presentations.
Circular Workflow Diagram With Icons Powerpoint Template
This power point template has been designed with graphics of circular process infographic. This PPT diagram may be used to display marketing analysis. Use this PPT diagram for business presentations.
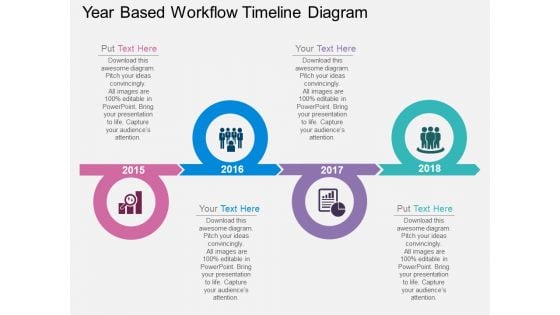
Year Based Workflow Timeline Diagram Powerpoint Template
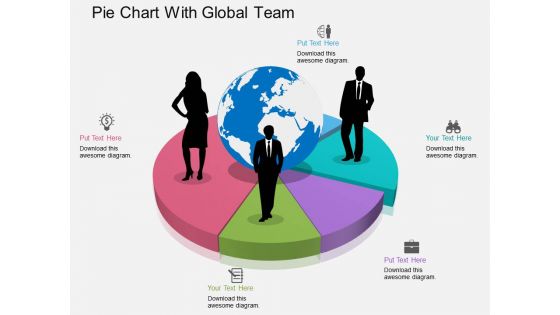
Pie Chart With Global Team Powerpoint Template
This PowerPoint template has been designed with graphics of pie chart with global team. This diagram can be used to display team performance and analysis. Capture the attention of your audience with this slide.
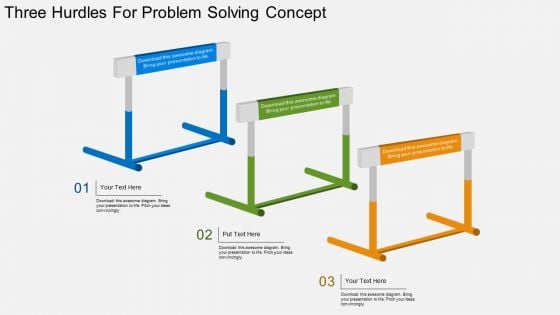
Three Hurdles For Problem Solving Concept Powerpoint Template
This PowerPoint template has been designed with graphics of three hurdles. This PPT slide is best to describe business strategy analysis. You can provide a fantastic explanation of the topic with this slide.
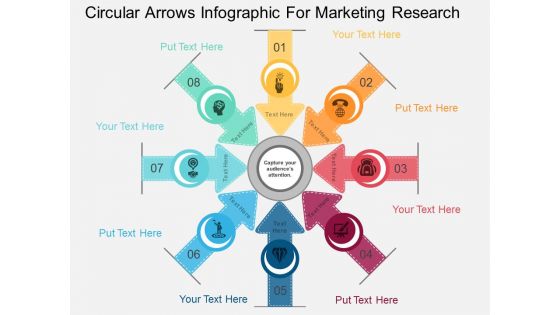
Circular Arrows Infographic For Marketing Research Powerpoint Template
This PPT slide has been designed with circular arrows infographic diagram. This business diagram is suitable for marketing research and analysis. This professional slide helps in making an instant impact on viewers.
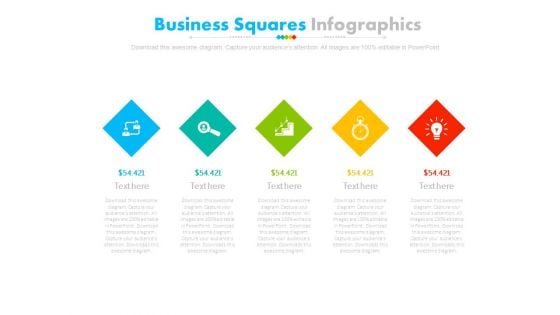
Five Steps Diamond Infographic Diagram Powerpoint Slides
This PowerPoint template has been designed with alphabet steps with icons. This PPT slide may be used to display financial strategy analysis. Make outstanding business presentation with this template.
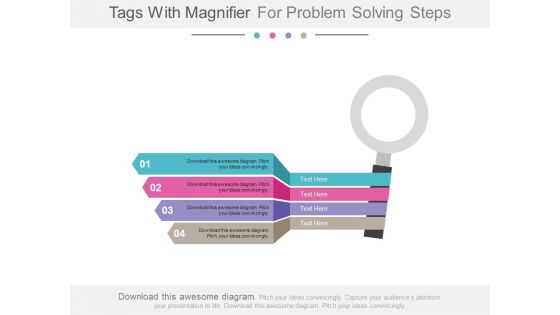
Four Tags With Magnifier For Solution Powerpoint Slides
Visually support your presentation with our above template showing graphics of magnifier with text tags. This PPT slide has been professionally designed to present market research and analysis. This template offers an excellent background to build impressive presentation.
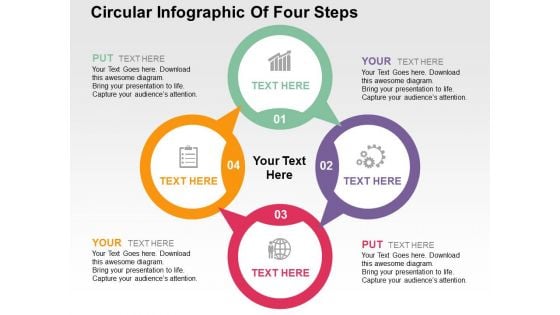
Circular Infographic Of Four Steps Powerpoint Templates
Visually support your presentation with our above template showing circular Infographic. This slide has been professionally designed to emphasize the concept of market research and analysis. Deliver amazing presentations to mesmerize your audience.
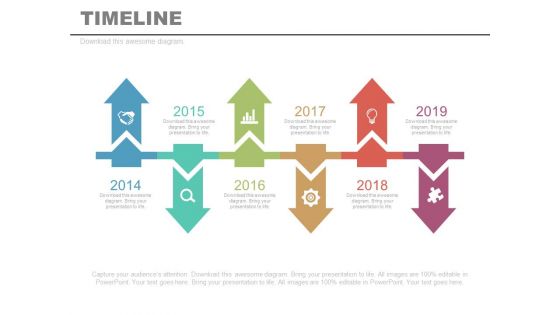
Six Linear Timeline Arrows Year Diagram Powerpoint Slides
This PowerPoint template has been designed with linear timeline steps. This PPT slide may be helpful to display year based business analysis. Download this PowerPoint timeline template to make impressive presentations.
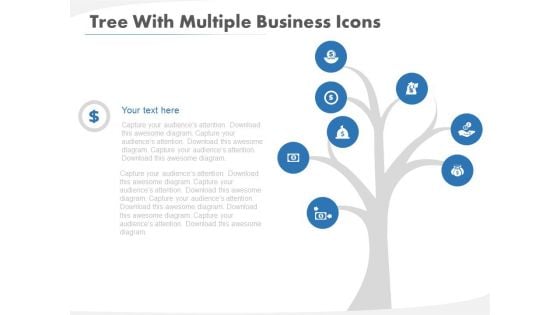
Tree Diagram For Strategic Planning Methods Powerpoint Template
This PowerPoint template has been designed with tree diagram and icons. This diagram slide may be used to depict strategic planning methods. Download this diagram for business research and analysis.
Circular Chart With Icons For Value Chain Powerpoint Template
This PowerPoint template has been designed with circular chart and icons. This professional PPT slide is suitable to present value chain analysis. Capture the attention of your audience using this professional slide.

Chart For Employees Performance Measurement Powerpoint Slides
This PowerPoint template has been designed with graphics of compare chart. You may download this diagram slide for analysis of employee performance. Add this slide to your presentation and impress your superiors.
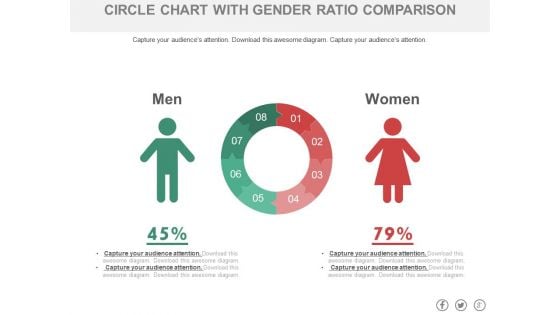
Circle Chart With Man And Woman Ratio Comparison Powerpoint Slides
This PowerPoint template has been designed with graphics of circle chart. You may download this PPT slide to depict man and woman ratio analysis. Add this slide to your presentation and impress your superiors.
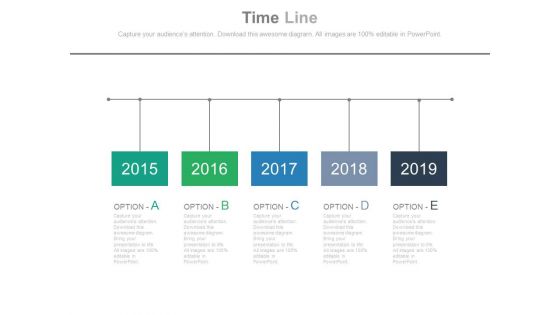
Five Options Timeline Diagram With Years Tags Powerpoint Slides
This PowerPoint template has been designed with five options timeline diagram with years tags. This PPT slide may be helpful to display year based business analysis. Download this PowerPoint timeline template to make impressive presentations.
Five Pointers Timeline Diagram With Icons Powerpoint Slides
This PowerPoint template has been designed with five pointers timeline diagram with icons. This PPT slide may be helpful to display business growth and analysis. Download this PowerPoint timeline template to make impressive presentations.
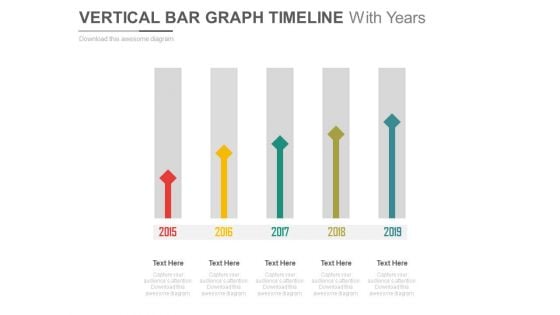
Vertical Arrows Timeline With Years Powerpoint Slides
This PowerPoint template has been designed with sequential arrows timeline diagram. This PPT slide may be helpful to display year based business analysis. Download this PowerPoint timeline template to make impressive presentations.
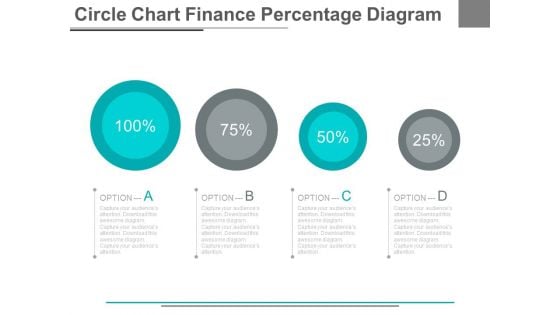
Four Options Circle Chart With Percentage Powerpoint Slides
This PowerPoint template has been designed with graphics of four options circle chart. This PowerPoint template may be used to display four steps of financial analysis. Prove the viability of your ideas using this impressive slide.
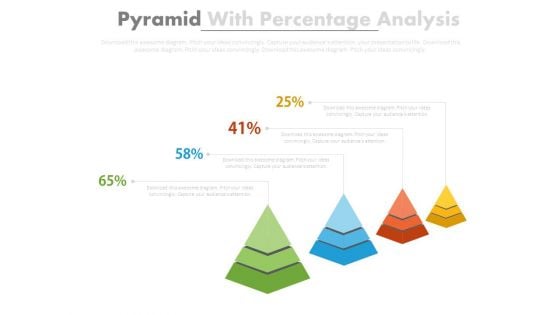
Four Pyramids With Growth Steps Powerpoint Slides
This business slide has been designed with four pyramids. This PowerPoint template may use to display sales growth and analysis. Prove the viability of your ideas using this impressive slide.
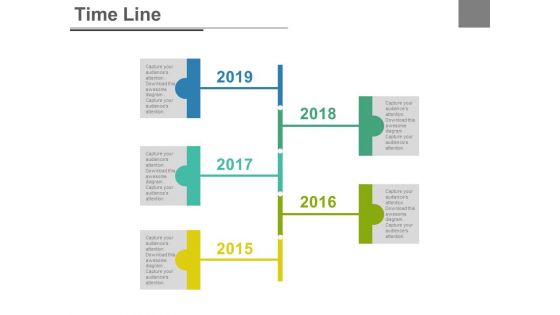
Five Staged Business Timeline Report Powerpoint Slides
This PowerPoint template has been designed with five staged business timeline report diagram. This PPT slide may be helpful to display year based business analysis. Download this PowerPoint timeline template to make impressive presentations.
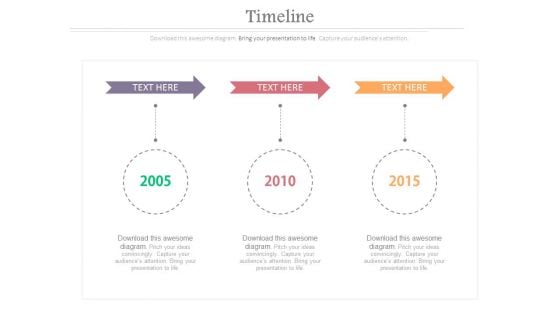
Three Arrows With Years For Timeline Planning Powerpoint Slides
This PowerPoint template has been designed with three arrows and years. This timeline template may be used to display business planning and analysis. Download this PowerPoint timeline template to make impressive presentations.
Market Trends Chart With Percentage And Icons Powerpoint Slides
This PowerPoint template has been designed with graphics of chart with percentage values and icons. This PowerPoint template may be used to market trends and financial analysis. Prove the viability of your ideas using this impressive slide.

Three Person Tags With Skill Percentage Charts Powerpoint Slides
This PowerPoint template has been designed with three person?s tags with percentage values. This Info graphic diagram may be used to display team skill analysis. Download this impressive diagram to build unique presentations.
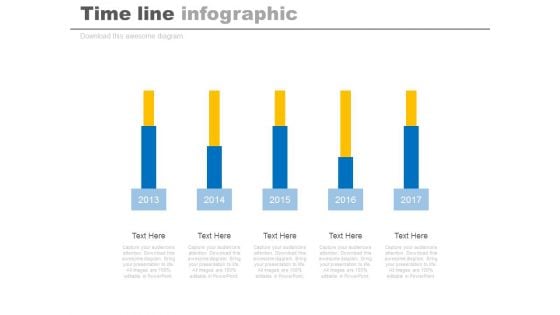
Five Years Planning Timeline Chart Powerpoint Slides
This timeline diagram displays five sequential year steps. This PowerPoint template may be used to display when statistical analysis. This timeline design is most useful for showing important milestones and deadlines.
Two Layered Venn Diagram With Icons Powerpoint Slides
This power point template has been designed with graphic of two layered Venn diagram. Use this Venn diagram for business strategy and analysis. Illustrate your ideas and imprint them in the minds of your team with this template.
Magnifying Glass With Team And Icons Powerpoint Slides
This PPT slide contains graphics of magnifying glass with team and icons. You may use this PowerPoint template team strategy and analysis. Download this team slide design to deliver amazing presentations.
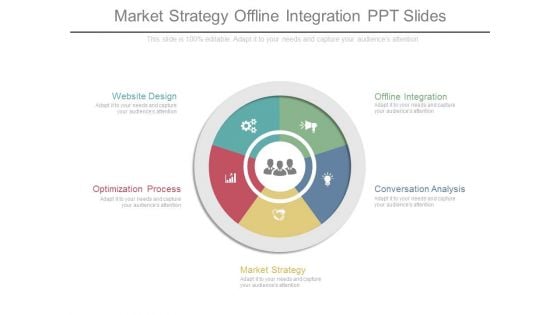
Market Strategy Offline Integration Ppt Slides
This is a market strategy offline integration ppt slides. This is a five stage process. The stages in this process are website design, offline integration, optimization process, conversation analysis, market strategy.
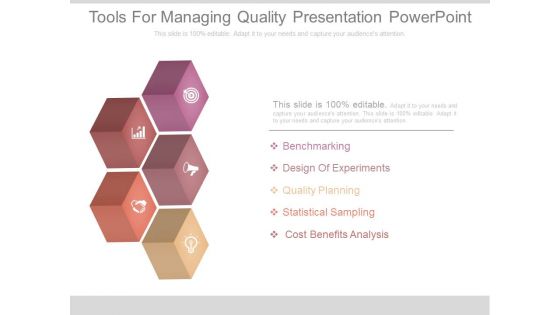
Tools For Managing Quality Presentation Powerpoint
This is a tools for managing quality presentation powerpoint. This is a five stage process. The stages in this process are benchmarking, design of experiments, quality planning, statistical sampling, cost benefits analysis.
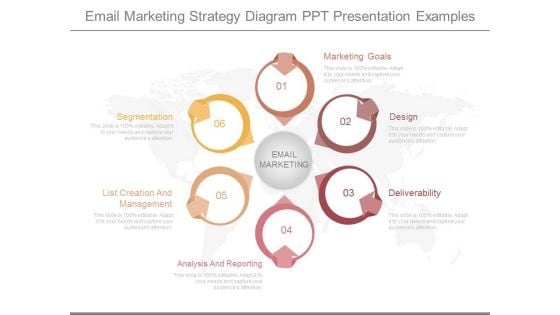
Email Marketing Strategy Diagram Ppt Presentation Examples
This is a email marketing strategy diagram ppt presentation examples. This is a six stage process. The stages in this process are segmentation, list creation and management, analysis and reporting, email marketing, marketing goals, design, deliverability.
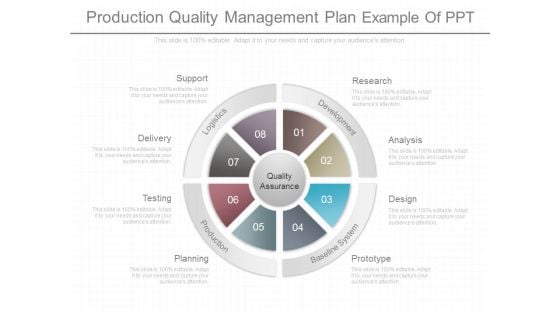
Production Quality Management Plan Example Of Ppt
This is a production quality management plan example of ppt. This is a eight stage process. The stages in this process are support, delivery, testing, planning, research, analysis, design, prototype.

Agile Development Life Cycle Ppt Powerpoint Slide Background
This is a agile development life cycle ppt powerpoint slide background. This is a seven stage process. The stages in this process are planning, evaluation, testing, requirements, analysis and design, implementation, deployment.
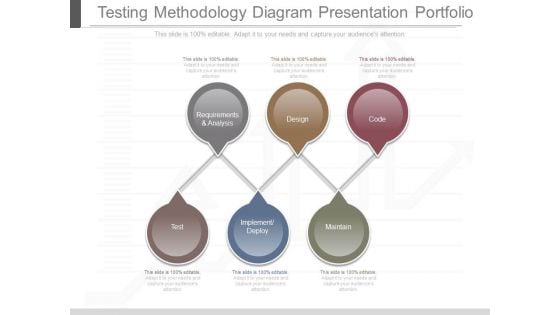
Testing Methodology Diagram Presentation Portfolio
This is a testing methodology diagram presentation portfolio. This is a six stage process. The stages in this process are requirements and analysis, design, code, test, implement deploy, maintain.

Develop Marketing Strategy Diagram Powerpoint Slides
This is a develop marketing strategy diagram powerpoint slides. This is a five stage process. The stages in this process are design and execution, understanding customer, analysis swot, review and revise, market competition, planning marketing mix, marketing network.\n\n\n\n
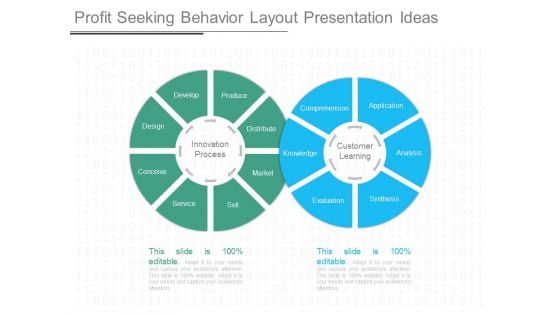
Profit Seeking Behavior Layout Presentation Ideas
This is a profit seeking behavior layout presentation ideas. This is a two stage process. The stages in this process are customer learning, application, analysis, synthesis, evaluation, knowledge, comprehension, innovation process, develop, produce, distribute, market, sell, service, conceive, design.
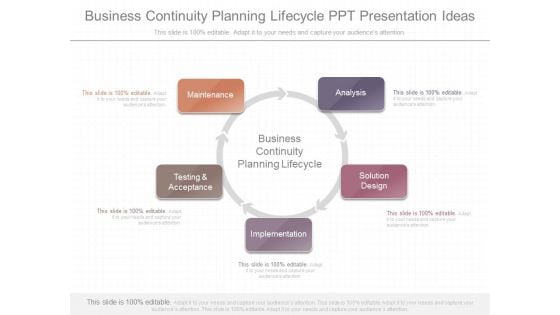
Business Continuity Planning Lifecycle Ppt Presentation Ideas
This is a business continuity planning lifecycle ppt presentation ideas. This is a five stage process. The stages in this process are maintenance, analysis, solution design, implementation, testing and acceptance, business continuity planning lifecycle.
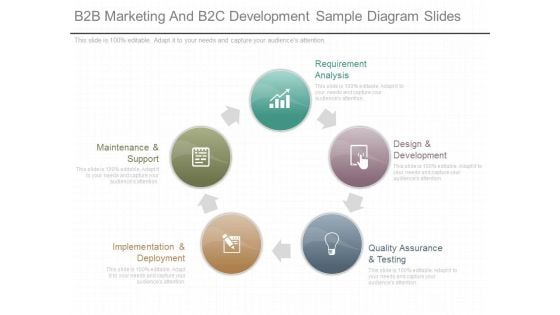
B2B Marketing And B2C Development Sample Diagram Slides
This is a b2b marketing and b2c development sample diagram slides. This is a five stage process. The stages in this process are requirement analysis, design and development, quality assurance and testing, implementation and deployment, maintenance and support.
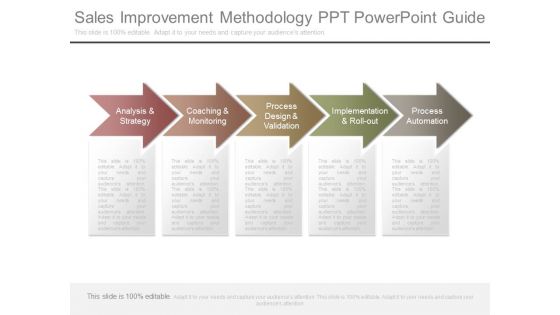
Sales Improvement Methodology Ppt Powerpoint Guide
This is a sales improvement methodology ppt powerpoint guide. This is a five stage process. The stages in this process are analysis and a strategy, coaching and monitoring, process design and validation, implementation and roll out, process automation.
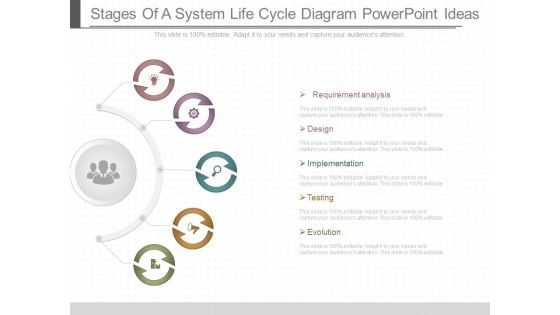
Stages Of A System Life Cycle Diagram Powerpoint Ideas
This is a stages of a system life cycle diagram powerpoint ideas. This is a five stage process. The stages in this process are requirement analysis, design, implementation, testing, evolution.
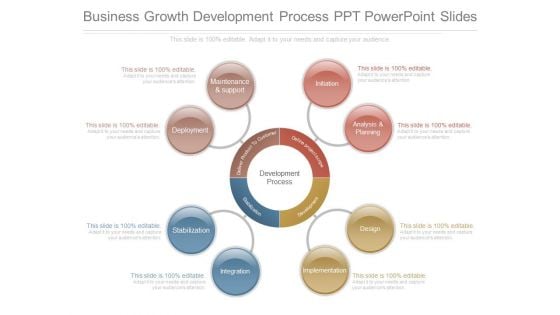
Business Growth Development Process Ppt Powerpoint Slides
This is a business growth development process ppt powerpoint slides. This is a eight stage process. The stages in this process are initiation, analysis and planning, design, implementation, integration, stabilization, deployment, maintenance and support.
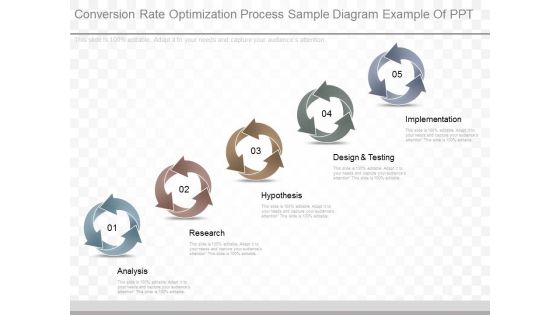
Conversion Rate Optimization Process Sample Diagram Example Of Ppt
This is a conversion rate optimization process sample diagram example of ppt. This is a five stage process. The stages in this process are implementation, design and testing, hypothesis, research, analysis.


 Continue with Email

 Home
Home


