Two Parts
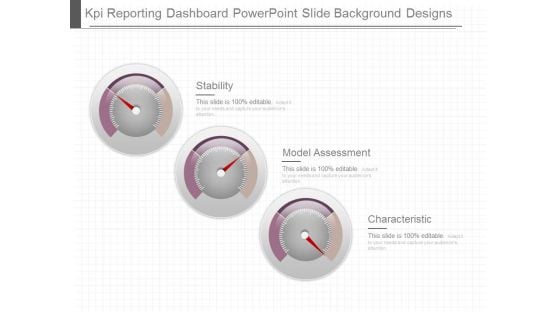
Kpi Reporting Dashboard Powerpoint Slide Background Designs
This is a kpi reporting dashboard powerpoint slide background designs. This is a three stage process. The stages in this process are stability, model assessment, characteristic.
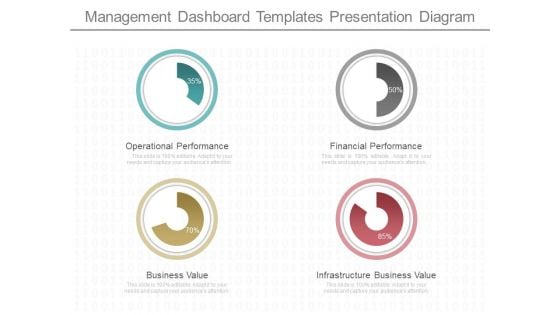
Management Dashboard Templates Presentation Diagram
This is a management dashboard templates presentation diagram. This is a four stage process. The stages in this process are operational performance, business value, financial performance, infrastructure business value.
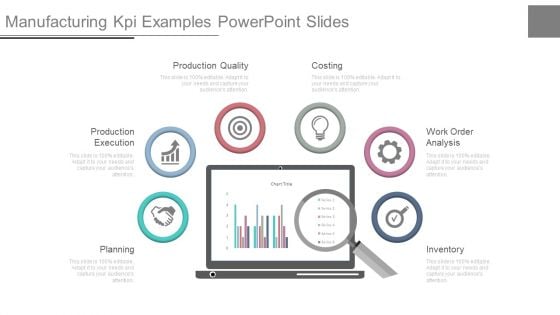
Manufacturing Kpi Examples Powerpoint Slides
This is a manufacturing kpi examples powerpoint slides. This is a six stage process. The stages in this process are planning, production execution, production quality, costing, work order analysis, inventory.
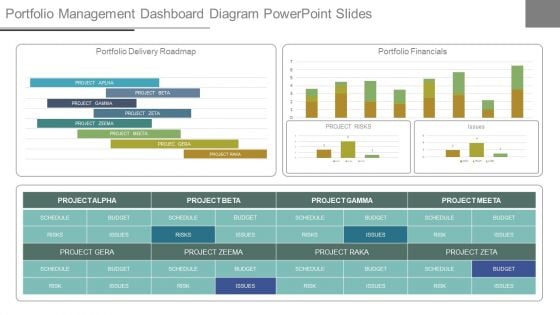
Portfolio Management Dashboard Diagram Powerpoint Slides
This is a portfolio management dashboard diagram powerpoint slides. This is a three stage process. The stages in this process are portfolio delivery roadmap, portfolio financials, project alpha, project beeta, project gama, project zeta, project zeema, schedule, risks, issues, budget.
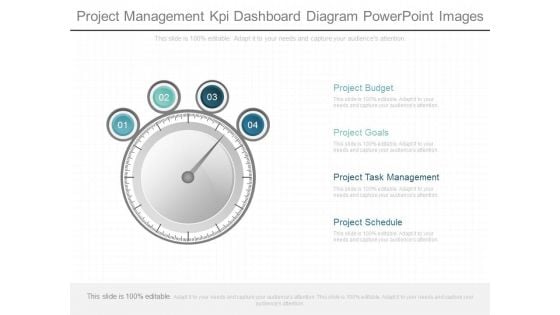
Project Management Kpi Dashboard Diagram Powerpoint Images
This is a project management kpi dashboard diagram powerpoint images. This is a four stage process. The stages in this process are project budget, project goals, project task management, project schedule.
Project Tracking Dashboard Template Ppt Sample
This is a project tracking dashboard template ppt sample. This is a five stage process. The stages in this process are requirements, analytics, needs, performance, analysis.
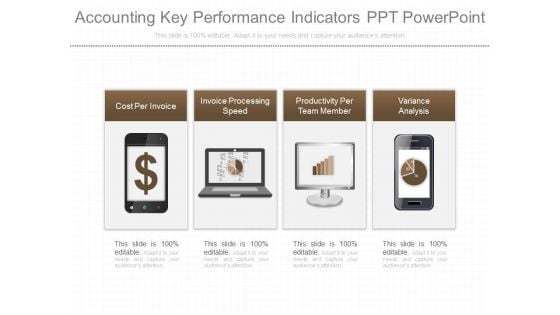
Accounting Key Performance Indicators Ppt Powerpoint
This is a accounting key performance indicators ppt powerpoint. This is a four stage process. The stages in this process are cost per invoice, invoice processing speed, productivity per team member, variance analysis.
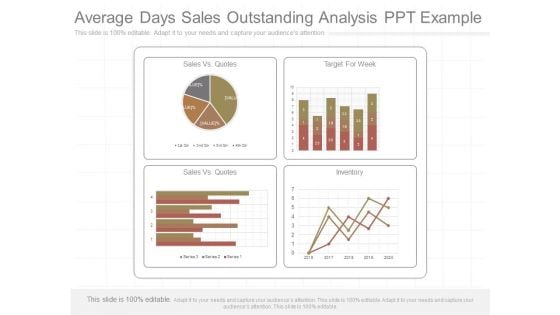
Average Days Sales Outstanding Analysis Ppt Example
This is a average days sales outstanding analysis ppt example. This is a four stage process. The stages in this process are target for week, inventory, sales vs quotes, sales vs quotes.
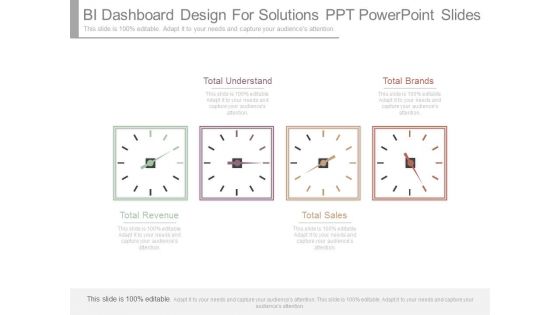
Bi Dashboard Design For Solutions Ppt Powerpoint Slides
This is a bi dashboard design for solutions ppt powerpoint slides. This is a four stage process. The stages in this process are total understand, total brands, total revenue, total sales.
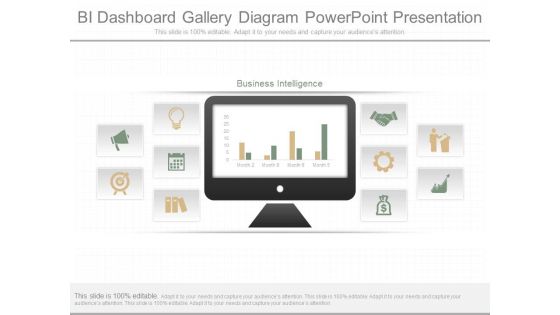
Bi Dashboard Gallery Diagram Powerpoint Presentation
This is a bi dashboard gallery diagram powerpoint presentation. This is a four stage process. The stages in this process are business intelligence, month.
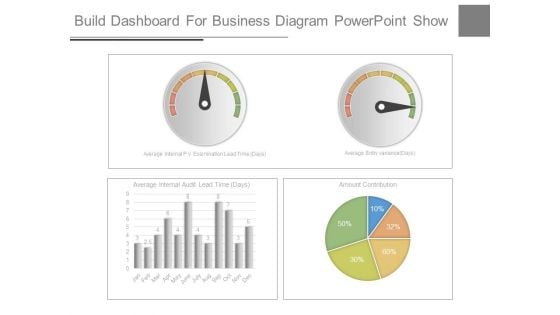
Build Dashboard For Business Diagram Powerpoint Show
This is a build dashboard for business diagram powerpoint show. This is a four stage process. The stages in this process are average internal pv examination lead time, average entry variance, average internal audit lead time, amount contribution.

Business Company Dashboards Ppt Powerpoint Slide Show
This is a business company dashboards ppt powerpoint slide show. This is a four stage process. The stages in this process are presentation, finance, management, business, strategy, success.
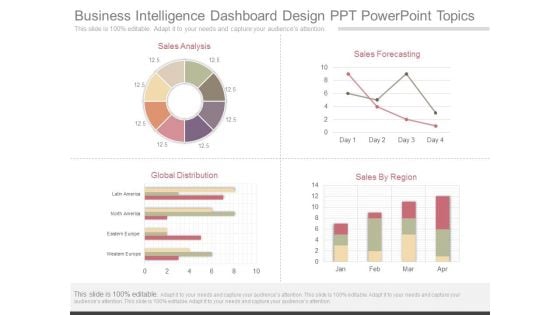
Business Intelligence Dashboard Design Ppt Powerpoint Topics
This is a business intelligence dashboard design ppt powerpoint topics. This is a four stage process. The stages in this process are sales analysis, sales forecasting, global distribution, sales by region, latin america, north america, eastern europe, western europe.
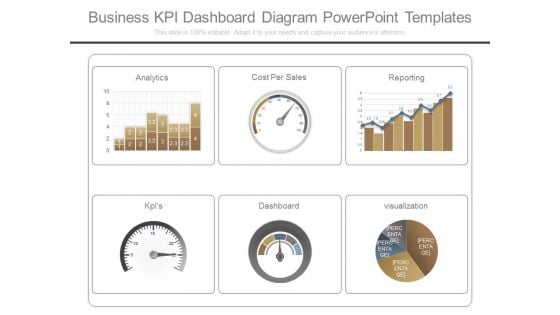
Business Kpi Dashboard Diagram Powerpoint Templates
This is a business kpi dashboard diagram powerpoint templates. This is a six stage process. The stages in this process are analytics, cost per sales, reporting, kpis, dashboard, visualization.
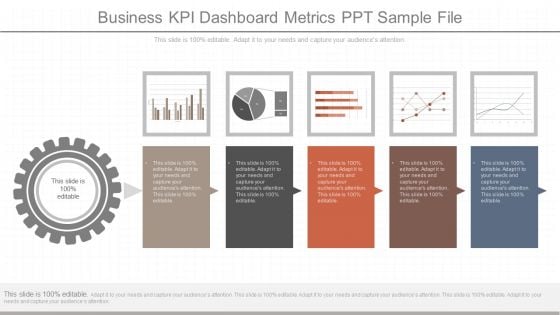
Business Kpi Dashboard Metrics Ppt Sample File
This is a business kpi dashboard metrics ppt sample file. This is a five stage process. The stages in this process are business, finance, management, success, marketing, presentation.
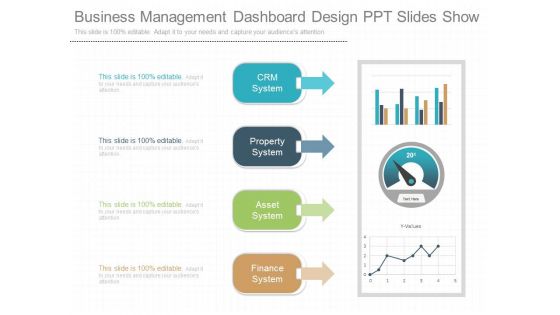
Business Management Dashboard Design Ppt Slides Show
This is a business management dashboard design ppt slides show. This is a four stage process. The stages in this process are crm system, property system, asset system, finance system.
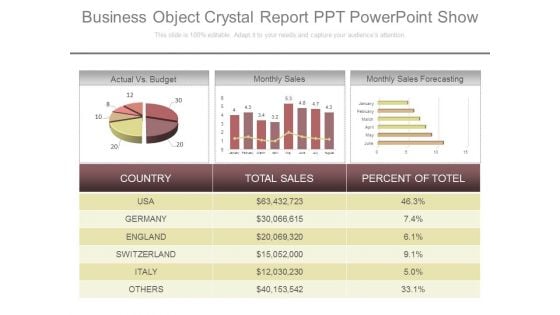
Business Object Crystal Report Ppt Powerpoint Show
This is a business object crystal report ppt powerpoint show. This is a three stage process. The stages in this process are actual vs budget, monthly sales, monthly sales forecasting, country, total sales, percent of total, usa, germany, england, switzerland, italy, others.
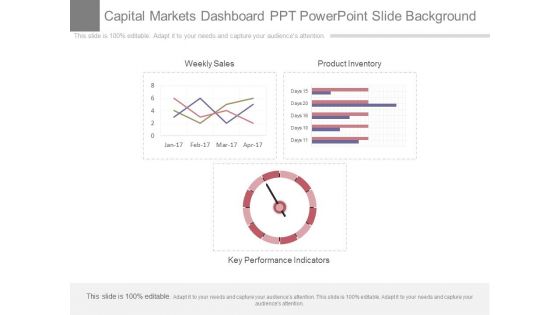
Capital Markets Dashboard Ppt Powerpoint Slide Background
This is a capital markets dashboard ppt powerpoint slide background. This is a three stage process. The stages in this process are weekly sales, product inventory, key performance indicators.
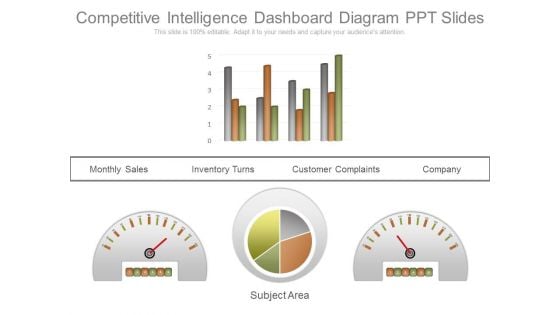
Competitive Intelligence Dashboard Diagram Ppt Slides
This is a competitive intelligence dashboard diagram ppt slides. This is a four stage process. The stages in this process are monthly sales, inventory turns, customer complaints, company, subject area.
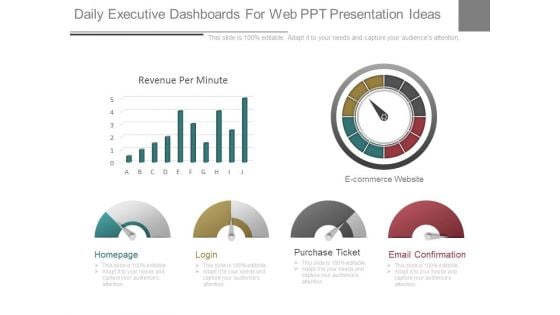
Daily Executive Dashboards For Web Ppt Presentation Ideas
This is a daily executive dashboards for web ppt presentation ideas. This is a six stage process. The stages in this process are homepage, login, purchase ticket, email confirmation, ecommerce website, revenue per minute.
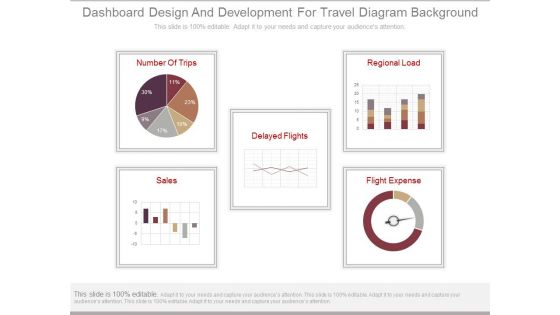
Dashboard Design And Development For Travel Diagram Background
This is a dashboard design and development for travel diagram background. This is a five stage process. The stages in this process are number of trips, sales, delayed flights, regional load, flight expense.
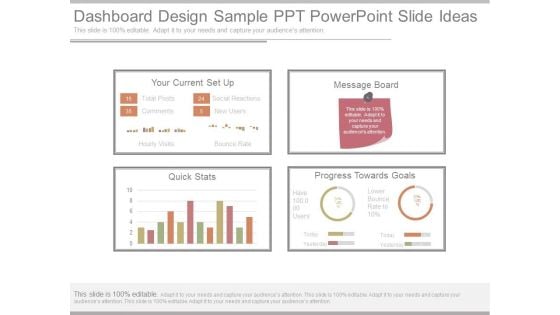
Dashboard Design Sample Ppt Powerpoint Slide Ideas
This is a dashboard design sample ppt powerpoint slide ideas. This is a four stage process. The stages in this process are your current setup, message board, quick stats, progress towards goals, total posts, comments, social reactions, new users, hourly visits, bounce rate.
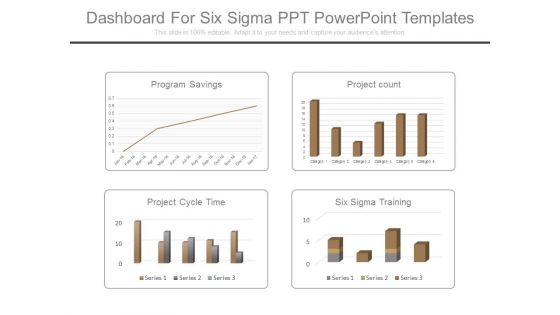
Dashboard For Six Sigma Ppt Powerpoint Templates
This is a dashboard for six sigma ppt powerpoint templates. This is a four stage process. The stages in this process are program savings, project count, project cycle time, six sigma training.
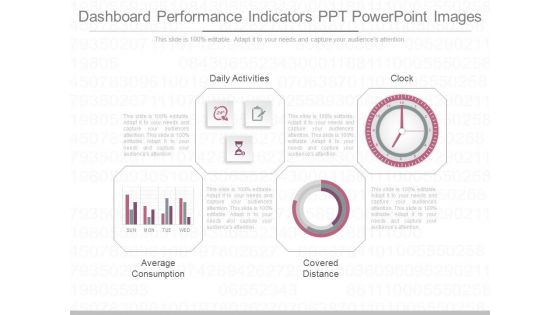
Dashboard Performance Indicators Ppt Powerpoint Images
This is a dashboard performance indicators ppt powerpoint images. This is a four stage process. The stages in this process are daily activities, average consumption, covered distance, clock.
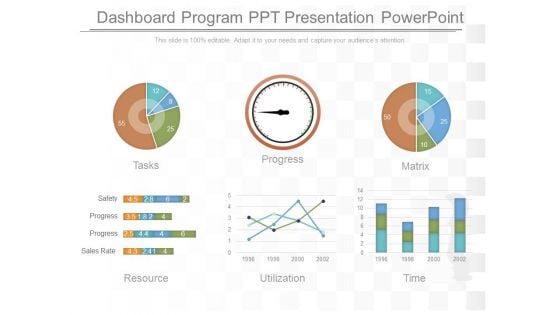
Dashboard Program Ppt Presentation Powerpoint
This is a dashboard program ppt presentation powerpoint. This is a six stage process. The stages in this process are tasks, progress, matrix, resource, utilization, time, safety, progress, sales rate.
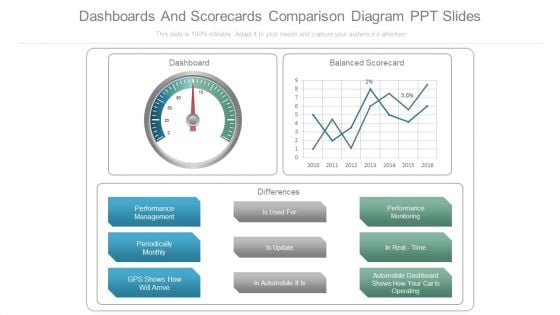
Dashboards And Scorecards Comparison Diagram Ppt Slides
This is a dashboards and scorecards comparison diagram ppt slides. This is a three stage process. The stages in this process are dashboard, balanced scorecard, differences, performance management, periodically monthly, gps shows how will arrive, is used for, is update, in automobile it is, performance monitoring, in real time, automobile dashboard shows how your car is operating.
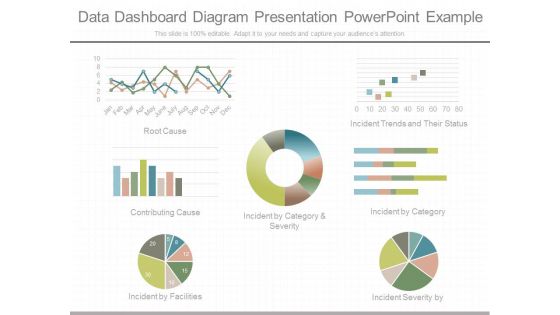
Data Dashboard Diagram Presentation Powerpoint Example
This is a data dashboard diagram presentation powerpoint example. This is a seven stage process. The stages in this process are root cause, incident trends and their status, contributing cause, incident by category and severity, incident by category, incident by facilities, incident severity by.
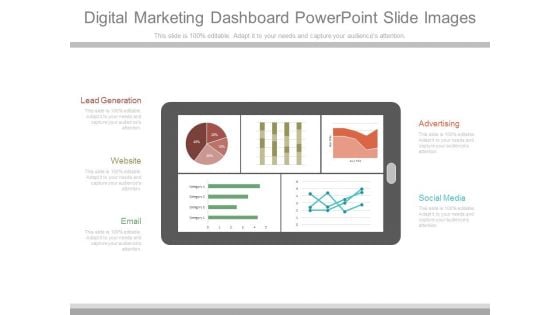
Digital Marketing Dashboard Powerpoint Slide Images
This is a digital marketing dashboard powerpoint slide images. This is a five stage process. The stages in this process are lead generation, website, email, advertising, social media.
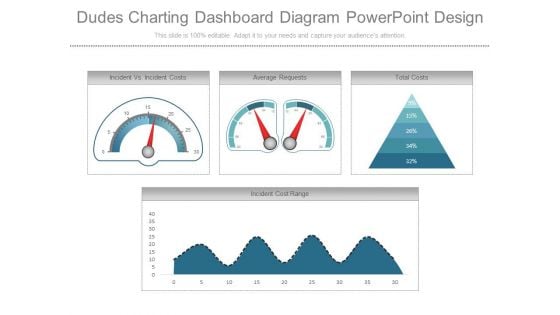
Dudes Charting Dashboard Diagram Powerpoint Design
This is a dudes charting dashboard diagram powerpoint design. This is a four stage process. The stages in this process are incident vs incident costs, average requests, total costs, incident cost range.
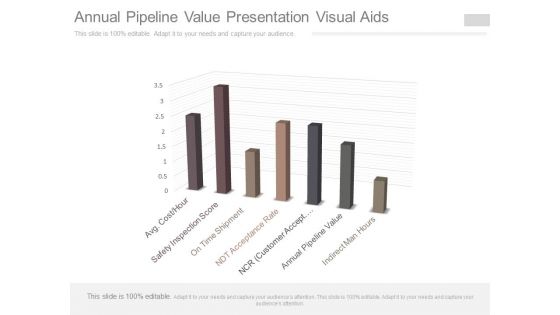
Annual Pipeline Value Presentation Visual Aids
This is a annual pipeline value presentation visual aids. This is a seven stage process. The stages in this process are safety inspection score, avg cost hour, on time shipment, ndt acceptance rate, ncr customer accept, annual pipeline value, indirect man hours.
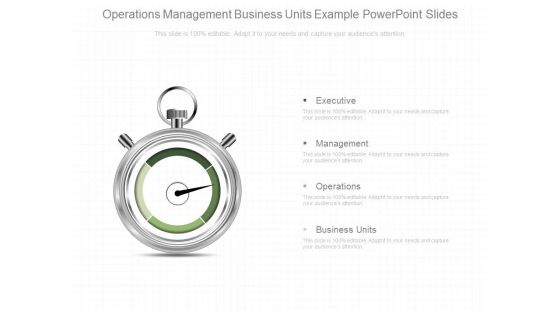
Operations Management Business Units Example Powerpoint Slides
This is a operations management business units example powerpoint slides. This is a four stage process. The stages in this process are executive, management, operations, business units.
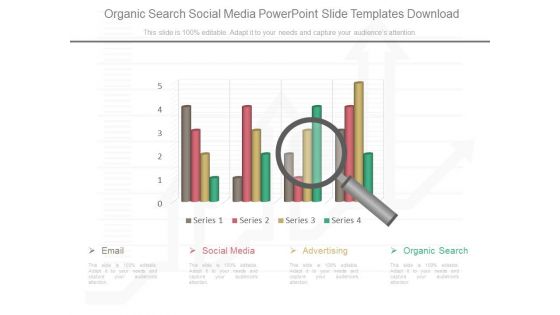
Organic Search Social Media Powerpoint Slide Templates Download
This is a organic search social media powerpoint slide templates download. This is a four stage process. The stages in this process are email, social media, advertising, organic search, series.
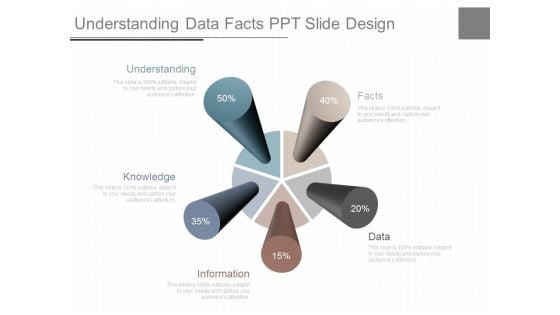
Understanding Data Facts Ppt Slide Design
This is a understanding data facts ppt slide design. This is a five stage process. The stages in this process are understanding, knowledge, information, data, facts.
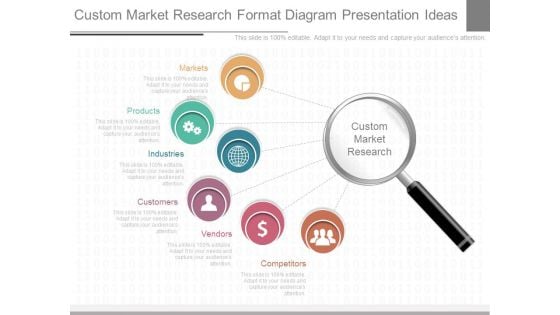
Custom Market Research Format Diagram Presentation Ideas
This is a custom market research format diagram presentation ideas. This is a six stage process. The stages in this process are markets, products, industries, customers, vendors, competitors, custom market research.
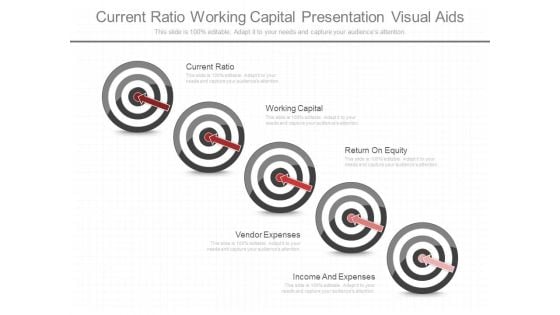
Current Ratio Working Capital Presentation Visual Aids
This is a current ratio working capital presentation visual aids. This is a five stage process. The stages in this process are current ratio, working capital, return on equity, vendor expenses, income and expenses.
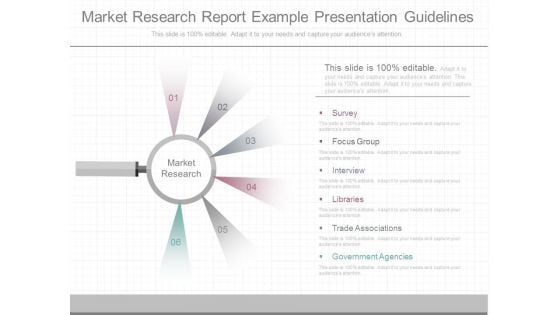
Market Research Report Example Presentation Guidelines
This is a market research report example presentation guidelines. This is a six stage process. The stages in this process are market research, survey, focus group, interview, libraries, trade associations, government agencies.
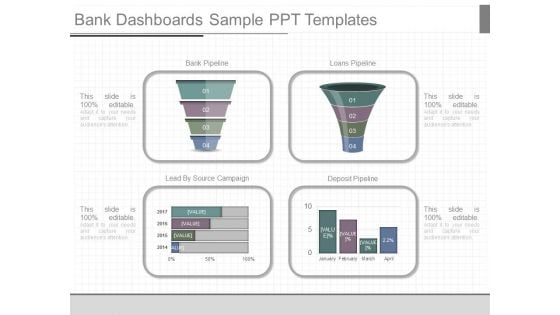
Bank Dashboards Sample Ppt Templates
This is a bank dashboards sample ppt templates. This is a four stage process. The stages in this process are bank pipeline, loans pipeline, lead by source campaign, deposit pipeline, january, february, march, april.
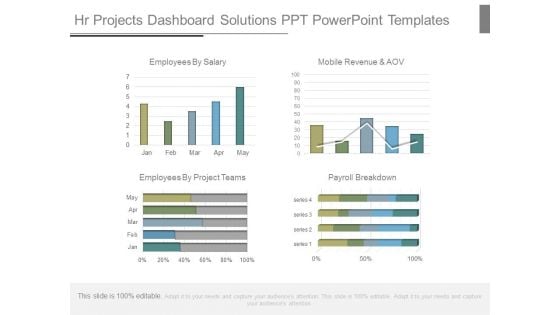
Hr Projects Dashboard Solutions Ppt Powerpoint Templates
This is a hr projects dashboard solutions ppt powerpoint templates. This is a four stage process. The stages in this process are employees by salary, mobile revenue and aov, employees by project teams, payroll breakdown, jan, feb, mar, apr, may, series.
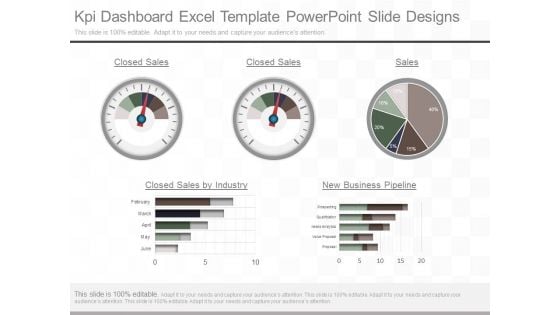
Kpi Dashboard Excel Template Powerpoint Slide Designs
This is a kpi dashboard excel template powerpoint slide designs. This is a five stage process. The stages in this process are closed sales, closed sales, sales, closed sales by industry, new business pipeline, february, march april, may, june, prospecting, qualification, needs analytics, value proposal, proposal.
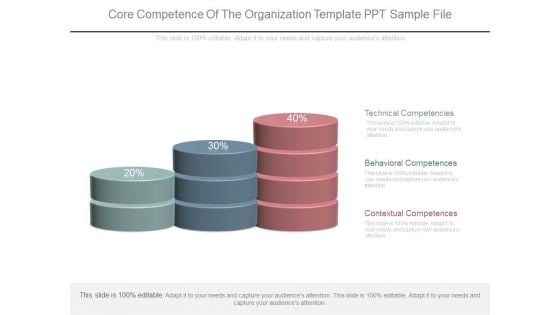
Core Competence Of The Organization Template Ppt Sample File
This is a core competence of the organization template ppt sample file. This is a three stage process. The stages in this process are technical competencies, behavioral competences, contextual competences.
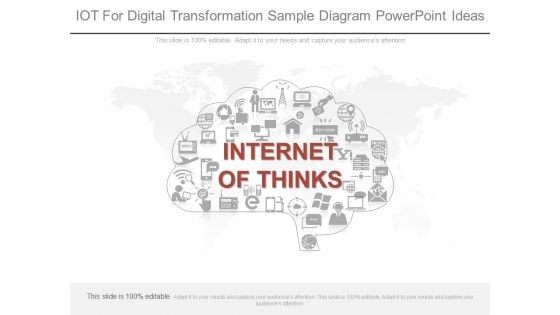
Iot For Digital Transformation Sample Diagram Powerpoint Ideas
This is a iot for digital transformation sample diagram powerpoint ideas. This is a one stage process. The stages in this process are internet of thinks.
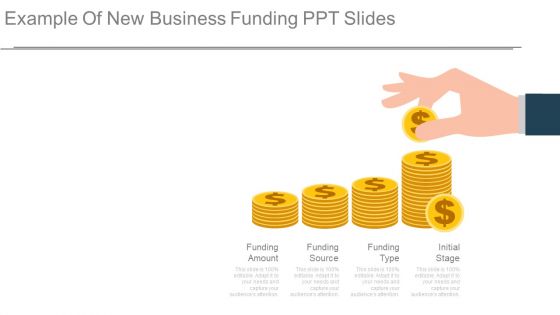
Example Of New Business Funding Ppt Slides
This is a example of new business funding ppt slides. This is a four stage process. The stages in this process are funding amount, funding source, funding type, initial stage.
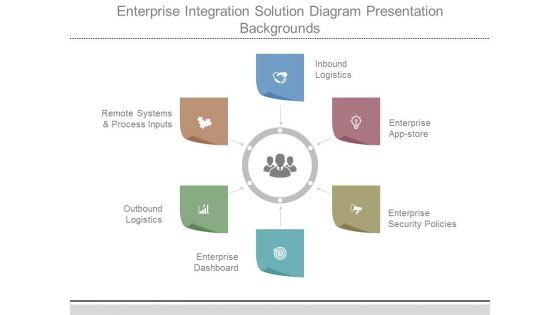
Enterprise Integration Solution Diagram Presentation Backgrounds
This is a enterprise integration solution diagram presentation backgrounds. This is a six stage process. The stages in this process are remote systems and process inputs, outbound, logistics, enterprise, dashboard, enterprise, policies, security, enterprise app store, inbound logistics.
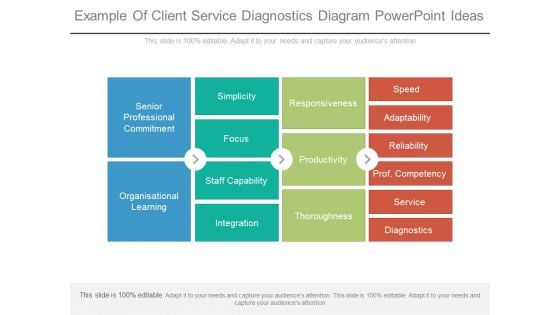
Example Of Client Service Diagnostics Diagram Powerpoint Ideas
This is a example of client service diagnostics diagram powerpoint ideas. This is a four stage process. The stages in this process are organisational learning, senior professional commitment, simplicity, focus, staff capability, integration, responsiveness, productivity, thoroughness, speed, adaptability, reliability, prof competency, service, diagnostics.
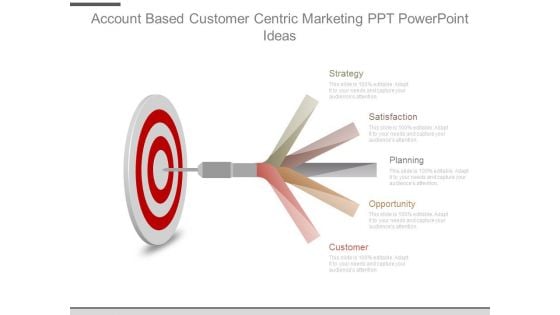
Account Based Customer Centric Marketing Ppt Powerpoint Ideas
This is a account based customer centric marketing ppt powerpoint ideas. This is a five stage process. The stages in this process are strategy, satisfaction, planning, opportunity, customer.
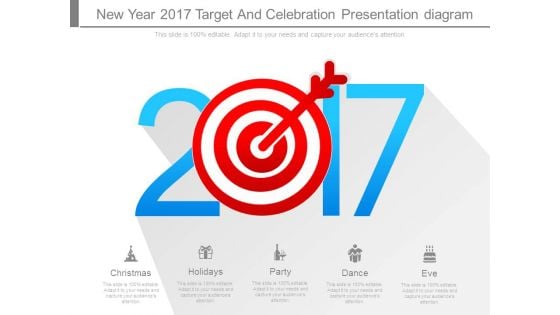
New Year 2017 Target And Celebration Presentation Diagram
This is a new year 2017 target and celebration presentation diagram. This is a one stage process. The stages in this process are christmas, holidays, party, dance, eve.

Financial New Year Card Design Diagram
This is a financial new year card design diagram. This is a four stage process. The stages in this process are money, saving, financial planning, banking.
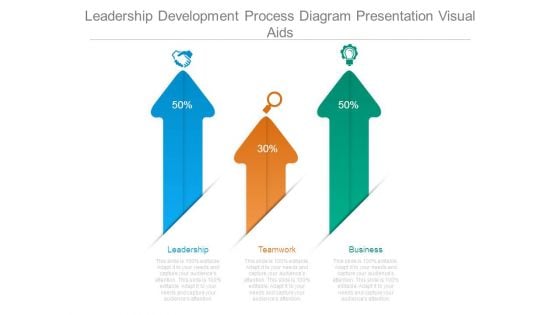
Leadership Development Process Diagram Presentation Visual Aids
This is a leadership development process diagram presentation visual aids. This is a three stage process. The stages in this process are leadership, teamwork, business.
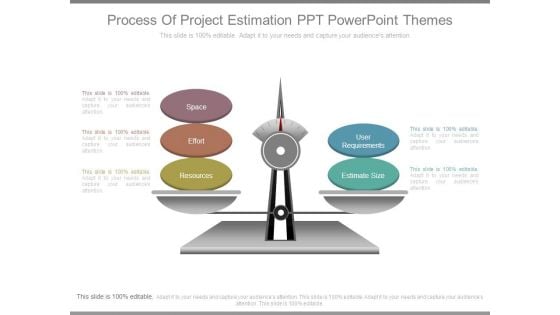
Process Of Project Estimation Ppt Powerpoint Themes
This is a process of project estimation ppt powerpoint themes. This is a five stage process. The stages in this process are space, effort, resources, user requirements, estimate size.
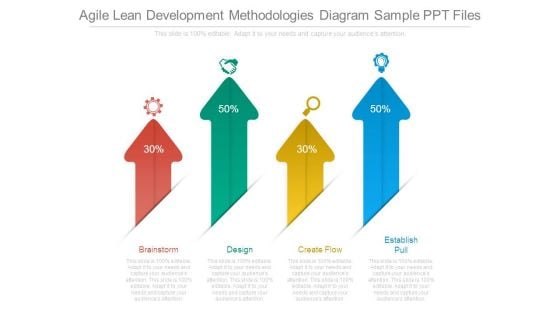
Agile Lean Development Methodologies Diagram Sample Ppt Files
This is a agile lean development methodologies diagram sample ppt files. This is a four stage process. The stages in this process are create flow, brainstorm, design, establish pull.
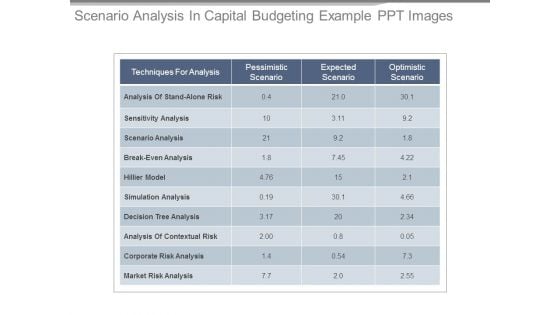
Scenario Analysis In Capital Budgeting Example Ppt Images
This is a scenario analysis in capital budgeting example ppt images. This is a one stage process. The stages in this process are techniques for analysis, pessimistic scenario, expected scenario, optimistic scenario, analysis of stand-alone risk, sensitivity analysis, scenario analysis, break even analysis, hillier model, simulation analysis, decision tree analysis, analysis of contextual risk, corporate risk analysis, market risk analysis.
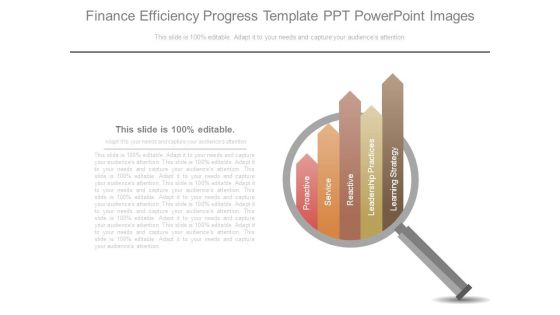
Finance Efficiency Progress Template Ppt Powerpoint Images
This is a finance efficiency progress template ppt powerpoint images. This is a five stage process. The stages in this process are proactive, service, reactive, leadership practices, learning strategy.
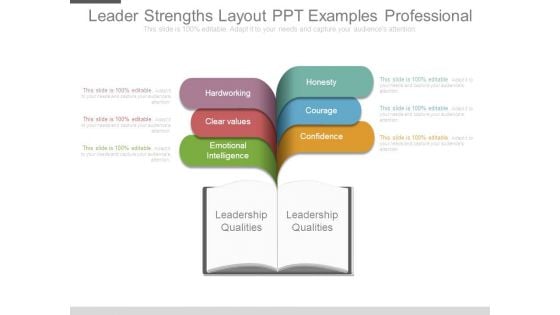
Leader Strengths Layout Ppt Examples Professional
This is a leader strengths layout ppt examples professional. This is a six stage process. The stages in this process are hardworking, clear values, emotional intelligence, honesty, courage, confidence, leadership qualities, leadership qualities.
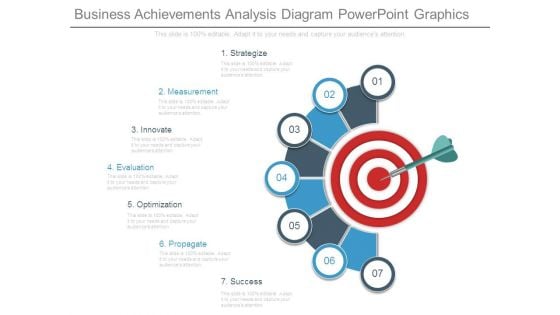
Business Achievements Analysis Diagram Powerpoint Graphics
This is a business achievements analysis diagram powerpoint graphics. This is a seven stage process. The stages in this process are strategize, measurement, innovate, evaluation, optimization, propagate, success.
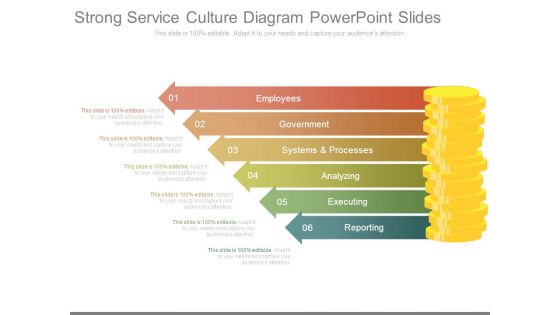
Strong Service Culture Diagram Powerpoint Slides
This is a strong service culture diagram powerpoint slides. This is a six stage process. The stages in this process are employees, government, systems and processes, analyzing, executing, reporting.
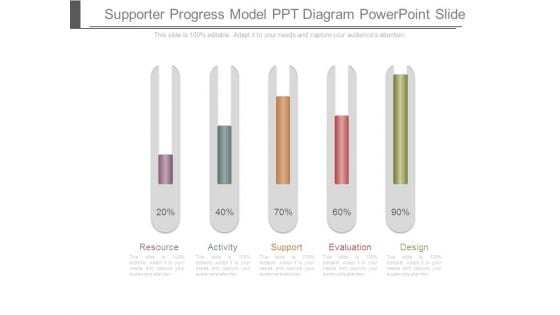
Supporter Progress Model Ppt Diagram Powerpoint Slide
This is a supporter progress model ppt diagram powerpoint slide. This is a five stage process. The stages in this process are resource, activity, support, evaluation, design.
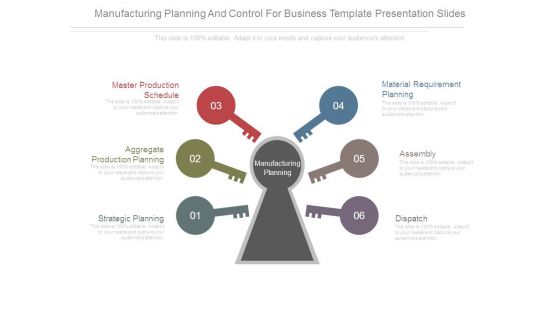
Manufacturing Planning And Control For Business Template Presentation Slides
This is a Manufacturing Planning And Control For Business Template Presentation Slides. This is a six stage process. The stages in this process are master production schedule, aggregate production planning, strategic planning, material requirement planning, assembly, dispatch.
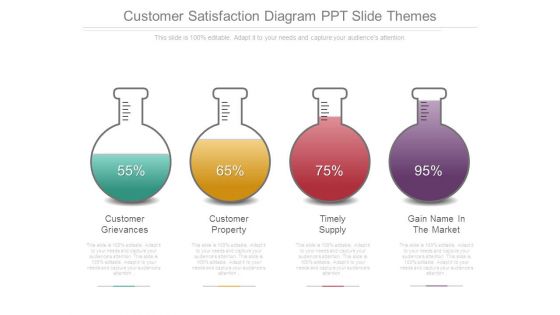
Customer Satisfaction Diagram Ppt Slide Themes
This is a customer satisfaction diagram ppt slide themes. This is a four stage process. The stages in this process are customer grievances, customer property, timely supply, gain name in the market.
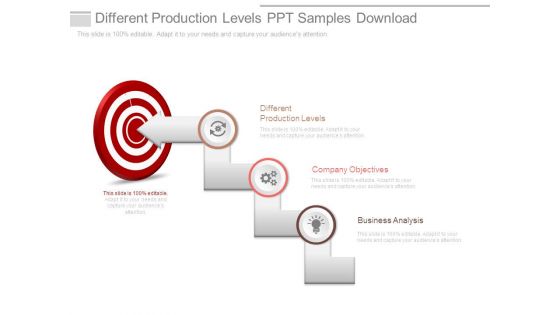
Different Production Levels Ppt Samples Download
This is a different production levels ppt samples download. This is a three stage process. The stages in this process are different production levels, company objectives, business analysis.
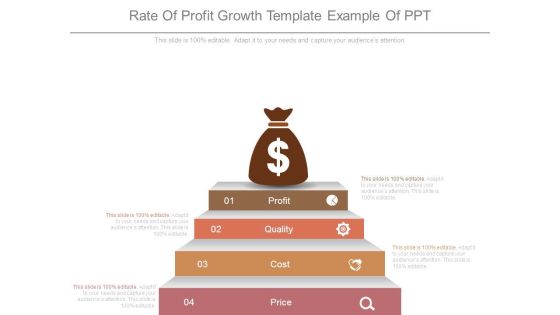
Rate Of Profit Growth Template Example Of Ppt
This is a rate of profit growth template example of ppt. This is a four stage process. The stages in this process are profit, quality, cost, price.


 Continue with Email

 Home
Home


