Use Of Funds
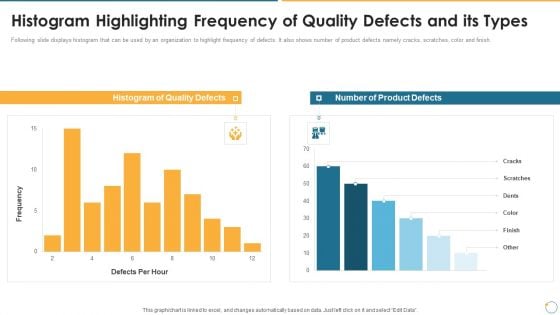
Collection Of Quality Assurance PPT Histogram Highlighting Frequency Of Quality Defects Slides PDF
Following slide displays histogram that can be used by an organization to highlight frequency of defects. It also shows number of product defects namely cracks, scratches, color and finish. Deliver an awe inspiring pitch with this creative collection of quality assurance ppt histogram highlighting frequency of quality defects slides pdf bundle. Topics like histogram highlighting frequency of quality defects and its types can be discussed with this completely editable template. It is available for immediate download depending on the needs and requirements of the user.
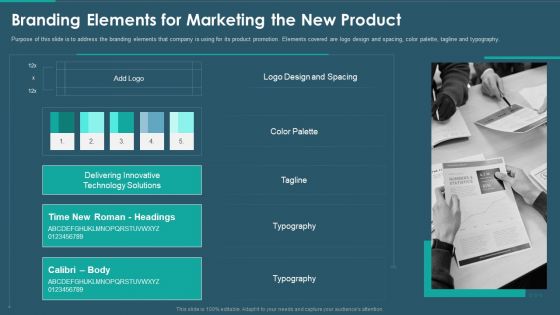
Sales And Promotion Playbook Branding Elements For Marketing The New Product Structure PDF
Purpose of this slide is to address the branding elements that company is using for its product promotion. Elements covered are logo design and spacing, color palette, tagline and typography. Deliver an awe inspiring pitch with this creative sales and promotion playbook branding elements for marketing the new product structure pdf bundle. Topics like branding elements for marketing the new product can be discussed with this completely editable template. It is available for immediate download depending on the needs and requirements of the user.
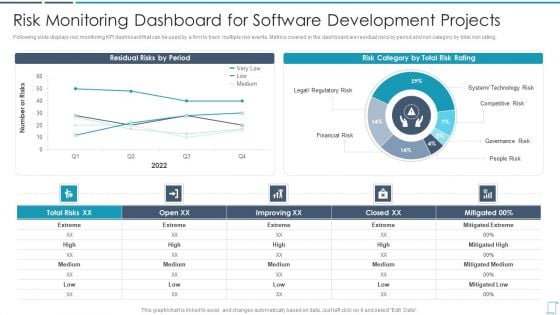
Professional Scrum Master Certification Training Program IT Risk Monitoring Dashboard Background PDF
Following slide displays risk monitoring KPI dashboard that can be used by a firm to track multiple risk events. Metrics covered in the dashboard are residual risks by period and risk category by total risk rating.Deliver an awe inspiring pitch with this creative professional scrum master certification training program it risk monitoring dashboard background pdf bundle. Topics like competitive risk, governance risk, people risk can be discussed with this completely editable template. It is available for immediate download depending on the needs and requirements of the user.
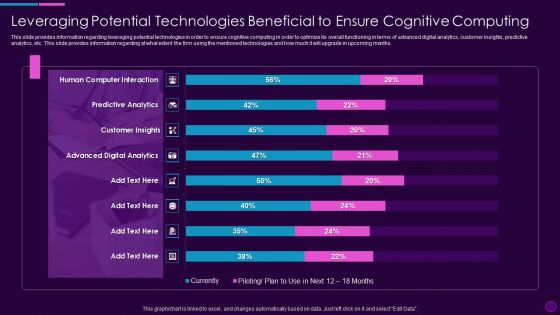
Cognitive Computing Action Plan Leveraging Potential Technologies Beneficial Ppt Inspiration PDF
This slide provides information regarding leveraging potential technologies in order to ensure cognitive computing in order to optimize its overall functioning in terms of advanced digital analytics, customer insights, predictive analytics, etc. This slide provides information regarding at what extent the firm using the mentioned technologies and how much it will upgrade in upcoming months. Deliver an awe inspiring pitch with this creative cognitive computing action plan leveraging potential technologies beneficial ppt inspiration pdf bundle. Topics like leveraging potential technologies beneficial to ensure cognitive computing can be discussed with this completely editable template. It is available for immediate download depending on the needs and requirements of the user.
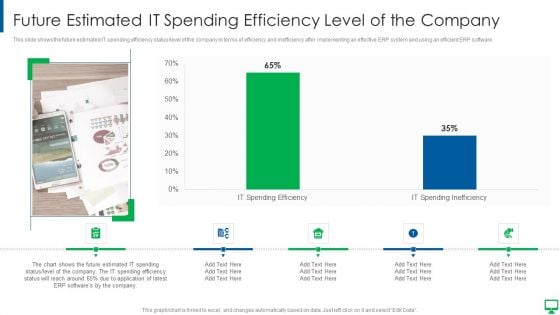
Execution Of ERP System To Enhance Business Effectiveness Future Estimated IT Microsoft PDF
This slide shows the future estimated IT spending efficiency status or level of the company in terms of efficiency and inefficiency after implementing an effective ERP system and using an efficient ERP software Deliver an awe inspiring pitch with this creative execution of erp system to enhance business effectiveness future estimated it microsoft pdf bundle. Topics like future estimated it spending efficiency level of the company can be discussed with this completely editable template. It is available for immediate download depending on the needs and requirements of the user.
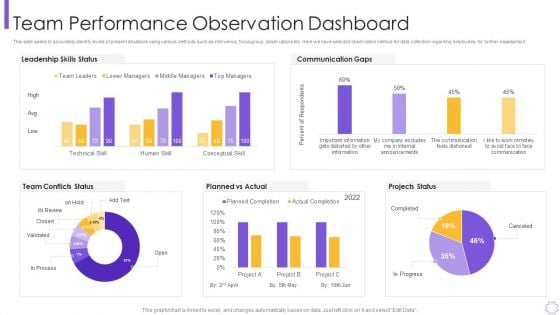
Organizational Program To Improve Team Productivity And Efficiency Team Performance Clipart PDF
This slide seeks to accurately identify levels of present situations using various methods such as interviews, focus group, observations etc. Here we have selected observation method for data collection regarding employees for further Assessment.Deliver an awe inspiring pitch with this creative organizational program to improve team productivity and efficiency team performance clipart pdf bundle. Topics like communication gaps, projects status, team conflicts status can be discussed with this completely editable template. It is available for immediate download depending on the needs and requirements of the user.
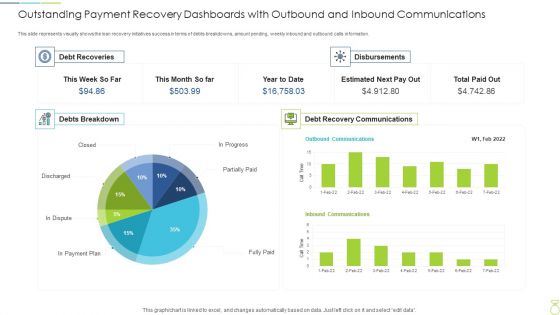
Outstanding Payment Recovery Dashboards With Outbound And Inbound Communications Graphics PDF
This slide represents visually shows the loan recovery initiatives success in terms of debts breakdowns, amount pending, weekly inbound and outbound calls information. Pitch your topic with ease and precision using this outstanding payment recovery dashboards with outbound and inbound communications graphics pdf. This layout presents information on outstanding payment recovery dashboards with outbound and inbound communications. It is also available for immediate download and adjustment. So, changes can be made in the color, design, graphics or any other component to create a unique layout.
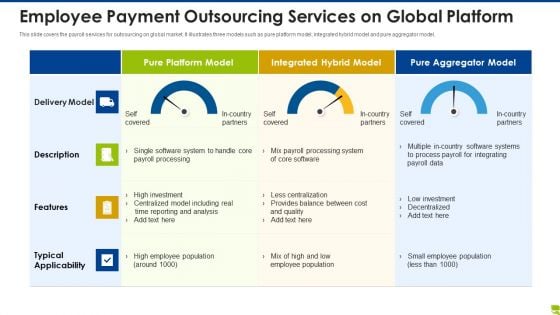
Employee Payment Outsourcing Services On Global Platform Inspiration PDF
This slide covers the payroll services for outsourcing on global market. It illustrates three models such as pure platform model, integrated hybrid model and pure aggregator model. Pitch your topic with ease and precision using this employee payment outsourcing services on global platform inspiration pdf. This layout presents information on employee payment outsourcing services on global platform. It is also available for immediate download and adjustment. So, changes can be made in the color, design, graphics or any other component to create a unique layout.
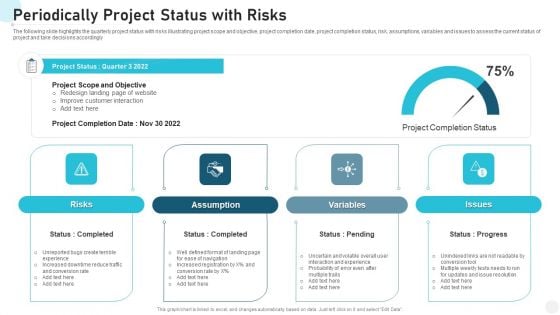
Periodically Project Status With Risks Designs PDF
The following slide highlights the quarterly project status with risks illustrating project scope and objective, project completion date, project completion status, risk, assumptions, variables and issues to assess the current status of project and take decisions accordingly Pitch your topic with ease and precision using this periodically project status with risks designs pdf. This layout presents information on risks, assumption, variables, issues. It is also available for immediate download and adjustment. So, changes can be made in the color, design, graphics or any other component to create a unique layout.
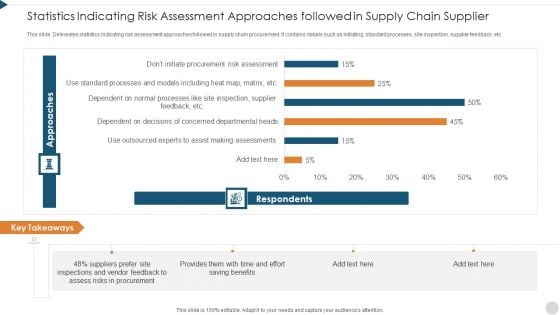
Statistics Indicating Risk Assessment Approaches Followed In Supply Chain Supplier Designs PDF
This slide. Delineates statistics indicating risk assessment approaches followed in supply chain procurement. It contains details such as initiating, standard processes, site inspection, supplier feedback, etc. Pitch your topic with ease and precision using this statistics indicating risk assessment approaches followed in supply chain supplier designs pdf. This layout presents information on key takeaways, approaches, respondents. It is also available for immediate download and adjustment. So, changes can be made in the color, design, graphics or any other component to create a unique layout.
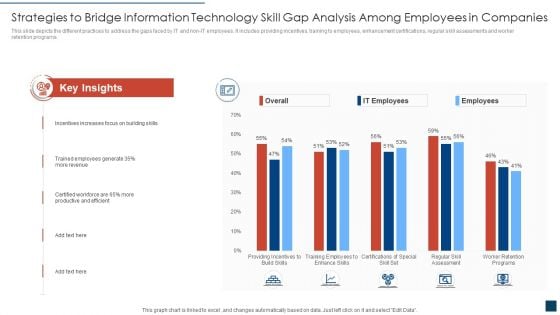
Strategies To Bridge Information Technology Skill Gap Analysis Among Employees In Companies Formats PDF
This slide depicts the different practices to address the gaps faced by IT and non-IT employees. It includes providing incentives, training to employees, enhancement certifications, regular skill assessments and worker retention programs. Pitch your topic with ease and precision using this strategies to bridge information technology skill gap analysis among employees in companies formats pdf. This layout presents information on strategies to bridge information technology skill gap analysis among employees in companies. It is also available for immediate download and adjustment. So, changes can be made in the color, design, graphics or any other component to create a unique layout.
Company Turnover Financial Ratios Chart Comparison Icons PDF
This slide illustrates graph for turnover ratios that are accounts receivable, inventory turnover, accounts payable turnover, fixed asset turnover and total assets turnover ratio. It showcases comparison of three companies. Pitch your topic with ease and precision using this company turnover financial ratios chart comparison icons pdf. This layout presents information on company turnover financial ratios chart comparison. It is also available for immediate download and adjustment. So, changes can be made in the color, design, graphics or any other component to create a unique layout.
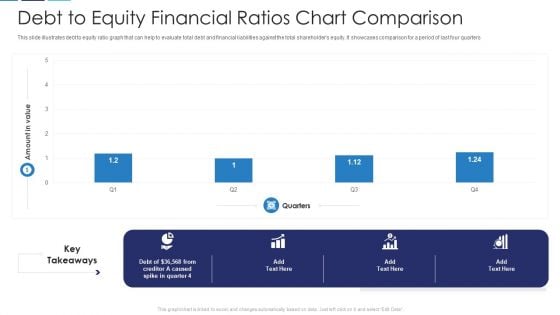
Debt To Equity Financial Ratios Chart Comparison Download PDF
This slide illustrates debt to equity ratio graph that can help to evaluate total debt and financial liabilities against the total shareholders equity. It showcases comparison for a period of last four quarters Pitch your topic with ease and precision using this debt to equity financial ratios chart comparison download pdf. This layout presents information on debt to equity financial ratios chart comparison. It is also available for immediate download and adjustment. So, changes can be made in the color, design, graphics or any other component to create a unique layout.
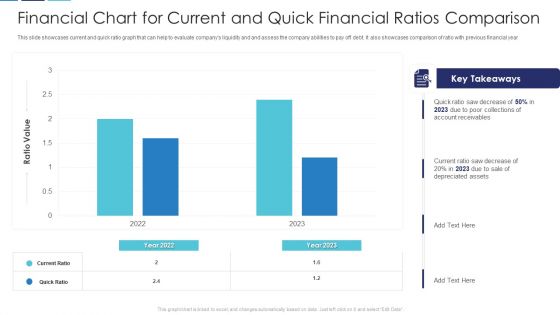
Financial Chart For Current And Quick Financial Ratios Comparison Brochure PDF
This slide showcases current and quick ratio graph that can help to evaluate companys liquidity and and assess the company abilities to pay off debt. It also showcases comparison of ratio with previous financial year Pitch your topic with ease and precision using this financial chart for current and quick financial ratios comparison brochure pdf. This layout presents information on financial chart for current and quick financial ratios comparison. It is also available for immediate download and adjustment. So, changes can be made in the color, design, graphics or any other component to create a unique layout.
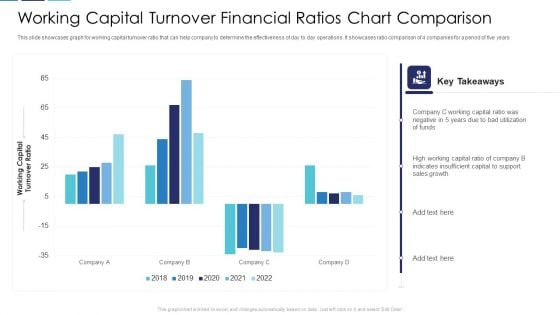
Working Capital Turnover Financial Ratios Chart Comparison Clipart PDF
This slide showcases graph for working capital turnover ratio that can help company to determine the effectiveness of day to day operations. It showcases ratio comparison of 4 companies for a period of five years Pitch your topic with ease and precision using this working capital turnover financial ratios chart comparison clipart pdf. This layout presents information on working capital turnover financial ratios chart comparison. It is also available for immediate download and adjustment. So, changes can be made in the color, design, graphics or any other component to create a unique layout.
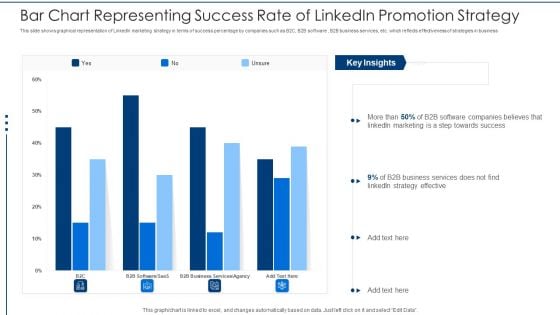
Bar Chart Representing Success Rate Of Linkedin Promotion Strategy Rules PDF
This slide shows graphical representation of LinkedIn marketing strategy in terms of success percentage by companies such as B2C, B2B software , B2B business services, etc. which reflects effectiveness of strategies in business Pitch your topic with ease and precision using this bar chart representing success rate of linkedin promotion strategy rules pdf. This layout presents information on bar chart representing success rate of linkedin promotion strategy. It is also available for immediate download and adjustment. So, changes can be made in the color, design, graphics or any other component to create a unique layout.
Supplier Compensation Due Tracking Dashboard With Paid Invoices Topics PDF
This slide showcases dashboard that can help organization to track the outstanding payment of different vendors and take timely action in case of delay. Its key elements are due by age summary, top 5 vendor by purchases, top 5 vendors by amount due and total invoice vs paid invoices. Pitch your topic with ease and precision using this supplier compensation due tracking dashboard with paid invoices topics pdf. This layout presents information on supplier compensation due tracking dashboard with paid invoices. It is also available for immediate download and adjustment. So, changes can be made in the color, design, graphics or any other component to create a unique layout.
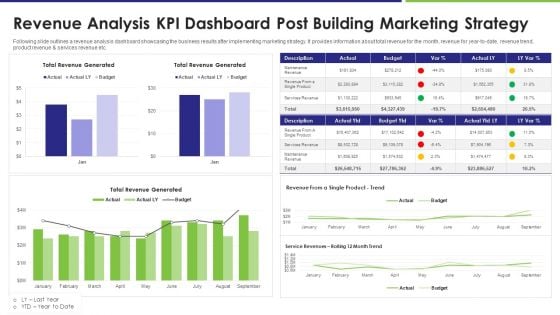
Revenue Analysis KPI Dashboard Post Building Marketing Strategy Infographics PDF
Following slide outlines a revenue analysis dashboard showcasing the business results after implementing marketing strategy. It provides information about total revenue for the month, revenue for year to date, revenue trend, product revenue and services revenue etc. Pitch your topic with ease and precision using this revenue analysis kpi dashboard post building marketing strategy infographics pdf. This layout presents information on revenue analysis kpi dashboard post building marketing strategy. It is also available for immediate download and adjustment. So, changes can be made in the color, design, graphics or any other component to create a unique layout.
Application Sources For Recruitment On Social Media Tracking Dashboard Microsoft PDF
This slide covers the dashboard for tracking the count of applicants profiles from various sources. It includes the open positions, new roles, total roles, candidates placed , application sources, client decline rates and commission received. Pitch your topic with ease and precision using this application sources for recruitment on social media tracking dashboard microsoft pdf. This layout presents information on application sources for recruitment on social media tracking dashboard. It is also available for immediate download and adjustment. So, changes can be made in the color, design, graphics or any other component to create a unique layout.
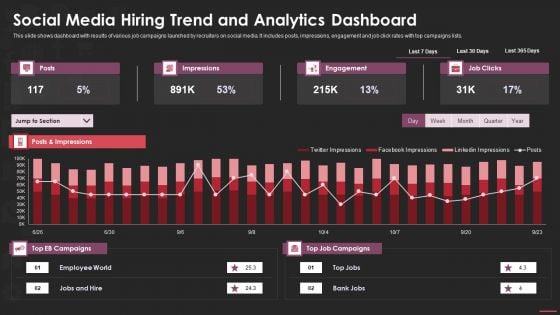
Social Media Hiring Trend And Analytics Dashboard Microsoft PDF
This slide shows dashboard with results of various job campaigns launched by recruiters on social media. It includes posts, impressions, engagement and job click rates with top campaigns lists. Pitch your topic with ease and precision using this social media hiring trend and analytics dashboard microsoft pdf. This layout presents information on social media hiring trend and analytics dashboard. It is also available for immediate download and adjustment. So, changes can be made in the color, design, graphics or any other component to create a unique layout.
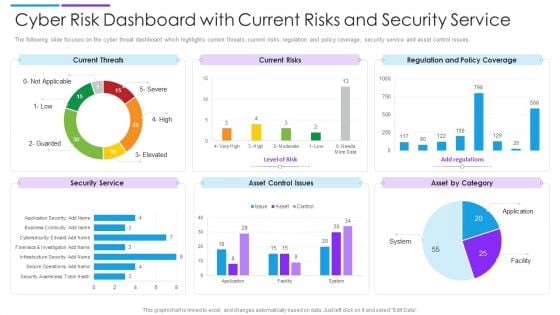
Cyber Risk Dashboard With Current Risks And Security Service Formats PDF
The following slide focuses on the cyber threat dashboard which highlights current threats, current risks, regulation and policy coverage, security service and asset control issues. Pitch your topic with ease and precision using this cyber risk dashboard with current risks and security service formats pdf. This layout presents information on current threats, current risks, regulation and policy coverage. It is also available for immediate download and adjustment. So, changes can be made in the color, design, graphics or any other component to create a unique layout.
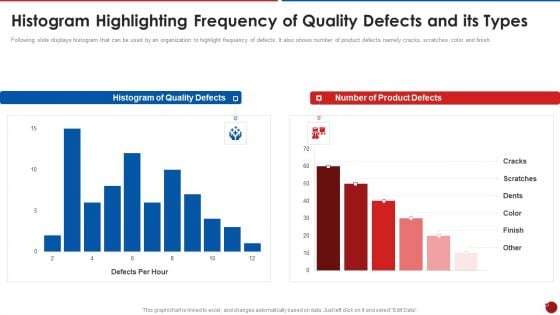
Quality Assurance Templates Set 2 Histogram Highlighting Frequency Of Quality Defects And Its Types Professional PDF
Following slide displays histogram that can be used by an organization to highlight frequency of defects. It also shows number of product defects namely cracks, scratches, color and finish. Deliver an awe inspiring pitch with this creative quality assurance templates set 2 histogram highlighting frequency of quality defects and its types professional pdf bundle. Topics like histogram of quality defects, number of product defects can be discussed with this completely editable template. It is available for immediate download depending on the needs and requirements of the user.
Artificial Intelligence Transformation Playbook Kpi Dashboard For Tracking Business Performance Designs PDF
Mentioned slide portrays KPI dashboard that can be used by organizations to measure their business performance post AI introduction. KPIS covered here are progress, Before versus After AI Implementation, risks and issues. Deliver an awe inspiring pitch with this creative artificial intelligence transformation playbook kpi dashboard for tracking business performance designs pdf bundle. Topics like risk and issues, progress, performance kpis, before versus after all implementation can be discussed with this completely editable template. It is available for immediate download depending on the needs and requirements of the user.
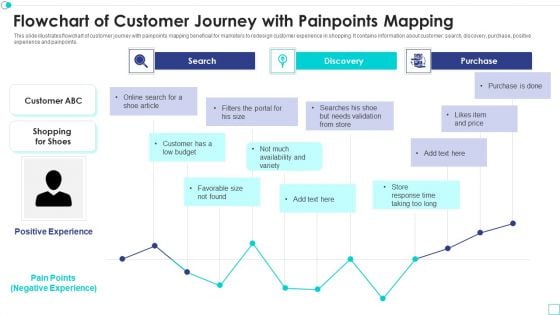
Flowchart Of Customer Journey With Painpoints Mapping Download PDF
This slide illustrates flowchart of customer journey with painpoints mapping beneficial for marketers to redesign customer experience in shopping. It contains information about customer, search, discovery, purchase, positive experience and painpoints. Pitch your topic with ease and precision using this flowchart of customer journey with painpoints mapping download pdf. This layout presents information on flowchart of customer journey with painpoints mapping. It is also available for immediate download and adjustment. So, changes can be made in the color, design, graphics or any other component to create a unique layout.
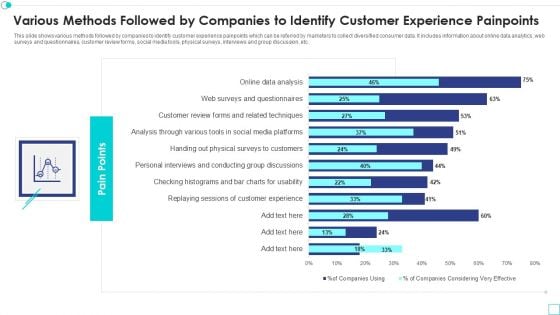
Various Methods Followed By Companies To Identify Customer Experience Painpoints Designs PDF
This slide shows various methods followed by companies to identify customer experience painpoints which can be referred by marketers to collect diversified consumer data. It includes information about online data analytics, web surveys and questionnaires, customer review forms, social media tools, physical surveys, interviews and group discussion, etc. Pitch your topic with ease and precision using this various methods followed by companies to identify customer experience painpoints designs pdf. This layout presents information on various methods followed by companies to identify customer experience painpoints. It is also available for immediate download and adjustment. So, changes can be made in the color, design, graphics or any other component to create a unique layout.
Agile Methodology To Quality Control Effectiveness Tracking Dashboard Ppt Icon Graphics Download PDF
This slide illustrates the KPI dashboard used for tracking the effectiveness of agile quality assurance model. KPIs covered in the dashboard are release and quality compliance, test functions and defects Deliver an awe inspiring pitch with this creative agile methodology to quality control effectiveness tracking dashboard ppt icon graphics download pdf bundle. Topics like agile methodology to quality control effectiveness tracking dashboard can be discussed with this completely editable template. It is available for immediate download depending on the needs and requirements of the user.
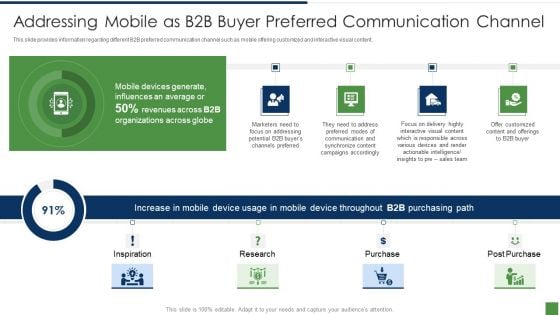
B2B Lead Generation Plan Addressing Mobile As B2b Buyer Preferred Communication Channel Introduction PDF
This slide provides information regarding different B2B preferred communication channel such as mobile offering customized and interactive visual content. Presenting b2b lead generation plan addressing mobile as b2b buyer preferred communication channel introduction pdf to provide visual cues and insights. Share and navigate important information on four stages that need your due attention. This template can be used to pitch topics like inspiration, research, purchase, post purchase. In addtion, this PPT design contains high resolution images, graphics, etc, that are easily editable and available for immediate download.
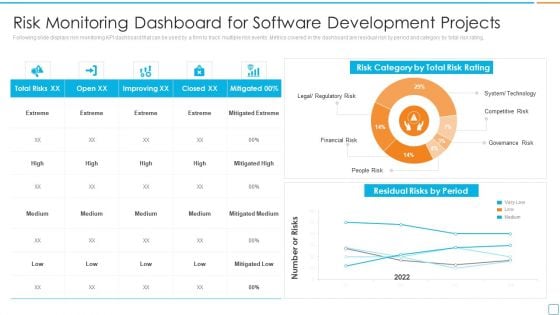
Professional Scrum Master Certification Risk Monitoring Dashboard For Software Development Portrait PDF
Following slide displays risk monitoring KPI dashboard that can be used by a firm to track multiple risk events. Metrics covered in the dashboard are residual risk by period and category by total risk rating. Deliver an awe inspiring pitch with this creative professional scrum master certification risk monitoring dashboard for software development portrait pdf bundle. Topics like residual risks by period, risk category, total risk rating can be discussed with this completely editable template. It is available for immediate download depending on the needs and requirements of the user.
Dashboard For Tracking Leadership Growth And Development Program Ideas PDF
This slide exhibits a dashboard for tracking the development of leadership programs for team growth. It covers executive training programs, supervisor competency heatmap, leadership training, etc. Pitch your topic with ease and precision using this dashboard for tracking leadership growth and development program ideas pdf This layout presents information on executive training program, leadership training, completion v or s success It is also available for immediate download and adjustment. So, changes can be made in the color, design, graphics or any other component to create a unique layout.
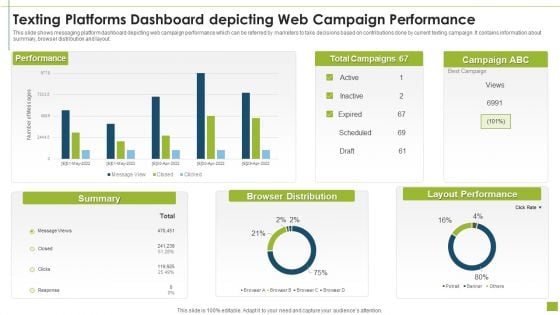
Texting Platforms Dashboard Depicting Web Campaign Performance Pictures PDF
This slide shows messaging platform dashboard depicting web campaign performance which can be referred by marketers to take decisions based on contributions done by current texting campaign. It contains information about summary, browser distribution and layout.Pitch your topic with ease and precision using this texting platforms dashboard depicting web campaign performance pictures pdf This layout presents information on browser distribution, layout performance, summary It is also available for immediate download and adjustment. So, changes can be made in the color, design, graphics or any other component to create a unique layout.
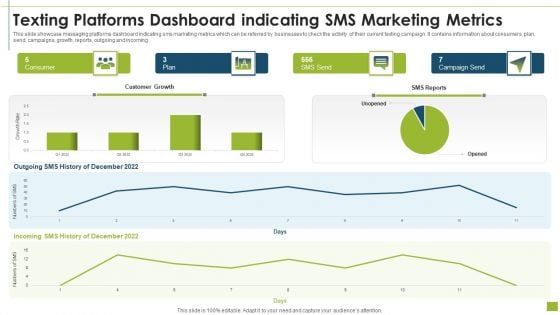
Texting Platforms Dashboard Indicating SMS Marketing Metrics Designs PDF
This slide showcase messaging platforms dashboard indicating sms marketing metrics which can be referred by businesses to check the activity of their current texting campaign. It contains information about consumers, plan, send, campaigns, growth, reports, outgoing and incoming.Pitch your topic with ease and precision using this texting platforms dashboard indicating sms marketing metrics designs pdf This layout presents information on texting platforms dashboard indicating sms marketing metrics It is also available for immediate download and adjustment. So, changes can be made in the color, design, graphics or any other component to create a unique layout.
Dashboard For Tracking Leadership Growth And Development Program Topics PDF
This slide exhibits a dashboard for tracking the development of leadership programs for team growth. It covers executive training programs, supervisor competency heatmap, leadership training, etc. Pitch your topic with ease and precision using this dashboard for tracking leadership growth and development program topics pdf This layout presents information on executive training program, leadership training, completion v or s success It is also available for immediate download and adjustment. So, changes can be made in the color, design, graphics or any other component to create a unique layout.
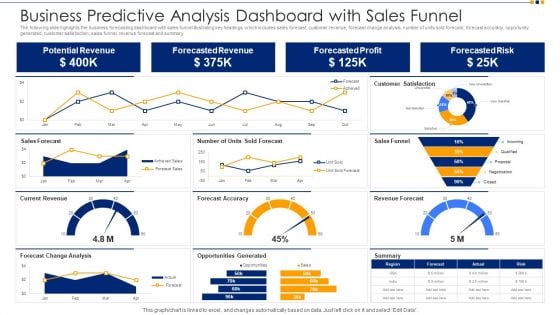
Business Predictive Analysis Dashboard With Sales Funnel Ppt Show Images PDF
The following slide highlights the business forecasting dashboard with sales funnel illustrating key headings which includes sales forecast, customer revenue, forecast change analysis, number of units sold forecast, forecast accuracy, opportunity generated, customer satisfaction, sales funnel, revenue forecast and summary. Pitch your topic with ease and precision using this business predictive analysis dashboard with sales funnel ppt show images pdf. This layout presents information on potential revenue, forecasted revenue, forecasted profit, forecasted risk. It is also available for immediate download and adjustment. So, changes can be made in the color, design, graphics or any other component to create a unique layout.
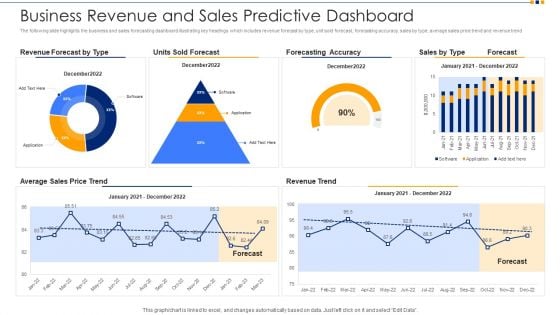
Business Revenue And Sales Predictive Dashboard Ppt Inspiration Background Designs PDF
The following slide highlights the business and sales forecasting dashboard illustrating key headings which includes revenue forecast by type, unit sold forecast, forecasting accuracy, sales by type, average sales price trend and revenue trend. Pitch your topic with ease and precision using this business revenue and sales predictive dashboard ppt inspiration background designs pdf. This layout presents information on revenue forecast by type, units sold forecast, forecasting accuracy, average sales price trend, revenue trend. It is also available for immediate download and adjustment. So, changes can be made in the color, design, graphics or any other component to create a unique layout.
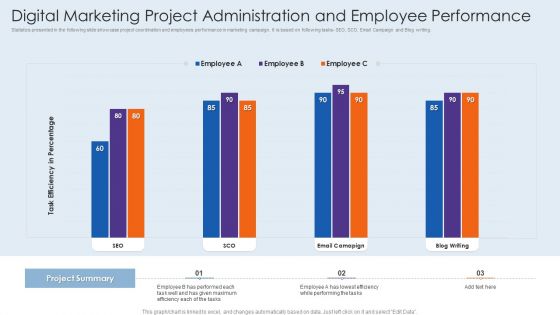
Digital Marketing Project Administration And Employee Performance Guidelines PDF
Statistics presented in the following slide showcase project coordination and employees performance in marketing campaign. It is based on following tasks SEO, SCO, Email Campaign and Blog writing. Pitch your topic with ease and precision using this digital marketing project administration and employee performance guidelines pdf. This layout presents information on digital marketing project administration and employee performance. It is also available for immediate download and adjustment. So, changes can be made in the color, design, graphics or any other component to create a unique layout.
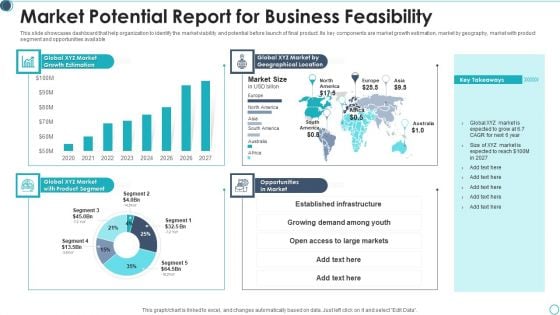
Market Potential Report For Business Feasibility Pictures PDF
This slide showcases dashboard that help organization to identify the market viability and potential before launch of final product. Its key components are market growth estimation, market by geography, market with product segment and opportunities available Pitch your topic with ease and precision using this market potential report for business feasibility pictures pdf This layout presents information on geographical location, opportunities in market, growth estimation It is also available for immediate download and adjustment. So, changes can be made in the color, design, graphics or any other component to create a unique layout.
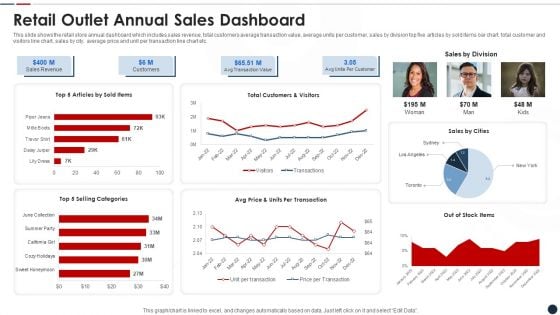
Retail Outlet Annual Sales Dashboard Elements PDF
This slide shows the retail store annual dashboard which includes sales revenue, total customers average transaction value, average units per customer, sales by division top five articles by sold items bar chart, total customer and visitors line chart, sales by city, average price and unit per transaction line chart etc.Pitch your topic with ease and precision using this retail outlet annual sales dashboard elements pdf This layout presents information on Retail outlet annual sales dashboard It is also available for immediate download and adjustment. So, changes can be made in the color, design, graphics or any other component to create a unique layout.
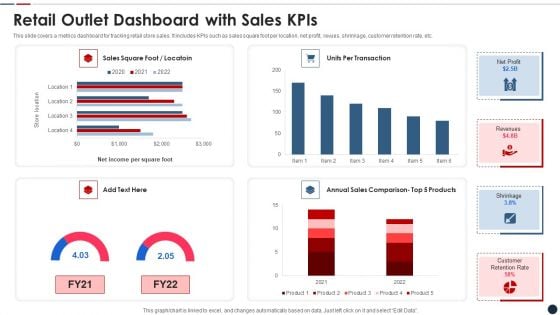
Retail Outlet Dashboard With Sales Kpis Clipart PDF
This slide covers a metrics dashboard for tracking retail store sales. It includes KPIs such as sales square foot per location, net profit, revues, shrinkage, customer retention rate, etc. Pitch your topic with ease and precision using this retail outlet dashboard with sales kpis clipart pdf This layout presents information on Retail outlet dashboard with sales kpis It is also available for immediate download and adjustment. So, changes can be made in the color, design, graphics or any other component to create a unique layout.
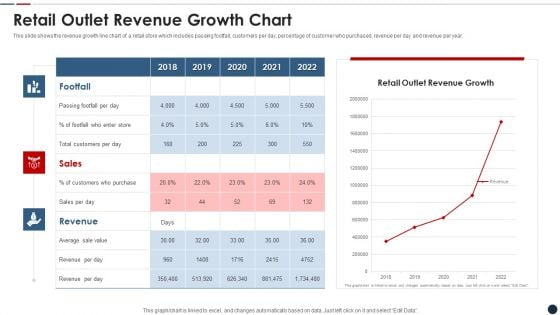
Retail Outlet Revenue Growth Chart Mockup PDF
This slide shows the revenue growth line chart of a retail store which includes passing footfall, customers per day, percentage of customer who purchased, revenue per day and revenue per year. Pitch your topic with ease and precision using this retail outlet revenue growth chart mockup pdf This layout presents information on Retail outlet revenue growth chart It is also available for immediate download and adjustment. So, changes can be made in the color, design, graphics or any other component to create a unique layout.
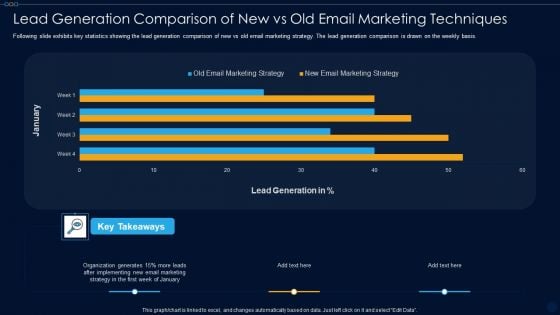
Lead Generation Comparison Of New Vs Old Email Marketing Techniques Ppt PowerPoint Presentation File Slides PDF
Following slide exhibits key statistics showing the lead generation comparison of new vs old email marketing strategy. The lead generation comparison is drawn on the weekly basis. Pitch your topic with ease and precision using this lead generation comparison of new vs old email marketing techniques ppt powerpoint presentation file slides pdf. This layout presents information on lead generation, organization generates, new email marketing strategy, old email marketing strategy. It is also available for immediate download and adjustment. So, changes can be made in the color, design, graphics or any other component to create a unique layout.
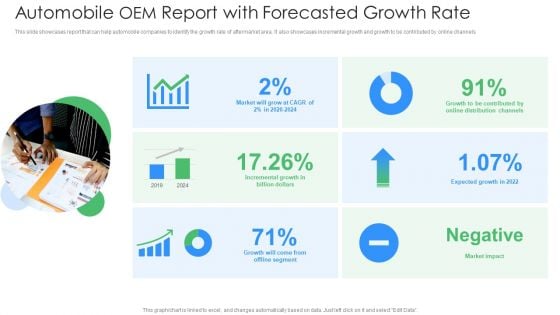
Automobile OEM Report With Forecasted Growth Rate Ppt PowerPoint Presentation File Background Images PDF
This slide showcases report that can help automobile companies to identify the growth rate of aftermarket area. It also showcases incremental growth and growth to be contributed by online channels. Pitch your topic with ease and precision using this automobile oem report with forecasted growth rate ppt powerpoint presentation file background images pdf. This layout presents information on incremental growth, billion dollars, growth, offline segment, market impact, expected growth in 2022. It is also available for immediate download and adjustment. So, changes can be made in the color, design, graphics or any other component to create a unique layout.
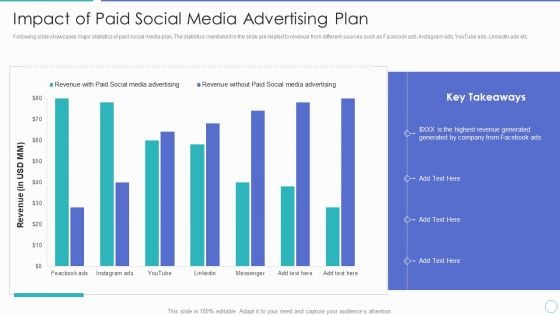
Impact Of Paid Social Media Advertising Plan Ppt PowerPoint Presentation Gallery Template PDF
Following slide showcases major statistics of paid social media plan. The statistics mentioned in the slide are related to revenue from different sources such as Facebook ads, Instagram ads, YouTube ads, LinkedIn ads etc. Pitch your topic with ease and precision using this impact of paid social media advertising plan ppt powerpoint presentation gallery template pdf. This layout presents information on highest revenue generated, revenue with paid social media advertising, revenue without paid social media advertising. It is also available for immediate download and adjustment. So, changes can be made in the color, design, graphics or any other component to create a unique layout.
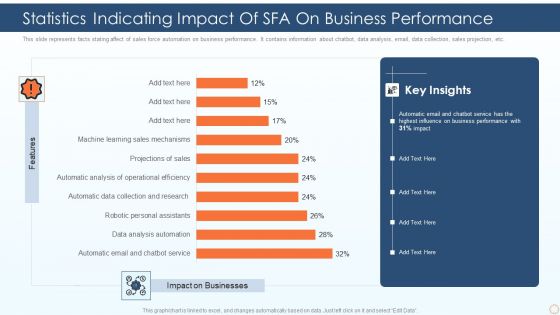
Statistics Indicating Impact Of SFA On Business Performance Ppt PowerPoint Presentation Gallery Outfit PDF
This slide represents facts stating affect of sales force automation on business performance. It contains information about chatbot, data analysis, email, data collection, sales projection, etc. Pitch your topic with ease and precision using this statistics indicating impact of sfa on business performance ppt powerpoint presentation gallery outfit pdf. This layout presents information on automatic email and chatbot service, data analysis automation, robotic personal assistants. It is also available for immediate download and adjustment. So, changes can be made in the color, design, graphics or any other component to create a unique layout.
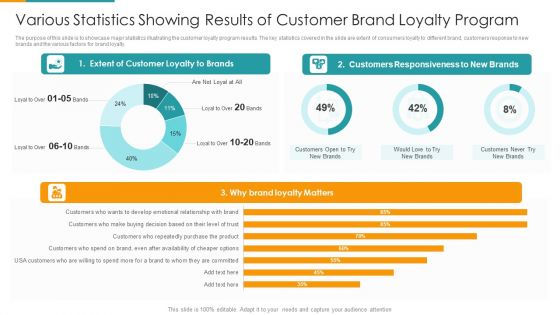
Various Statistics Showing Results Of Customer Brand Loyalty Program Background PDF
The purpose of this slide is to showcase major statistics illustrating the customer loyalty program results. The key statistics covered in the slide are extent of consumers loyalty to different brand, customers response to new brands and the various factors for brand loyalty. Pitch your topic with ease and precision using this various statistics showing results of customer brand loyalty program background pdf. This layout presents information on extent of customer loyalty to brands, customers responsiveness to new brands, brand loyalty matters. It is also available for immediate download and adjustment. So, changes can be made in the color, design, graphics or any other component to create a unique layout.
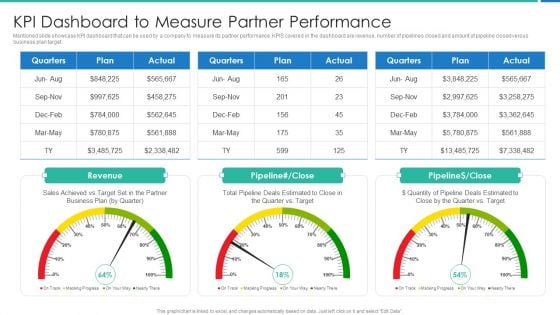
Strong Business Partnership To Ensure Company Success KPI Dashboard To Measure Partner Performance Sample PDF
Mentioned slide showcase KPI dashboard that can be used by a company to measure its partner performance. KPIS covered in the dashboard are revenue, number of pipelines closed and amount of pipeline closed versus business plan target.Deliver an awe inspiring pitch with this creative strong business partnership to ensure company success kpi dashboard to measure partner performance sample pdf bundle. Topics like kpi dashboard to measure partner performance can be discussed with this completely editable template. It is available for immediate download depending on the needs and requirements of the user.
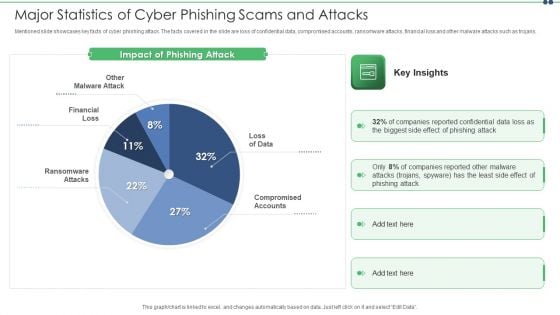
Major Statistics Of Cyber Phishing Scams And Attacks Designs PDF
Mentioned slide showcases key facts of cyber phishing attack. The facts covered in the slide are loss of confidential data, compromised accounts, ransomware attacks, financial loss and other malware attacks such as trojans. Pitch your topic with ease and precision using this major statistics of cyber phishing scams and attacks designs pdf. This layout presents information on major statistics of cyber phishing scams and attacks. It is also available for immediate download and adjustment. So, changes can be made in the color, design, graphics or any other component to create a unique layout.
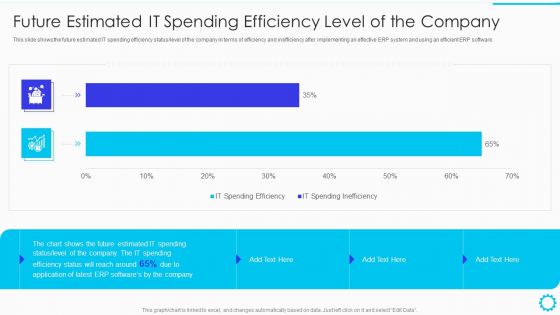
Summary Of Cloud ERP System Framework Future Estimated IT Spending Efficiency Level Of The Company Template PDF
This slide shows the future estimated IT spending efficiency status level of the company in terms of efficiency and inefficiency after implementing an effective ERP system and using an efficient ERP software.Deliver an awe inspiring pitch with this creative Summary Of Cloud ERP System Framework Future Estimated IT Spending Efficiency Level Of The Company Template PDF bundle. Topics like Future Estimated IT Spending Efficiency Level Of The Company can be discussed with this completely editable template. It is available for immediate download depending on the needs and requirements of the user.
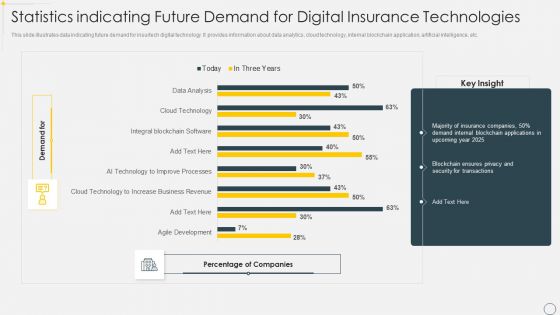
Statistics Indicating Future Demand For Digital Insurance Technologies Brochure PDF
This slide illustrates data indicating future demand for insurtech digital technology. It provides information about data analytics, cloud technology, internal blockchain application, artificial intelligence, etc. Pitch your topic with ease and precision using this Statistics Indicating Future Demand For Digital Insurance Technologies Brochure PDF. This layout presents information on Data Analytics, Cloud Technology, Internal Blockchain Application. It is also available for immediate download and adjustment. So, changes can be made in the color, design, graphics or any other component to create a unique layout.
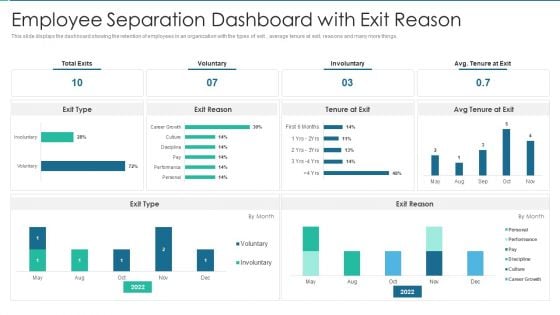
Employee Separation Dashboard With Exit Reason Rules PDF
This slide displays the dashboard showing the retention of employees in an organization with the types of exit , average tenure at exit, reasons and many more things. Pitch your topic with ease and precision using this Employee Separation Dashboard With Exit Reason Rules PDF This layout presents information on Employee Separation Dashboard With Exit Reason It is also available for immediate download and adjustment. So, changes can be made in the color, design, graphics or any other component to create a unique layout.
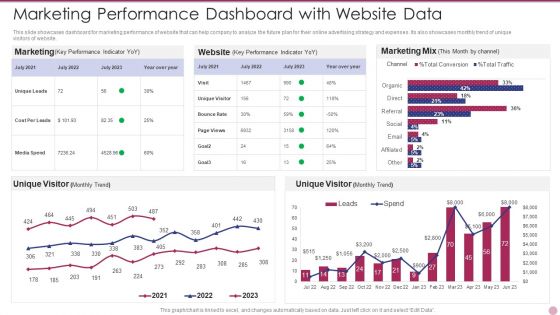
Marketing Performance Dashboard With Website Data Elements PDF
This slide showcases dashboard for marketing performance of website that can help company to analyze the future plan for their online advertising strategy and expenses. Its also showcases monthly trend of unique visitors of website. Pitch your topic with ease and precision using this Marketing Performance Dashboard With Website Data Elements PDF. This layout presents information on Marketing Performance Dashboard With Website Data. It is also available for immediate download and adjustment. So, changes can be made in the color, design, graphics or any other component to create a unique layout.
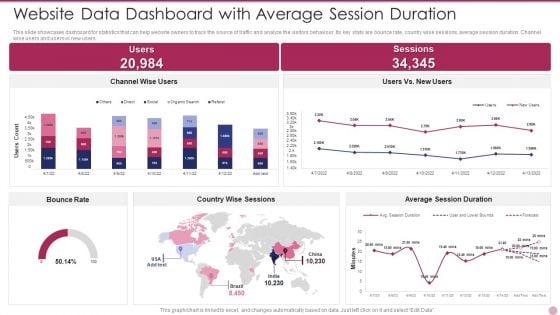
Website Data Dashboard With Average Session Duration Ideas PDF
This slide showcases dashboard for statistics that can help website owners to track the source of traffic and analyze the visitors behaviour. Its key stats are bounce rate, country wise sessions, average session duration. Channel wise users and users vs new users. Pitch your topic with ease and precision using this Website Data Dashboard With Average Session Duration Ideas PDF. This layout presents information on Website Data Dashboard With Average Session Duration. It is also available for immediate download and adjustment. So, changes can be made in the color, design, graphics or any other component to create a unique layout.
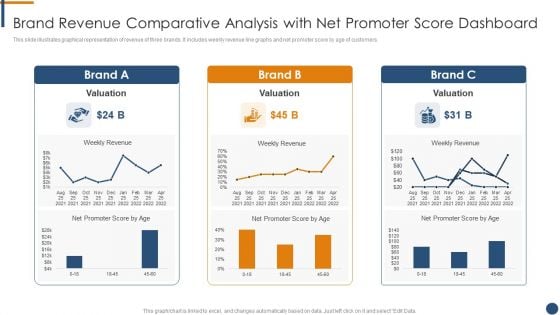
Brand Revenue Comparative Analysis With Net Promoter Score Dashboard Mockup PDF
This slide illustrates graphical representation of revenue of three brands. It includes weekly revenue line graphs and net promoter score by age of customers.Pitch your topic with ease and precision using this Brand Revenue Comparative Analysis With Net Promoter Score Dashboard Mockup PDF. This layout presents information on Brand Revenue Comparative Analysis With Net Promoter Score Dashboard. It is also available for immediate download and adjustment. So, changes can be made in the color, design, graphics or any other component to create a unique layout.
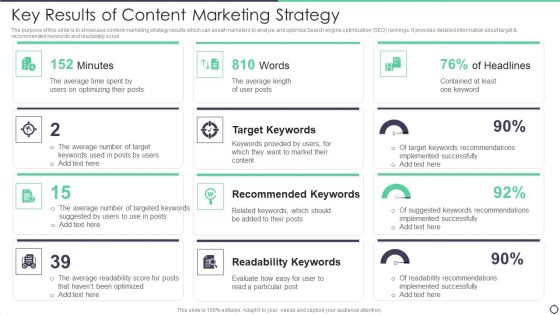
Key Results Of Content Marketing Strategy Background PDF
The purpose of this slide is to showcase content marketing strategy results which can assist marketers to analyze and optimize Search engine optimization SEO rankings. It provides detailed information about target and recommended keywords and readability score. Pitch your topic with ease and precision using this Key Results Of Content Marketing Strategy Background PDF. This layout presents information on Average, Target Keywords, Readability Keywords. It is also available for immediate download and adjustment. So, changes can be made in the color, design, graphics or any other component to create a unique layout.
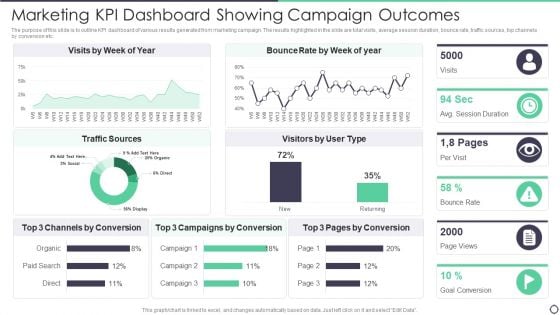
Marketing Kpi Dashboard Showing Campaign Outcomes Pictures PDF
The purpose of this slide is to outline KPI dashboard of various results generated from marketing campaign. The results highlighted in the slide are total visits, average session duration, bounce rate, traffic sources, top channels by conversion etc. Pitch your topic with ease and precision using this Marketing Kpi Dashboard Showing Campaign Outcomes Pictures PDF. This layout presents information on Marketing Kpi Dashboard Showing Campaign Outcomes. It is also available for immediate download and adjustment. So, changes can be made in the color, design, graphics or any other component to create a unique layout.
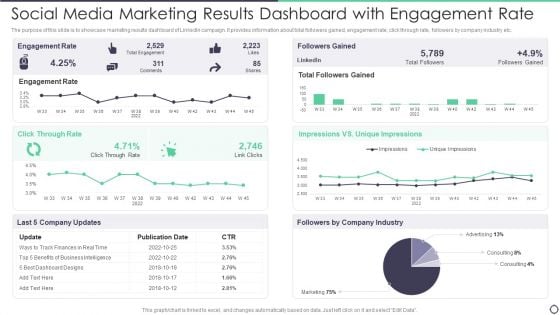
Social Media Marketing Results Dashboard With Engagement Rate Brochure PDF
The purpose of this slide is to showcase marketing results dashboard of LinkedIn campaign. It provides information about total followers gained, engagement rate, click through rate, followers by company industry etc. Pitch your topic with ease and precision using this Social Media Marketing Results Dashboard With Engagement Rate Brochure PDF. This layout presents information on Social Media Marketing Results Dashboard With Engagement Rate. It is also available for immediate download and adjustment. So, changes can be made in the color, design, graphics or any other component to create a unique layout.
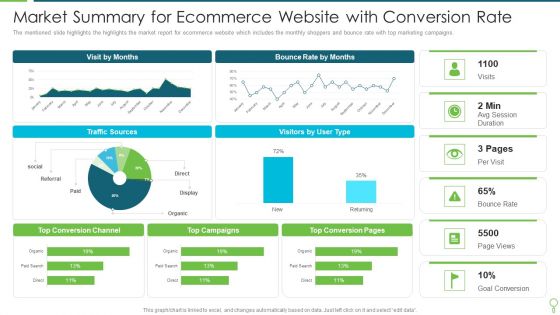
Market Summary For Ecommerce Website With Conversion Rate Diagrams PDF
The mentioned slide highlights the highlights the market report for ecommerce website which includes the monthly shoppers and bounce rate with top marketing campaigns. Pitch your topic with ease and precision using this Market Summary For Ecommerce Website With Conversion Rate Diagrams PDF. This layout presents information on Market Summary For Ecommerce Website With Conversion Rate. It is also available for immediate download and adjustment. So, changes can be made in the color, design, graphics or any other component to create a unique layout.
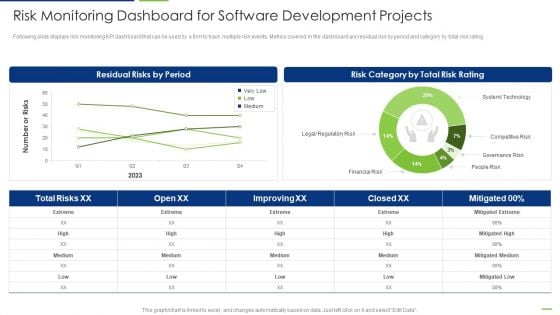
Professional Scrum Master Risk Monitoring Dashboard For Software Development Projects Designs PDF
Following slide displays risk monitoring KPI dashboard that can be used by a firm to track multiple risk events. Metrics covered in the dashboard are residual risk by period and category by total risk rating. Deliver an awe inspiring pitch with this creative Professional Scrum Master Risk Monitoring Dashboard For Software Development Projects Designs PDF bundle. Topics like Residual Risks By Period, Risk Category By Total Risk Rating, Total Risks can be discussed with this completely editable template. It is available for immediate download depending on the needs and requirements of the user.
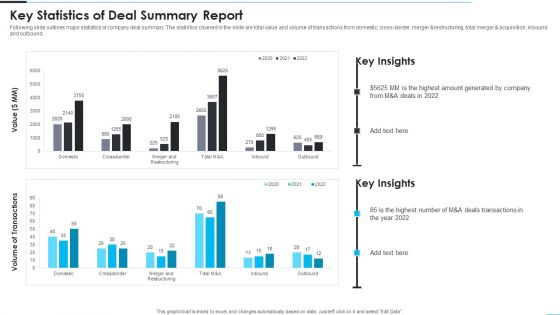
Key Statistics Of Deal Summary Report Formats PDF
Following slide outlines major statistics of company deal summary. The statistics covered in the slide are total value and volume of transactions from domestic, cross-border, merger and restructuring, total merger and acquisition, inbound and outbound. Pitch your topic with ease and precision using this Key Statistics Of Deal Summary Report Formats PDF. This layout presents information on Key Statistics Of Deal Summary Report. It is also available for immediate download and adjustment. So, changes can be made in the color, design, graphics or any other component to create a unique layout.
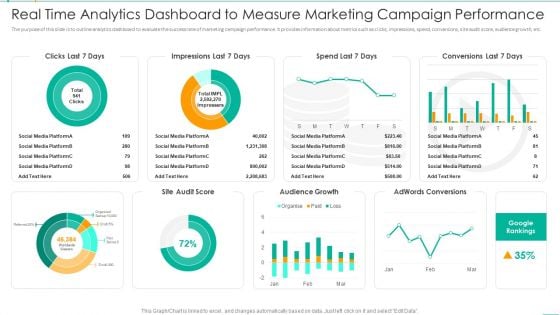
Real Time Analytics Dashboard To Measure Marketing Campaign Performance Information PDF
The purpose of this slide is to outline analytics dashboard to evaluate the success rate of marketing campaign performance. It provides information about metrics such as clicks, impressions, spend, conversions, site audit score, audience growth, etc. Pitch your topic with ease and precision using this Real Time Analytics Dashboard To Measure Marketing Campaign Performance Information PDF. This layout presents information on Real Time Analytics Dashboard To Measure Marketing Campaign Performance. It is also available for immediate download and adjustment. So, changes can be made in the color, design, graphics or any other component to create a unique layout.
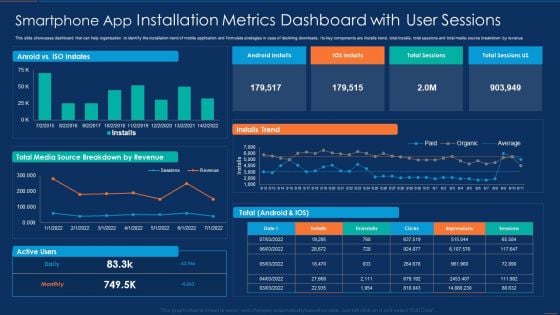
Smartphone App Installation Metrics Dashboard With User Sessions Microsoft PDF
This slide showcases dashboard that can help organization to identify the installation trend of mobile application and formulate strategies in case of declining downloads. Its key components are installs trend, total installs, total sessions and total media source breakdown by revenue. Pitch your topic with ease and precision using this Smartphone App Installation Metrics Dashboard With User Sessions Microsoft PDF. This layout presents information on Smartphone App Installation Metrics Dashboard With User Sessions. It is also available for immediate download and adjustment. So, changes can be made in the color, design, graphics or any other component to create a unique layout.


 Continue with Email

 Home
Home


