Visual Analytics
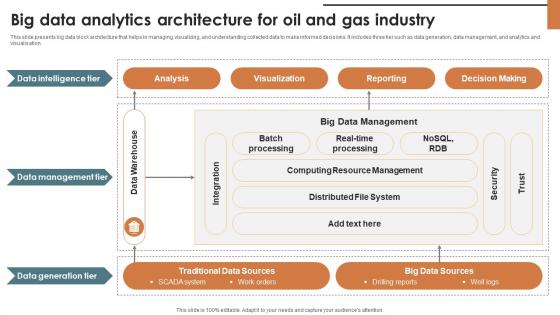
IoT Solutions For Oil Big Data Analytics Architecture For Oil And Gas Industry IoT SS V
This slide presents big data block architecture that helps in managing, visualizing, and understanding collected data to make informed decisions. It includes three tier such as data generation, data management, and analytics and visualisation. From laying roadmaps to briefing everything in detail, our templates are perfect for you. You can set the stage with your presentation slides. All you have to do is download these easy-to-edit and customizable templates. IoT Solutions For Oil Big Data Analytics Architecture For Oil And Gas Industry IoT SS V will help you deliver an outstanding performance that everyone would remember and praise you for. Do download this presentation today. This slide presents big data block architecture that helps in managing, visualizing, and understanding collected data to make informed decisions. It includes three tier such as data generation, data management, and analytics and visualisation.
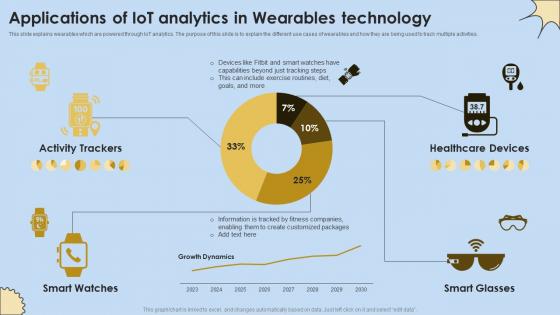
Applications Of IoT Analytics In Wearables Technology Internet Of Things Analysis Graphics Pdf
This slide explains wearables which are powered through IoT analytics. The purpose of this slide is to explain the different use cases of wearables and how they are being used to track multiple activities. Slidegeeks is here to make your presentations a breeze with Applications Of IoT Analytics In Wearables Technology Internet Of Things Analysis Graphics Pdf With our easy-to-use and customizable templates, you can focus on delivering your ideas rather than worrying about formatting. With a variety of designs to choose from, you are sure to find one that suits your needs. And with animations and unique photos, illustrations, and fonts, you can make your presentation pop. So whether you are giving a sales pitch or presenting to the board, make sure to check out Slidegeeks first. This slide explains wearables which are powered through IoT analytics. The purpose of this slide is to explain the different use cases of wearables and how they are being used to track multiple activities.
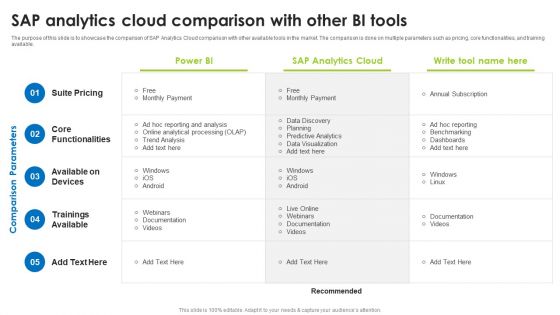
BI Technique For Data Informed Decisions Sap Analytics Cloud Comparison With Other BI Tools Structure PDF
The purpose of this slide is to showcase the comparison of SAP Analytics Cloud comparison with other available tools in the market. The comparison is done on multiple parameters such as pricing, core functionalities, and training available. Formulating a presentation can take up a lot of effort and time, so the content and message should always be the primary focus. The visuals of the PowerPoint can enhance the presenters message, so our BI Technique For Data Informed Decisions Sap Analytics Cloud Comparison With Other BI Tools Structure PDF was created to help save time. Instead of worrying about the design, the presenter can concentrate on the message while our designers work on creating the ideal templates for whatever situation is needed. Slidegeeks has experts for everything from amazing designs to valuable content, we have put everything into BI Technique For Data Informed Decisions Sap Analytics Cloud Comparison With Other BI Tools Structure PDF.
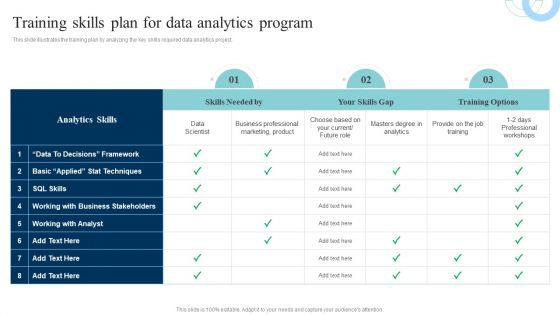
Data Evaluation And Processing Toolkit Training Skills Plan For Data Analytics Program Download PDF
This slide illustrates the training plan by analyzing the key skills required data analytics project. Formulating a presentation can take up a lot of effort and time, so the content and message should always be the primary focus. The visuals of the PowerPoint can enhance the presenters message, so our Data Evaluation And Processing Toolkit Training Skills Plan For Data Analytics Program Download PDF was created to help save time. Instead of worrying about the design, the presenter can concentrate on the message while our designers work on creating the ideal templates for whatever situation is needed. Slidegeeks has experts for everything from amazing designs to valuable content, we have put everything into Data Evaluation And Processing Toolkit Training Skills Plan For Data Analytics Program Download PDF.
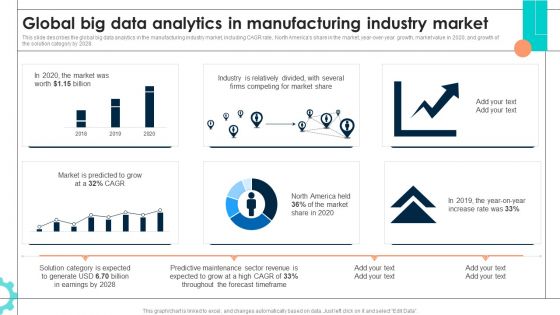
Intelligent Manufacturing Global Big Data Analytics In Manufacturing Industry Market Structure PDF
This slide describes the global big data analytics in the manufacturing industry market, including CAGR rate, North Americas share in the market, year-over-year growth, market value in 2020, and growth of the solution category by 2028. Formulating a presentation can take up a lot of effort and time, so the content and message should always be the primary focus. The visuals of the PowerPoint can enhance the presenters message, so our Intelligent Manufacturing Global Big Data Analytics In Manufacturing Industry Market Structure PDF was created to help save time. Instead of worrying about the design, the presenter can concentrate on the message while our designers work on creating the ideal templates for whatever situation is needed. Slidegeeks has experts for everything from amazing designs to valuable content, we have put everything into Intelligent Manufacturing Global Big Data Analytics In Manufacturing Industry Market Structure PDF
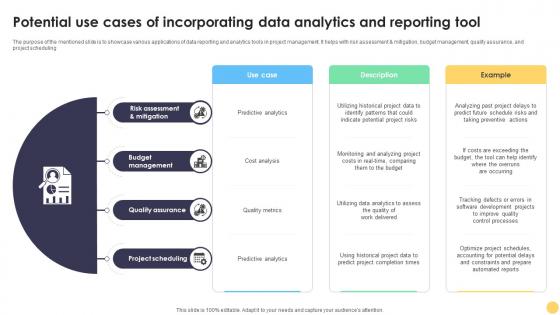
Digital Project Management Strategies Potential Use Cases Of Incorporating Data Analytics And Reporting
The purpose of the mentioned slide is to showcase various applications of data reporting and analytics tools in project management. It helps with risk assessment and mitigation, budget management, quality assurance, and project scheduling. The Digital Project Management Strategies Potential Use Cases Of Incorporating Data Analytics And Reporting is a compilation of the most recent design trends as a series of slides. It is suitable for any subject or industry presentation, containing attractive visuals and photo spots for businesses to clearly express their messages. This template contains a variety of slides for the user to input data, such as structures to contrast two elements, bullet points, and slides for written information. Slidegeeks is prepared to create an impression. The purpose of the mentioned slide is to showcase various applications of data reporting and analytics tools in project management. It helps with risk assessment and mitigation, budget management, quality assurance, and project scheduling.
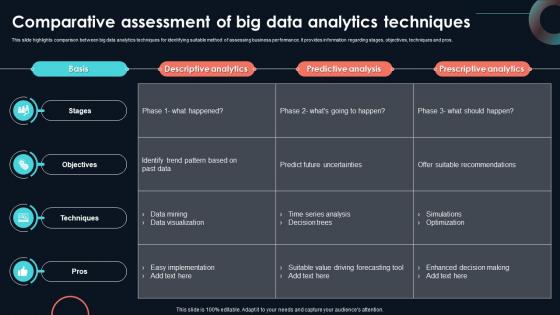
Comparative Assessment Of Big Data Developing Strategic Insights Using Big Data Analytics SS V
This slide highlights comparison between big data analytics techniques for identifying suitable method of assessing business performance. It provides information regarding stages, objectives, techniques and pros. Coming up with a presentation necessitates that the majority of the effort goes into the content and the message you intend to convey. The visuals of a PowerPoint presentation can only be effective if it supplements and supports the story that is being told. Keeping this in mind our experts created Comparative Assessment Of Big Data Developing Strategic Insights Using Big Data Analytics SS V to reduce the time that goes into designing the presentation. This way, you can concentrate on the message while our designers take care of providing you with the right template for the situation. This slide highlights comparison between big data analytics techniques for identifying suitable method of assessing business performance. It provides information regarding stages, objectives, techniques and pros.

Statistical Tools For Evidence Insurance Policy Cancellation Reduction Using Data Analytics
This slide represents the concise overview of the problem, the proposed solution, and the achieved result for using data analytics for insurance policy cancellation reduction. The outcomes are minimized consumer loss to rival businesses, identified high risk consumers, etc. The best PPT templates are a great way to save time, energy, and resources. Slidegeeks have 100 percent editable powerpoint slides making them incredibly versatile. With these quality presentation templates, you can create a captivating and memorable presentation by combining visually appealing slides and effectively communicating your message. Download Statistical Tools For Evidence Insurance Policy Cancellation Reduction Using Data Analytics from Slidegeeks and deliver a wonderful presentation. This slide represents the concise overview of the problem, the proposed solution, and the achieved result for using data analytics for insurance policy cancellation reduction. The outcomes are minimized consumer loss to rival businesses, identified high risk consumers, etc.

Importance Of Natural Language Generation In Analytics Platforms Natural Language Automation
This slide outlines the role of Natural Language Generation in analytics platforms used by businesses. The purpose of this slide is to showcase why NLG is used in analytics platforms. It also includes the example of a BI tool that interprets the graphical representation reports into text form. Explore a selection of the finest Importance Of Natural Language Generation In Analytics Platforms Natural Language Automation here. With a plethora of professionally designed and pre-made slide templates, you can quickly and easily find the right one for your upcoming presentation. You can use our Importance Of Natural Language Generation In Analytics Platforms Natural Language Automation to effectively convey your message to a wider audience. Slidegeeks has done a lot of research before preparing these presentation templates. The content can be personalized and the slides are highly editable. Grab templates today from Slidegeeks. This slide outlines the role of Natural Language Generation in analytics platforms used by businesses. The purpose of this slide is to showcase why NLG is used in analytics platforms. It also includes the example of a BI tool that interprets the graphical representation reports into text form.
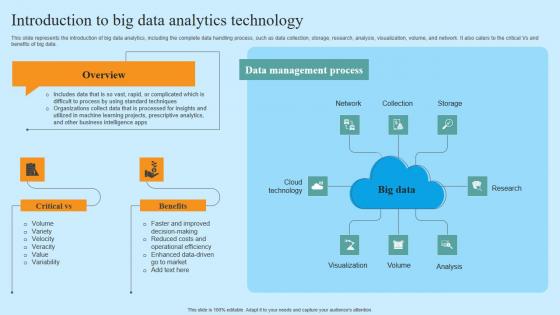
Introduction To Big Data Analytics Technology Hyper Automation Solutions Designs Pdf
This slide represents the introduction of big data analytics, including the complete data handling process, such as data collection, storage, research, analysis, visualization, volume, and network. It also caters to the critical Vs and benefits of big data. Retrieve professionally designed Introduction To Big Data Analytics Technology Hyper Automation Solutions Designs Pdf to effectively convey your message and captivate your listeners. Save time by selecting pre-made slideshows that are appropriate for various topics, from business to educational purposes. These themes come in many different styles, from creative to corporate, and all of them are easily adjustable and can be edited quickly. Access them as PowerPoint templates or as Google Slides themes. You do not have to go on a hunt for the perfect presentation because Slidegeeks got you covered from everywhere. This slide represents the introduction of big data analytics, including the complete data handling process, such as data collection, storage, research, analysis, visualization, volume, and network. It also caters to the critical Vs and benefits of big data.

Big Data Analytics To Gather And Process Details Optimizing Inventory Management IoT SS V
This slide provides an overview of the big data analytics technology used to analyze information collected. The slide further includes applications and benefits that are greater competitive deg, less downtime, production and supply chain management. If you are looking for a format to display your unique thoughts, then the professionally designed Big Data Analytics To Gather And Process Details Optimizing Inventory Management IoT SS V is the one for you. You can use it as a Google Slides template or a PowerPoint template. Incorporate impressive visuals, symbols, images, and other charts. Modify or reorganize the text boxes as you desire. Experiment with shade schemes and font pairings. Alter, share or cooperate with other people on your work. Download Big Data Analytics To Gather And Process Details Optimizing Inventory Management IoT SS V and find out how to give a successful presentation. Present a perfect display to your team and make your presentation unforgettable. This slide provides an overview of the big data analytics technology used to analyze information collected. The slide further includes applications and benefits that are greater competitive deg, less downtime, production and supply chain management.
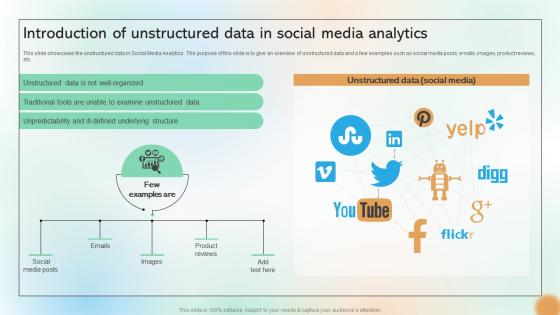
Introduction Of Unstructured Data In Social Media Analytics Cracking The Code Of Social Media
This slide showcases the unstructured data in Social Media Analytics. The purpose of this slide is to give an overview of unstructured data and a few examples such as social media posts, emails, images, product reviews, etc. Present like a pro with Introduction Of Unstructured Data In Social Media Analytics Cracking The Code Of Social Media. Create beautiful presentations together with your team, using our easy-to-use presentation slides. Share your ideas in real-time and make changes on the fly by downloading our templates. So whether you are in the office, on the go, or in a remote location, you can stay in sync with your team and present your ideas with This slide showcases the unstructured data in Social Media Analytics. The purpose of this slide is to give an overview of unstructured data and a few examples such as social media posts, emails, images, product reviews, etc.
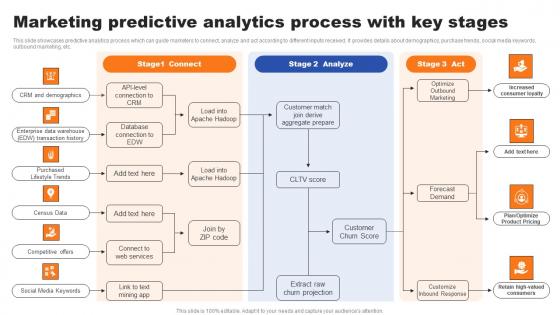
Marketing Predictive Analytics Process With Key Stages Ppt Show Background Image Pdf
This slide showcases predictive analytics process which can guide marketers to connect, analyze and act according to different inputs received. It provides details about demographics, purchase trends, social media keywords, outbound marketing, etc. Welcome to our selection of the Marketing Predictive Analytics Process With Key Stages Ppt Show Background Image Pdf. These are designed to help you showcase your creativity and bring your sphere to life. Planning and Innovation are essential for any business that is just starting out. This collection contains the designs that you need for your everyday presentations. All of our PowerPoints are 100 percent editable, so you can customize them to suit your needs. This multi-purpose template can be used in various situations. Grab these presentation templates today This slide showcases predictive analytics process which can guide marketers to connect, analyze and act according to different inputs received. It provides details about demographics, purchase trends, social media keywords, outbound marketing, etc.
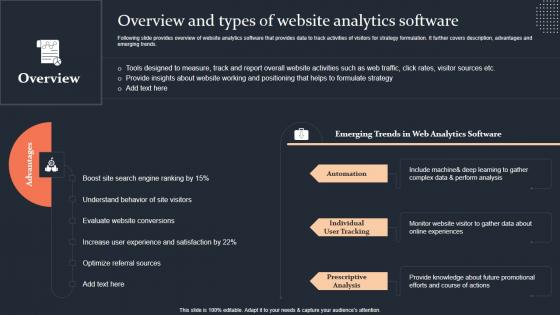
Overview And Types Of Website Analytics Software Step By Step Guide Topics PDF
Following slide provides overview of website analytics software that provides data to track activities of visitors for strategy formulation. It further covers description, advantages and emerging trends. This Overview And Types Of Website Analytics Software Step By Step Guide Topics PDF from Slidegeeks makes it easy to present information on your topic with precision. It provides customization options, so you can make changes to the colors, design, graphics, or any other component to create a unique layout. It is also available for immediate download, so you can begin using it right away. Slidegeeks has done good research to ensure that you have everything you need to make your presentation stand out. Make a name out there for a brilliant performance. Following slide provides overview of website analytics software that provides data to track activities of visitors for strategy formulation. It further covers description, advantages and emerging trends.
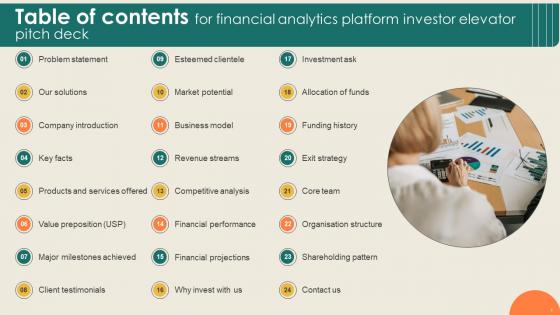
Table Of Contents For Financial Analytics Platform Investor Elevator Pitch Deck
If your project calls for a presentation, then Slidegeeks is your go-to partner because we have professionally designed, easy-to-edit templates that are perfect for any presentation. After downloading, you can easily edit Table Of Contents For Financial Analytics Platform Investor Elevator Pitch Deck and make the changes accordingly. You can rearrange slides or fill them with different images. Check out all the handy templates Our Table Of Contents For Financial Analytics Platform Investor Elevator Pitch Deck are topically designed to provide an attractive backdrop to any subject. Use them to look like a presentation pro.
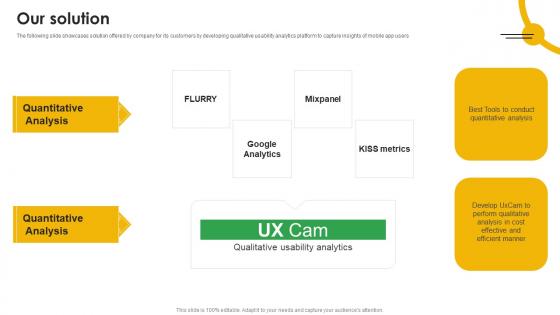
Our Solution Mobile App Analytics Company Fund Raising Pitch Deck Graphics Pdf
The following slide showcases solution offered by company for its customers by developing qualitative usability analytics platform to capture insights of mobile app users Present like a pro with Our Solution Mobile App Analytics Company Fund Raising Pitch Deck Graphics Pdf Create beautiful presentations together with your team, using our easy to use presentation slides. Share your ideas in real time and make changes on the fly by downloading our templates. So whether you are in the office, on the go, or in a remote location, you can stay in sync with your team and present your ideas with confidence. With Slidegeeks presentation got a whole lot easier. Grab these presentations today. The following slide showcases solution offered by company for its customers by developing qualitative usability analytics platform to capture insights of mobile app users
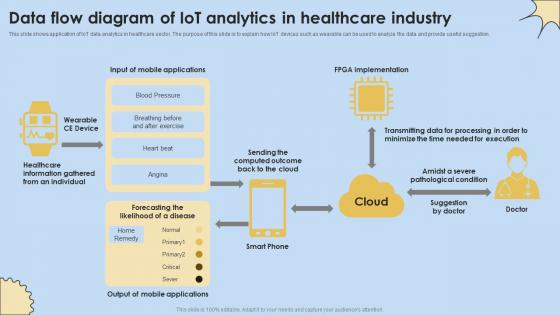
Data Flow Diagram Of IoT Analytics In Healthcare Industry Internet Of Things Analysis Clipart Pdf
This slide shows application of IoT data analytics in healthcare sector. The purpose of this slide is to explain how IoT devices such as wearable can be used to analyze the data and provide useful suggestion. If you are looking for a format to display your unique thoughts, then the professionally designed Data Flow Diagram Of IoT Analytics In Healthcare Industry Internet Of Things Analysis Clipart Pdf is the one for you. You can use it as a Google Slides template or a PowerPoint template. Incorporate impressive visuals, symbols, images, and other charts. Modify or reorganize the text boxes as you desire. Experiment with shade schemes and font pairings. Alter, share or cooperate with other people on your work. Download Data Flow Diagram Of IoT Analytics In Healthcare Industry Internet Of Things Analysis Clipart Pdf and find out how to give a successful presentation. Present a perfect display to your team and make your presentation unforgettable. This slide shows application of IoT data analytics in healthcare sector. The purpose of this slide is to explain how IoT devices such as wearable can be used to analyze the data and provide useful suggestion.
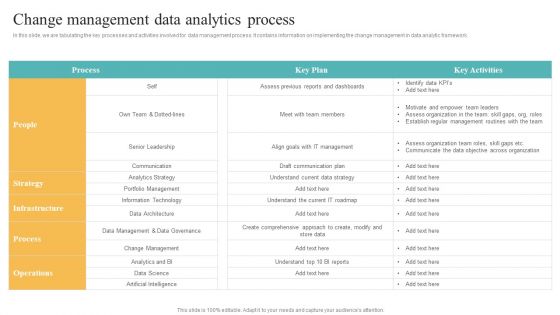
Transformation Toolkit Competitive Intelligence Information Analysis Change Management Data Analytics Process Template PDF
In this slide, we are tabulating the key processes and activities involved for data management process. It contains information on implementing the change management in data analytic framework. Formulating a presentation can take up a lot of effort and time, so the content and message should always be the primary focus. The visuals of the PowerPoint can enhance the presenters message, so our Transformation Toolkit Competitive Intelligence Information Analysis Change Management Data Analytics Process Template PDF was created to help save time. Instead of worrying about the design, the presenter can concentrate on the message while our designers work on creating the ideal templates for whatever situation is needed. Slidegeeks has experts for everything from amazing designs to valuable content, we have put everything into Transformation Toolkit Competitive Intelligence Information Analysis Change Management Data Analytics Process Template PDF
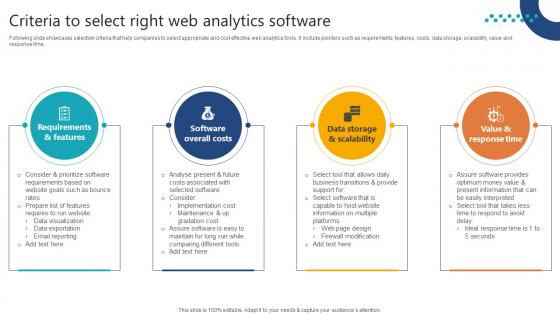
Complete Guide To Launch Criteria To Select Right Web Analytics Software
Following slide showcases selection criteria that help companies to select appropriate and cost effective web analytics tools. It include pointers such as requirements, features, costs, data storage, scalability, value and response time. If your project calls for a presentation, then Slidegeeks is your go-to partner because we have professionally designed, easy-to-edit templates that are perfect for any presentation. After downloading, you can easily edit Complete Guide To Launch Criteria To Select Right Web Analytics Software and make the changes accordingly. You can rearrange slides or fill them with different images. Check out all the handy templates Following slide showcases selection criteria that help companies to select appropriate and cost effective web analytics tools. It include pointers such as requirements, features, costs, data storage, scalability, value and response time.
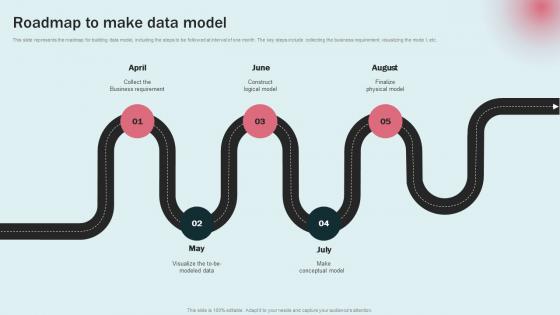
Roadmap To Make Data Model Data Modeling Approaches For Modern Analytics Guidelines Pdf
This slide represents the roadmap for building data model, including the steps to be followed at interval of one month. The key steps include collecting the business requirement, visualizing the mode l, etc. Retrieve professionally designed Roadmap To Make Data Model Data Modeling Approaches For Modern Analytics Guidelines Pdf to effectively convey your message and captivate your listeners. Save time by selecting pre made slideshows that are appropriate for various topics, from business to educational purposes. These themes come in many different styles, from creative to corporate, and all of them are easily adjustable and can be edited quickly. Access them as PowerPoint templates or as Google Slides themes. You do not have to go on a hunt for the perfect presentation because Slidegeeks got you covered from everywhere. This slide represents the roadmap for building data model, including the steps to be followed at interval of one month. The key steps include collecting the business requirement, visualizing the mode l, etc.

Complete Guide To Launch Overview And Types Of Website Analytics Software
Following slide provides overview of website analytics software that provides data to track activities of visitors for strategy formulation. It further covers description, advantages and emerging trends. This Complete Guide To Launch Overview And Types Of Website Analytics Software from Slidegeeks makes it easy to present information on your topic with precision. It provides customization options, so you can make changes to the colors, design, graphics, or any other component to create a unique layout. It is also available for immediate download, so you can begin using it right away. Slidegeeks has done good research to ensure that you have everything you need to make your presentation stand out. Make a name out there for a brilliant performance. Following slide provides overview of website analytics software that provides data to track activities of visitors for strategy formulation. It further covers description, advantages and emerging trends.
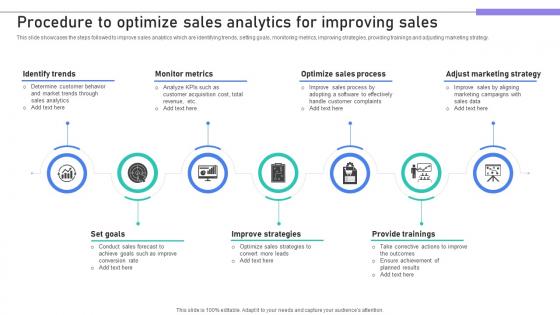
Building Stronger Customer Procedure To Optimize Sales Analytics For Improving Sales SA SS V
This slide showcases the steps followed to improve sales analytics which are identifying trends, setting goals, monitoring metrics, improving strategies, providing trainings and adjusting marketing strategy. This Building Stronger Customer Procedure To Optimize Sales Analytics For Improving Sales SA SS V from Slidegeeks makes it easy to present information on your topic with precision. It provides customization options, so you can make changes to the colors, design, graphics, or any other component to create a unique layout. It is also available for immediate download, so you can begin using it right away. Slidegeeks has done good research to ensure that you have everything you need to make your presentation stand out. Make a name out there for a brilliant performance. This slide showcases the steps followed to improve sales analytics which are identifying trends, setting goals, monitoring metrics, improving strategies, providing trainings and adjusting marketing strategy.
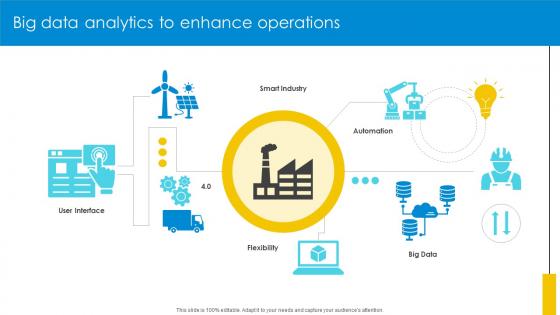
Big Data Analytics To Enhance Operations Optimizing Inventory Management IoT SS V
If your project calls for a presentation, then Slidegeeks is your go-to partner because we have professionally designed, easy-to-edit templates that are perfect for any presentation. After downloading, you can easily edit Big Data Analytics To Enhance Operations Optimizing Inventory Management IoT SS V and make the changes accordingly. You can rearrange slides or fill them with different images. Check out all the handy templates Our Big Data Analytics To Enhance Operations Optimizing Inventory Management IoT SS V are topically designed to provide an attractive backdrop to any subject. Use them to look like a presentation pro.
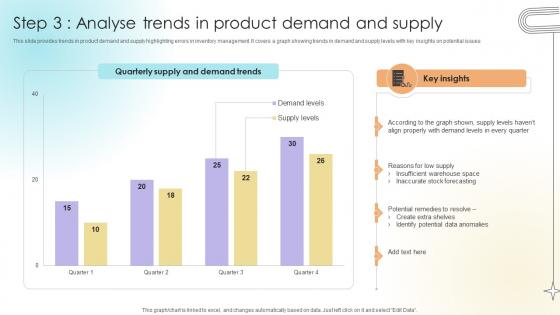
Step 3 Analyse Trends In Product Demand And Supply Data Analytics SS V
This slide provides trends in product demand and supply highlighting errors in inventory management. It covers a graph showing trends in demand and supply levels with key insights on potential issues.Formulating a presentation can take up a lot of effort and time, so the content and message should always be the primary focus. The visuals of the PowerPoint can enhance the presenters message, so our Step 3 Analyse Trends In Product Demand And Supply Data Analytics SS V was created to help save time. Instead of worrying about the design, the presenter can concentrate on the message while our designers work on creating the ideal templates for whatever situation is needed. Slidegeeks has experts for everything from amazing designs to valuable content, we have put everything into Step 3 Analyse Trends In Product Demand And Supply Data Analytics SS V. This slide provides trends in product demand and supply highlighting errors in inventory management. It covers a graph showing trends in demand and supply levels with key insights on potential issues.
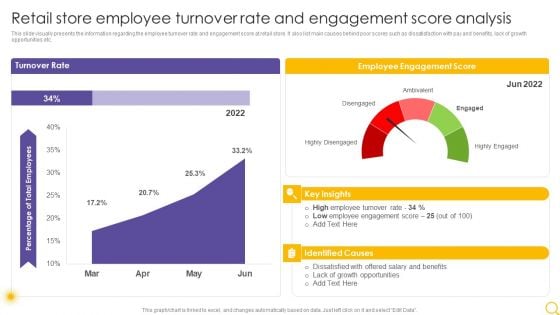
Retail Outlet Operational Efficiency Analytics Retail Store Employee Turnover Rate And Engagement Infographics PDF
This slide visually presents the information regarding the employee turnover rate and engagement score at retail store. It also list main causes behind poor scores such as dissatisfaction with pay and benefits, lack of growth opportunities etc. Deliver an awe inspiring pitch with this creative Retail Outlet Operational Efficiency Analytics Retail Store Employee Turnover Rate And Engagement Infographics PDF bundle. Topics like Turnover Rate, Employee Engagement Score, Identified Causes can be discussed with this completely editable template. It is available for immediate download depending on the needs and requirements of the user.
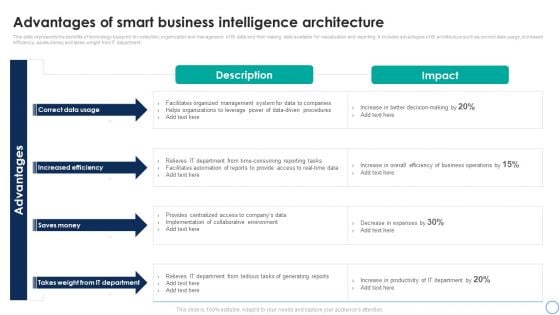
Business Analytics Application Advantages Of Smart Business Intelligence Architecture Demonstration PDF
This slide represents the benefits of technology blueprint for collection, organization and management of BI data and then making data available for visualization and reporting. It includes advantages of BI architecture such as correct data usage, increased efficiency, saves money and takes weight from IT department. Find a pre-designed and impeccable Business Analytics Application Advantages Of Smart Business Intelligence Architecture Demonstration PDF. The templates can ace your presentation without additional effort. You can download these easy-to-edit presentation templates to make your presentation stand out from others. So, what are you waiting for Download the template from Slidegeeks today and give a unique touch to your presentation.
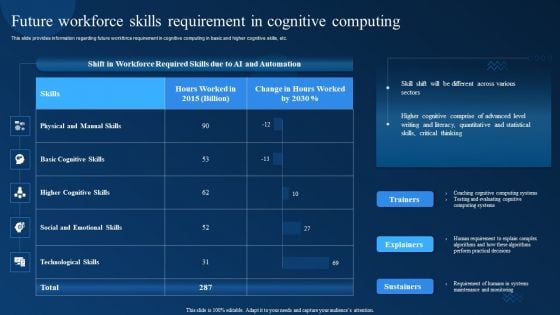
Cognitive Analytics Strategy And Techniques Future Workforce Skills Requirement In Cognitive Computing Brochure PDF
This slide provides information regarding future workforce requirement in cognitive computing in basic and higher cognitive skills, etc. The Cognitive Analytics Strategy And Techniques Future Workforce Skills Requirement In Cognitive Computing Brochure PDF is a compilation of the most recent design trends as a series of slides. It is suitable for any subject or industry presentation, containing attractive visuals and photo spots for businesses to clearly express their messages. This template contains a variety of slides for the user to input data, such as structures to contrast two elements, bullet points, and slides for written information. Slidegeeks is prepared to create an impression.
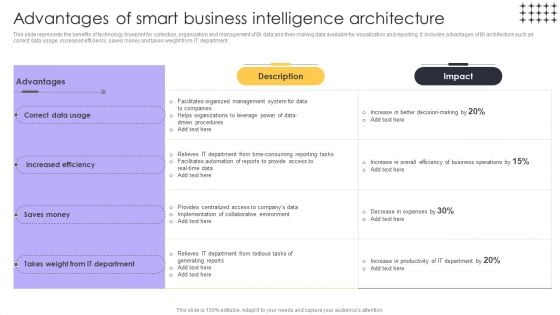
Tools For HR Business Analytics Advantages Of Smart Business Intelligence Architecture Microsoft PDF
This slide represents the benefits of technology blueprint for collection, organization and management of BI data and then making data available for visualization and reporting. It includes advantages of BI architecture such as correct data usage, increased efficiency, saves money and takes weight from IT department. Find a pre-designed and impeccable Tools For HR Business Analytics Advantages Of Smart Business Intelligence Architecture Microsoft PDF. The templates can ace your presentation without additional effort. You can download these easy-to-edit presentation templates to make your presentation stand out from others. So, what are you waiting for Download the template from Slidegeeks today and give a unique touch to your presentation.
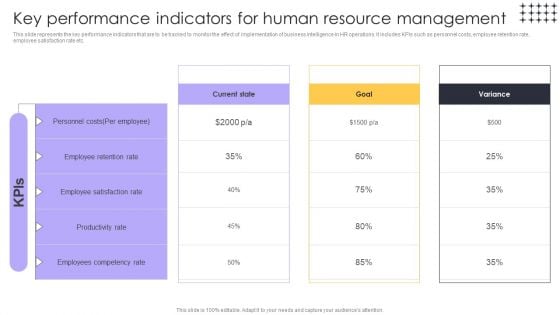
Tools For HR Business Analytics Key Performance Indicators For Human Resource Elements PDF
This slide represents the key performance indicators that are to be tracked to monitor the effect of implementation of business intelligence in HR operations. It includes KPIs such as personnel costs, employee retention rate, employee satisfaction rate etc. The best PPT templates are a great way to save time, energy, and resources. Slidegeeks have 100 percent editable powerpoint slides making them incredibly versatile. With these quality presentation templates, you can create a captivating and memorable presentation by combining visually appealing slides and effectively communicating your message. Download Tools For HR Business Analytics Key Performance Indicators For Human Resource Elements PDF from Slidegeeks and deliver a wonderful presentation.
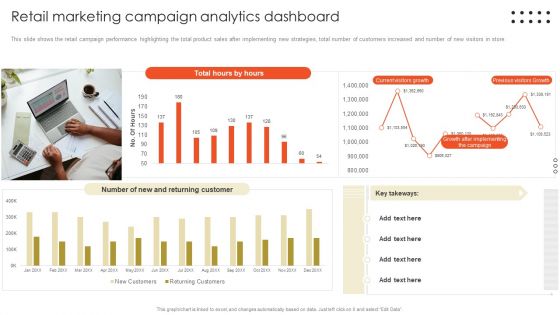
Retail Marketing Campaign Effective Techniques Retail Marketing Campaign Analytics Dashboard Topics PDF
This slide shows the retail campaign performance highlighting the total product sales after implementing new strategies, total number of customers increased and number of new visitors in store. The best PPT templates are a great way to save time, energy, and resources. Slidegeeks have 100 percent editable powerpoint slides making them incredibly versatile. With these quality presentation templates, you can create a captivating and memorable presentation by combining visually appealing slides and effectively communicating your message. Download Retail Marketing Campaign Effective Techniques Retail Marketing Campaign Analytics Dashboard Topics PDF from Slidegeeks and deliver a wonderful presentation.
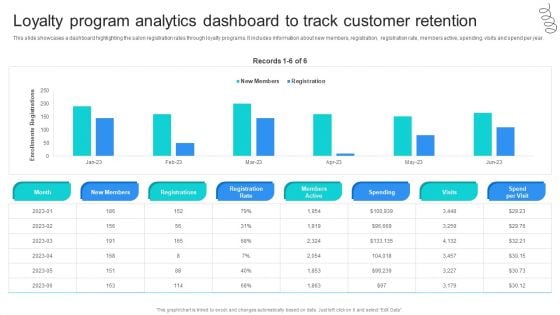
Strategic Marketing For Hair And Beauty Salon To Increase Loyalty Program Analytics Dashboard Clipart PDF
This slide showcases a dashboard highlighting the salon registration rates through loyalty programs. It includes information about new members, registration, registration rate, members active, spending, visits and spend per year. The best PPT templates are a great way to save time, energy, and resources. Slidegeeks have 100 percent editable powerpoint slides making them incredibly versatile. With these quality presentation templates, you can create a captivating and memorable presentation by combining visually appealing slides and effectively communicating your message. Download Strategic Marketing For Hair And Beauty Salon To Increase Loyalty Program Analytics Dashboard Clipart PDF from Slidegeeks and deliver a wonderful presentation.
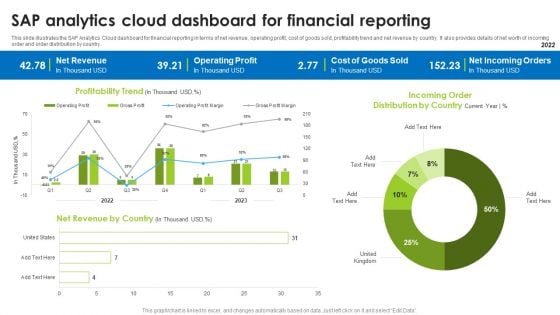
BI Technique For Data Informed Decisions Sap Analytics Cloud Dashboard For Financial Reporting Portrait PDF
This slide illustrates the SAP Analytics Cloud dashboard for financial reporting in terms of net revenue, operating profit, cost of goods sold, profitability trend and net revenue by country. It also provides details of net worth of incoming order and order distribution by country. Coming up with a presentation necessitates that the majority of the effort goes into the content and the message you intend to convey. The visuals of a PowerPoint presentation can only be effective if it supplements and supports the story that is being told. Keeping this in mind our experts created BI Technique For Data Informed Decisions Sap Analytics Cloud Dashboard For Financial Reporting Portrait PDF to reduce the time that goes into designing the presentation. This way, you can concentrate on the message while our designers take care of providing you with the right template for the situation.
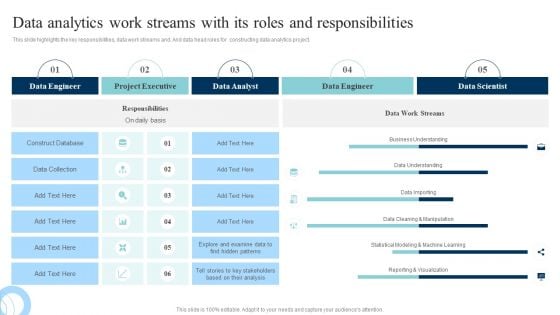
Data Evaluation And Processing Toolkit Data Analytics Work Streams With Its Roles Topics PDF
This slide highlights the key responsibilities, data work streams and. And data head roles for constructing data analytics project. Coming up with a presentation necessitates that the majority of the effort goes into the content and the message you intend to convey. The visuals of a PowerPoint presentation can only be effective if it supplements and supports the story that is being told. Keeping this in mind our experts created Data Evaluation And Processing Toolkit Data Analytics Work Streams With Its Roles Topics PDF to reduce the time that goes into designing the presentation. This way, you can concentrate on the message while our designers take care of providing you with the right template for the situation.
Predictive Analytics Model Performance Tracking Dashboard Forward Looking Analysis IT Introduction PDF
This slide represents the predictive analytics model performance tracking dashboard, and it covers the details of total visitors, total buyers, total products added to the cart, filters by date and category, visitors to clients conversion rate, and so on.The Predictive Analytics Model Performance Tracking Dashboard Forward Looking Analysis IT Introduction PDF is a compilation of the most recent design trends as a series of slides. It is suitable for any subject or industry presentation, containing attractive visuals and photo spots for businesses to clearly express their messages. This template contains a variety of slides for the user to input data, such as structures to contrast two elements, bullet points, and slides for written information. Slidegeeks is prepared to create an impression.
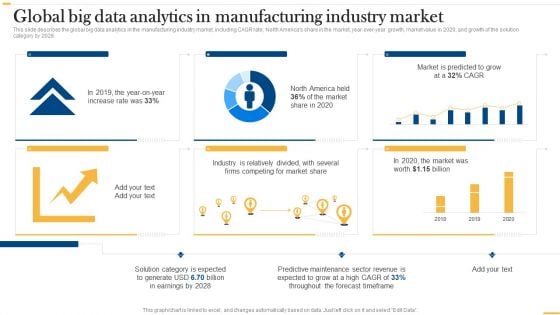
Deploying AI To Enhance Global Big Data Analytics In Manufacturing Industry Market Professional PDF
This slide describes the global big data analytics in the manufacturing industry market, including CAGR rate, North Americas share in the market, year-over-year growth, market value in 2020, and growth of the solution category by 2028. Coming up with a presentation necessitates that the majority of the effort goes into the content and the message you intend to convey. The visuals of a PowerPoint presentation can only be effective if it supplements and supports the story that is being told. Keeping this in mind our experts created Deploying AI To Enhance Global Big Data Analytics In Manufacturing Industry Market Professional PDF to reduce the time that goes into designing the presentation. This way, you can concentrate on the message while our designers take care of providing you with the right template for the situation.
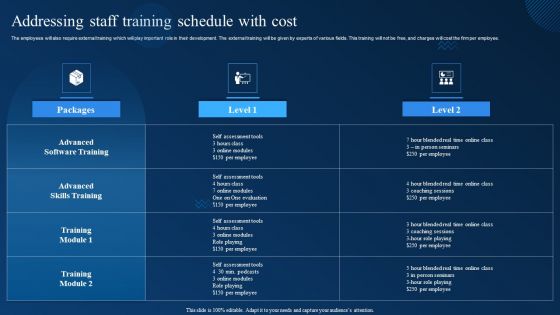
Cognitive Analytics Strategy And Techniques Addressing Staff Training Schedule With Cost Mockup PDF
The employees will also require external training which will play important role in their development. The external training will be given by experts of various fields. This training will not be free, and charges will cost the firm per employee. Formulating a presentation can take up a lot of effort and time, so the content and message should always be the primary focus. The visuals of the PowerPoint can enhance the presenters message, so our Cognitive Analytics Strategy And Techniques Addressing Staff Training Schedule With Cost Mockup PDF was created to help save time. Instead of worrying about the design, the presenter can concentrate on the message while our designers work on creating the ideal templates for whatever situation is needed. Slidegeeks has experts for everything from amazing designs to valuable content, we have put everything into Cognitive Analytics Strategy And Techniques Addressing Staff Training Schedule With Cost Mockup PDF.
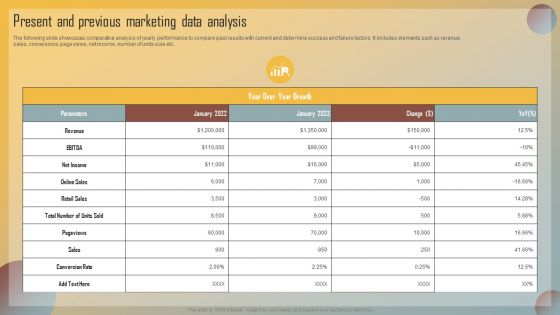
Guide For Marketing Analytics To Improve Decisions Present And Previous Marketing Data Analysis Rules PDF
The following slide showcases comparative analysis of yearly performance to compare past results with current and determine success and failure factors. It includes elements such as revenue, sales, conversions, page views, net income, number of units sole etc. Formulating a presentation can take up a lot of effort and time, so the content and message should always be the primary focus. The visuals of the PowerPoint can enhance the presenters message, so our Guide For Marketing Analytics To Improve Decisions Present And Previous Marketing Data Analysis Rules PDF was created to help save time. Instead of worrying about the design, the presenter can concentrate on the message while our designers work on creating the ideal templates for whatever situation is needed. Slidegeeks has experts for everything from amazing designs to valuable content, we have put everything into Guide For Marketing Analytics To Improve Decisions Present And Previous Marketing Data Analysis Rules PDF
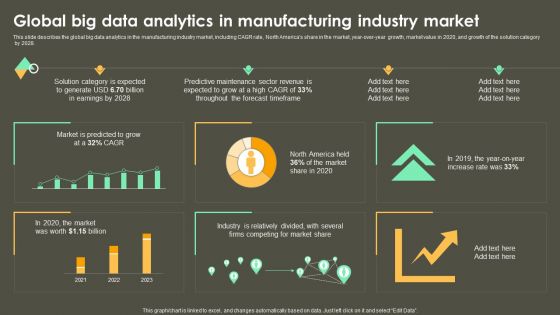
Iot Integration In Manufacturing Global Big Data Analytics In Manufacturing Industry Market Infographics PDF
This slide describes the global big data analytics in the manufacturing industry market, including CAGR rate, North Americas share in the market, year-over-year growth, market value in 2020, and growth of the solution category by 2028. Coming up with a presentation necessitates that the majority of the effort goes into the content and the message you intend to convey. The visuals of a PowerPoint presentation can only be effective if it supplements and supports the story that is being told. Keeping this in mind our experts created Iot Integration In Manufacturing Global Big Data Analytics In Manufacturing Industry Market Infographics PDF to reduce the time that goes into designing the presentation. This way, you can concentrate on the message while our designers take care of providing you with the right template for the situation.
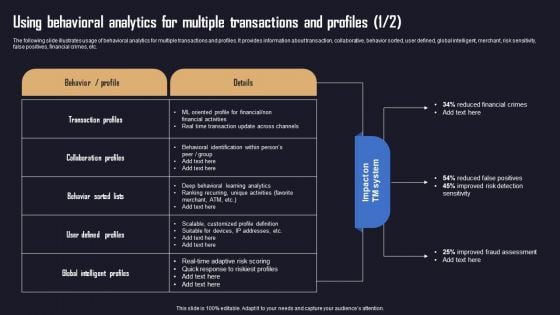
Ensuring Organizational Safety Using AML Transaction Using Behavioral Analytics Microsoft PDF
The following slide illustrates usage of behavioral analytics for multiple transactions and profiles. It provides information about transaction, collaborative, behavior sorted, user defined, global intelligent, merchant, risk sensitivity, false positives, financial crimes, etc. The Ensuring Organizational Safety Using AML Transaction Using Behavioral Analytics Microsoft PDF is a compilation of the most recent design trends as a series of slides. It is suitable for any subject or industry presentation, containing attractive visuals and photo spots for businesses to clearly express their messages. This template contains a variety of slides for the user to input data, such as structures to contrast two elements, bullet points, and slides for written information. Slidegeeks is prepared to create an impression.
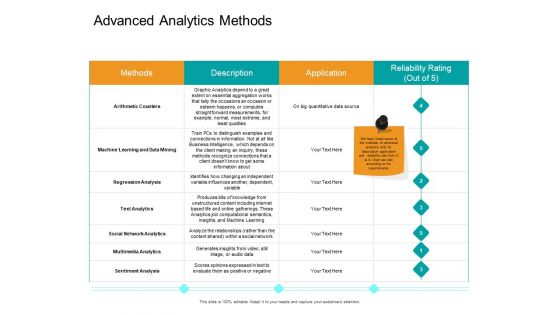
Facts Assessment Advanced Analytics Methods Ppt PowerPoint Presentation Show Graphic Images PDF
Presenting this set of slides with name facts assessment advanced analytics methods ppt powerpoint presentation show graphic images pdf. The topics discussed in these slides are methods, application, reliability rating, arithmetic counters, regression analysis, text analytics. This is a completely editable PowerPoint presentation and is available for immediate download. Download now and impress your audience.

Contact Us Mobile App Analytics Company Fund Raising Pitch Deck Diagrams Pdf
This Contact Us Mobile App Analytics Company Fund Raising Pitch Deck Diagrams Pdf from Slidegeeks makes it easy to present information on your topic with precision. It provides customization options, so you can make changes to the colors, design, graphics, or any other component to create a unique layout. It is also available for immediate download, so you can begin using it right away. Slidegeeks has done good research to ensure that you have everything you need to make your presentation stand out. Make a name out there for a brilliant performance. Our Contact Us Mobile App Analytics Company Fund Raising Pitch Deck Diagrams Pdf are topically designed to provide an attractive backdrop to any subject. Use them to look like a presentation pro.
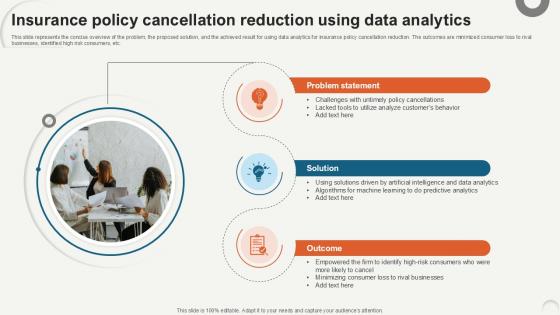
Insurance Policy Cancellation Reduction Data Analytics For Informed Decision Ppt PowerPoint
This slide represents the concise overview of the problem, the proposed solution, and the achieved result for using data analytics for insurance policy cancellation reduction. The outcomes are minimized consumer loss to rival businesses, identified high risk consumers, etc. This modern and well-arranged Insurance Policy Cancellation Reduction Data Analytics For Informed Decision Ppt PowerPoint provides lots of creative possibilities. It is very simple to customize and edit with the Powerpoint Software. Just drag and drop your pictures into the shapes. All facets of this template can be edited with Powerpoint, no extra software is necessary. Add your own material, put your images in the places assigned for them, adjust the colors, and then you can show your slides to the world, with an animated slide included. This slide represents the concise overview of the problem, the proposed solution, and the achieved result for using data analytics for insurance policy cancellation reduction. The outcomes are minimized consumer loss to rival businesses, identified high risk consumers, etc.
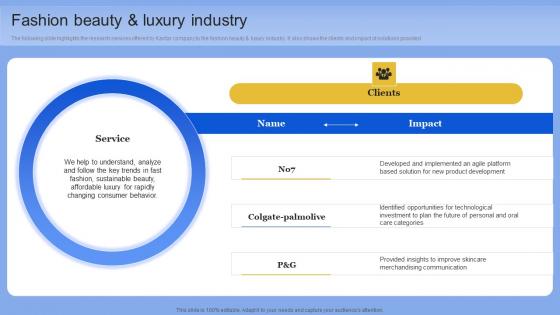
Fashion Beauty And Luxury Industry Data Analytics Company Outline Graphics PDF
The following slide highlights the research services offered by Kantar company to the fashion beauty and luxury industry. It also shows the clients and impact of solutions provided. Find highly impressive Fashion Beauty And Luxury Industry Data Analytics Company Outline Graphics PDF on Slidegeeks to deliver a meaningful presentation. You can save an ample amount of time using these presentation templates. No need to worry to prepare everything from scratch because Slidegeeks experts have already done a huge research and work for you. You need to download Fashion Beauty And Luxury Industry Data Analytics Company Outline Graphics PDF for your upcoming presentation. All the presentation templates are 100 percent editable and you can change the color and personalize the content accordingly. Download now The following slide highlights the research services offered by Kantar company to the fashion beauty and luxury industry. It also shows the clients and impact of solutions provided
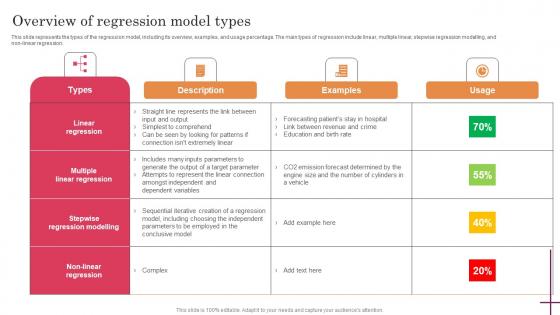
Overview Of Regression Model Types Predictive Analytics For Improved Mockup Pdf
This slide represents the types of the regression model, including its overview, examples, and usage percentage. The main types of regression include linear, multiple linear, stepwise regression modelling, and non-linear regression. Are you in need of a template that can accommodate all of your creative concepts This one is crafted professionally and can be altered to fit any style. Use it with Google Slides or PowerPoint. Include striking photographs, symbols, depictions, and other visuals. Fill, move around, or remove text boxes as desired. Test out color palettes and font mixtures. Edit and save your work, or work with colleagues. Download Overview Of Regression Model Types Predictive Analytics For Improved Mockup Pdf and observe how to make your presentation outstanding. Give an impeccable presentation to your group and make your presentation unforgettable. This slide represents the types of the regression model, including its overview, examples, and usage percentage. The main types of regression include linear, multiple linear, stepwise regression modelling, and non-linear regression.
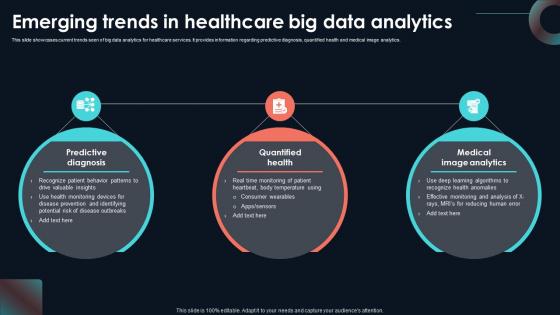
Emerging Trends In Healthcare Big Developing Strategic Insights Using Big Data Analytics SS V
This slide showcases current trends seen of big data analytics for healthcare services. It provides information regarding predictive diagnosis, quantified health and medical image analytics. Are you searching for a Emerging Trends In Healthcare Big Developing Strategic Insights Using Big Data Analytics SS V that is uncluttered, straightforward, and original Its easy to edit, and you can change the colors to suit your personal or business branding. For a presentation that expresses how much effort you have put in, this template is ideal With all of its features, including tables, diagrams, statistics, and lists, its perfect for a business plan presentation. Make your ideas more appealing with these professional slides. Download Emerging Trends In Healthcare Big Developing Strategic Insights Using Big Data Analytics SS V from Slidegeeks today. This slide showcases current trends seen of big data analytics for healthcare services. It provides information regarding predictive diagnosis, quantified health and medical image analytics.
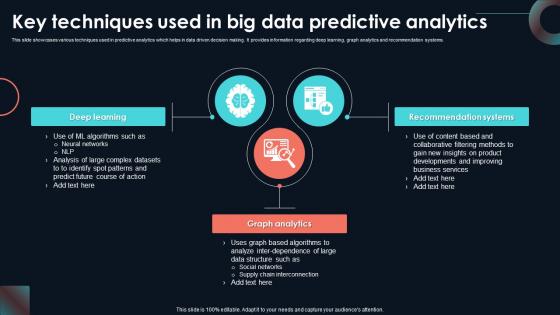
Key Techniques Used In Big Data Predictive Developing Strategic Insights Using Big Data Analytics SS V
This slide showcases various techniques used in predictive analytics which helps in data driven decision making. It provides information regarding deep learning, graph analytics and recommendation systems. Are you in need of a template that can accommodate all of your creative concepts This one is crafted professionally and can be altered to fit any style. Use it with Google Slides or PowerPoint. Include striking photographs, symbols, depictions, and other visuals. Fill, move around, or remove text boxes as desired. Test out color palettes and font mixtures. Edit and save your work, or work with colleagues. Download Key Techniques Used In Big Data Predictive Developing Strategic Insights Using Big Data Analytics SS V and observe how to make your presentation outstanding. Give an impeccable presentation to your group and make your presentation unforgettable. This slide showcases various techniques used in predictive analytics which helps in data driven decision making. It provides information regarding deep learning, graph analytics and recommendation systems.
Interactive Dashboard For Website Analytics Vector Icon Ppt PowerPoint Presentation Icon Background Images PDF
Showcasing this set of slides titled interactive dashboard for website analytics vector icon ppt powerpoint presentation icon background images pdf. The topics addressed in these templates are interactive dashboard for website analytics vector icon. All the content presented in this PPT design is completely editable. Download it and make adjustments in color, background, font etc. as per your unique business setting.
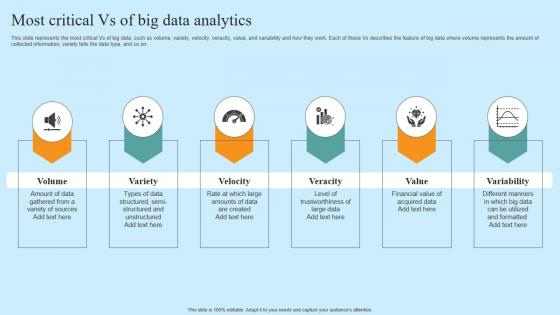
Most Critical Vs Of Big Data Analytics Hyper Automation Solutions Ideas Pdf
This slide depicts the overview of hyper-automation testing that consists of three components, including Selenium Integration, data protection authority DPA and robotic process automation RPA and artificial intelligence and machine learning. If you are looking for a format to display your unique thoughts, then the professionally designed Most Critical Vs Of Big Data Analytics Hyper Automation Solutions Ideas Pdf is the one for you. You can use it as a Google Slides template or a PowerPoint template. Incorporate impressive visuals, symbols, images, and other charts. Modify or reorganize the text boxes as you desire. Experiment with shade schemes and font pairings. Alter, share or cooperate with other people on your work. Download Most Critical Vs Of Big Data Analytics Hyper Automation Solutions Ideas Pdf and find out how to give a successful presentation. Present a perfect display to your team and make your presentation unforgettable. This slide depicts the overview of hyper-automation testing that consists of three components, including Selenium Integration, data protection authority DPA and robotic process automation RPA and artificial intelligence and machine learning.

Dashboard Analytics Measuring Supply Chain Efficiency Optimizing Retail Operations With Digital DT SS V
This slide represents a supply chain management dashboard measuring the efficiency of supply chain operations after effective digital transformation of retail operations. It includes inventory to sales, inventory turnover, carrying cost of inventory, inventory accuracy, and percentage out of stock items.If you are looking for a format to display your unique thoughts, then the professionally designed Dashboard Analytics Measuring Supply Chain Efficiency Optimizing Retail Operations With Digital DT SS V is the one for you. You can use it as a Google Slides template or a PowerPoint template. Incorporate impressive visuals, symbols, images, and other charts. Modify or reorganize the text boxes as you desire. Experiment with shade schemes and font pairings. Alter, share or cooperate with other people on your work. Download Dashboard Analytics Measuring Supply Chain Efficiency Optimizing Retail Operations With Digital DT SS V and find out how to give a successful presentation. Present a perfect display to your team and make your presentation unforgettable. This slide represents a supply chain management dashboard measuring the efficiency of supply chain operations after effective digital transformation of retail operations. It includes inventory to sales, inventory turnover, carrying cost of inventory, inventory accuracy, and percentage out of stock items.
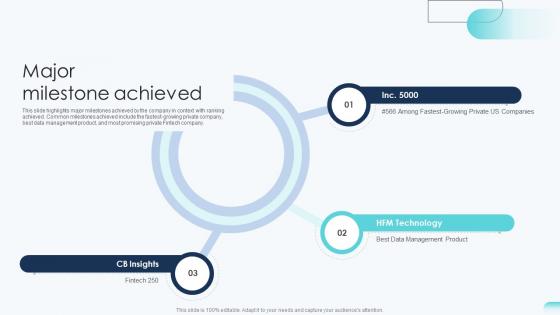
Major Milestone Achieved Big Data Analytics Investor Funding Elevator Pitch Deck
This slide highlights major milestones achieved by the company in context with ranking achieved. Common milestones achieved include the fastest-growing private company, best data management product, and most promising private Fintech company. If you are looking for a format to display your unique thoughts, then the professionally designed Major Milestone Achieved Big Data Analytics Investor Funding Elevator Pitch Deck is the one for you. You can use it as a Google Slides template or a PowerPoint template. Incorporate impressive visuals, symbols, images, and other charts. Modify or reorganize the text boxes as you desire. Experiment with shade schemes and font pairings. Alter, share or cooperate with other people on your work. Download Major Milestone Achieved Big Data Analytics Investor Funding Elevator Pitch Deck and find out how to give a successful presentation. Present a perfect display to your team and make your presentation unforgettable. This slide highlights major milestones achieved by the company in context with ranking achieved. Common milestones achieved include the fastest-growing private company, best data management product, and most promising private Fintech company.
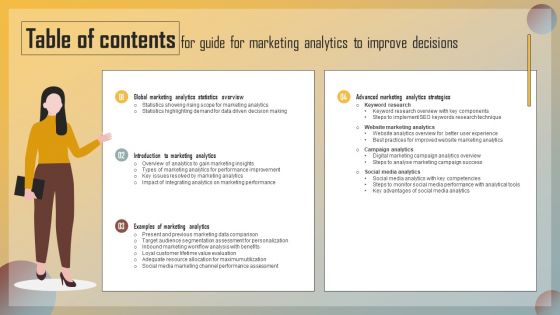
Table Of Contents For Guide For Marketing Analytics To Improve Decisions Demonstration PDF
If your project calls for a presentation, then Slidegeeks is your go to partner because we have professionally designed, easy to edit templates that are perfect for any presentation. After downloading, you can easily edit XXXXXXXXXXXXXXXXXXXXXXXXXXXXXXXXXXXXXXXXXXXXXXX and make the changes accordingly. You can rearrange slides or fill them with different images. Check out all the handy templates
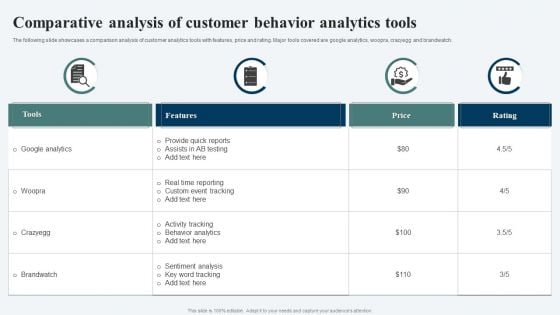
Comparative Analysis Of Customer Behavior Analytics Tools Ppt Summary Slides PDF
The following slide showcases a comparison analysis of customer analytics tools with features, price and rating. Major tools covered are google analytics, woopra, crazyegg and brandwatch. Pitch your topic with ease and precision using this Comparative Analysis Of Customer Behavior Analytics Tools Ppt Summary Slides PDF. This layout presents information on Google Analytics, Brandwatch, Provide Quick Reports. It is also available for immediate download and adjustment. So, changes can be made in the color, design, graphics or any other component to create a unique layout.
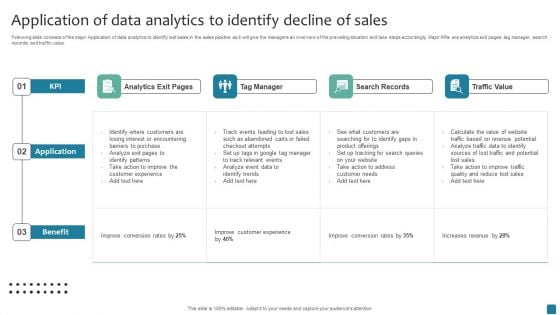
Application Of Data Analytics To Identify Decline Of Sales Slides PDF
Following slide consists of the major Application of data analytics to identify lost sales in the sales pipeline as it will give the managers an overview of the prevailing situation and take steps accordingly. Major KPIs are analytics exit pages, tag manager, search records, and traffic value. Pitch your topic with ease and precision using this Application Of Data Analytics To Identify Decline Of Sales Slides PDF. This layout presents information on Analytics Exit Pages, Tag Manager, Search Records. It is also available for immediate download and adjustment. So, changes can be made in the color, design, graphics or any other component to create a unique layout.

Analytics For Website Conversion Rate Optimization Ppt PowerPoint Presentation Inspiration Graphics Pictures PDF
Pitch your topic with ease and precision using this analytics for website conversion rate optimization ppt powerpoint presentation inspiration graphics pictures pdf. This layout presents information on analytics for website conversion rate optimization. It is also available for immediate download and adjustment. So, changes can be made in the color, design, graphics or any other component to create a unique layout.
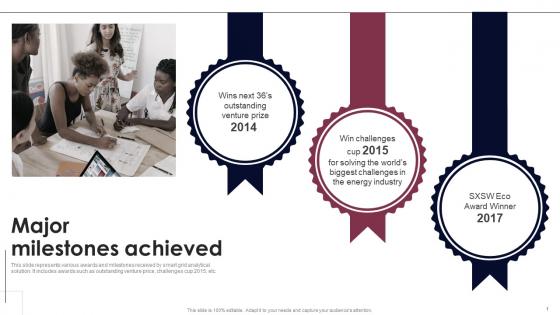
Major Milestones Achieved Smart Grid Analytics Investor Fund Raising Introduction PDF
This slide represents various awards and milestones received by smart grid analytical solution. It includes awards such as outstanding venture price, challenges cup 2015, etc. If your project calls for a presentation, then Slidegeeks is your go-to partner because we have professionally designed, easy-to-edit templates that are perfect for any presentation. After downloading, you can easily edit Major Milestones Achieved Smart Grid Analytics Investor Fund Raising Introduction PDF and make the changes accordingly. You can rearrange slides or fill them with different images. Check out all the handy templates This slide represents various awards and milestones received by smart grid analytical solution. It includes awards such as outstanding venture price, challenges cup 2015, etc.
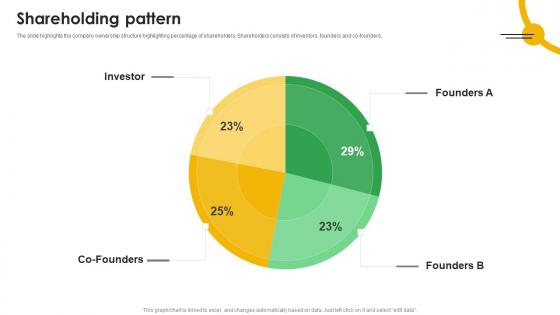
Shareholding Pattern Mobile App Analytics Company Fund Raising Pitch Deck Microsoft Pdf
The slide highlights the company ownership structure highlighting percentage of shareholders. Shareholders consists of investors, founders and co founders. If your project calls for a presentation, then Slidegeeks is your go to partner because we have professionally designed, easy to edit templates that are perfect for any presentation. After downloading, you can easily edit Shareholding Pattern Mobile App Analytics Company Fund Raising Pitch Deck Microsoft Pdf and make the changes accordingly. You can rearrange slides or fill them with different images. Check out all the handy templates The slide highlights the company ownership structure highlighting percentage of shareholders. Shareholders consists of investors, founders and co founders.

Steps To Develop Data Driven Insights Using Developing Strategic Insights Using Big Data Analytics SS V
This slide showcases steps involved in using descriptive analytics to create valuable business insights. It provides information regarding data collection, preparation, analysis and visualization. Are you searching for a Steps To Develop Data Driven Insights Using Developing Strategic Insights Using Big Data Analytics SS V that is uncluttered, straightforward, and original Its easy to edit, and you can change the colors to suit your personal or business branding. For a presentation that expresses how much effort you have put in, this template is ideal With all of its features, including tables, diagrams, statistics, and lists, its perfect for a business plan presentation. Make your ideas more appealing with these professional slides. Download Steps To Develop Data Driven Insights Using Developing Strategic Insights Using Big Data Analytics SS V from Slidegeeks today. This slide showcases steps involved in using descriptive analytics to create valuable business insights. It provides information regarding data collection, preparation, analysis and visualization.
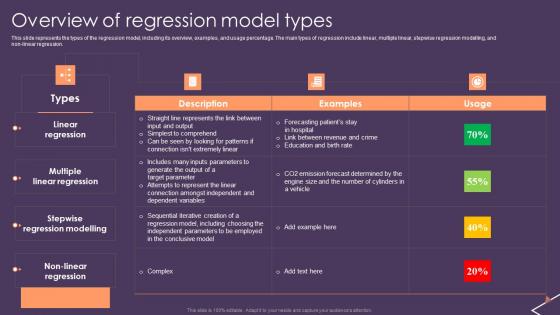
Predictive Analytics For Empowering Overview Of Regression Model Types Brochure Pdf
This slide represents the types of the regression model, including its overview, examples, and usage percentage. The main types of regression include linear, multiple linear, stepwise regression modelling, and non-linear regression. If your project calls for a presentation, then Slidegeeks is your go-to partner because we have professionally designed, easy-to-edit templates that are perfect for any presentation. After downloading, you can easily edit Predictive Analytics For Empowering Overview Of Regression Model Types Brochure Pdf and make the changes accordingly. You can rearrange slides or fill them with different images. Check out all the handy templates This slide represents the types of the regression model, including its overview, examples, and usage percentage. The main types of regression include linear, multiple linear, stepwise regression modelling, and non-linear regression.

Overview Of Neural Network Model Types Predictive Analytics For Improved Sample Pdf
This slide depicts the different types of the neural network model, including their overview, use cases and usage. The main types include feed-forward neural networks, recurrent, convolutional, deconvolutional and modular neural networks. If your project calls for a presentation, then Slidegeeks is your go-to partner because we have professionally designed, easy-to-edit templates that are perfect for any presentation. After downloading, you can easily edit Overview Of Neural Network Model Types Predictive Analytics For Improved Sample Pdf and make the changes accordingly. You can rearrange slides or fill them with different images. Check out all the handy templates This slide depicts the different types of the neural network model, including their overview, use cases and usage. The main types include feed-forward neural networks, recurrent, convolutional, deconvolutional and modular neural networks.
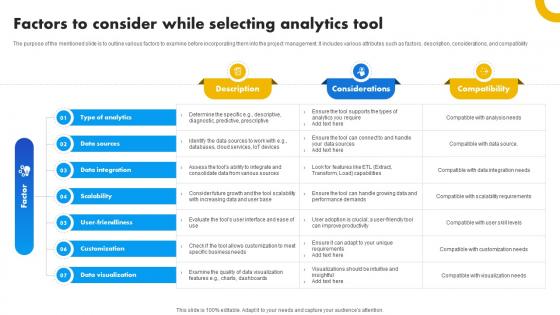
Factors To Consider While Selecting Analytics Tool Strategies For Success In Digital
The purpose of the mentioned slide is to outline various factors to examine before incorporating them into the project management. It includes various attributes such as factors, description, considerations, and compatibility. If your project calls for a presentation, then Slidegeeks is your go-to partner because we have professionally designed, easy-to-edit templates that are perfect for any presentation. After downloading, you can easily edit Factors To Consider While Selecting Analytics Tool Strategies For Success In Digital and make the changes accordingly. You can rearrange slides or fill them with different images. Check out all the handy templates The purpose of the mentioned slide is to outline various factors to examine before incorporating them into the project management. It includes various attributes such as factors, description, considerations, and compatibility.


 Continue with Email

 Home
Home


