Visual Analytics

Factors To Consider While Selecting Analytics Tool Digital Transformation In Project Management
The purpose of the mentioned slide is to outline various factors to examine before incorporating them into the project management. It includes various attributes such as factors, description, considerations, and compatibility. If your project calls for a presentation, then Slidegeeks is your go-to partner because we have professionally designed, easy-to-edit templates that are perfect for any presentation. After downloading, you can easily edit Factors To Consider While Selecting Analytics Tool Digital Transformation In Project Management and make the changes accordingly. You can rearrange slides or fill them with different images. Check out all the handy templates The purpose of the mentioned slide is to outline various factors to examine before incorporating them into the project management. It includes various attributes such as factors, description, considerations, and compatibility
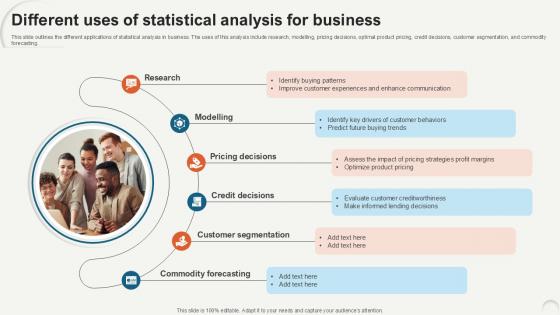
Different Uses Of Statistical Data Analytics For Informed Decision Ppt Slide
This slide outlines the different applications of statistical analysis in business. The uses of this analysis include research, modelling, pricing decisions, optimal product pricing, credit decisions, customer segmentation, and commodity forecasting. If your project calls for a presentation, then Slidegeeks is your go-to partner because we have professionally designed, easy-to-edit templates that are perfect for any presentation. After downloading, you can easily edit Different Uses Of Statistical Data Analytics For Informed Decision Ppt Slide and make the changes accordingly. You can rearrange slides or fill them with different images. Check out all the handy templates This slide outlines the different applications of statistical analysis in business. The uses of this analysis include research, modelling, pricing decisions, optimal product pricing, credit decisions, customer segmentation, and commodity forecasting.
Tracking Social Media Content Major Promotional Analytics Future Trends Professional Pdf
This slide covers an overview of social media content reach to identify the number of people who see your content, either ads or posts. It also includes improvement strategies such as producing high quality content, increasing the number of images, etc. Create an editable Tracking Social Media Content Major Promotional Analytics Future Trends Professional Pdf that communicates your idea and engages your audience. Whether you are presenting a business or an educational presentation, pre designed presentation templates help save time. Tracking Social Media Content Major Promotional Analytics Future Trends Professional Pdf is highly customizable and very easy to edit, covering many different styles from creative to business presentations. Slidegeeks has creative team members who have crafted amazing templates. So, go and get them without any delay. This slide covers an overview of social media content reach to identify the number of people who see your content, either ads or posts. It also includes improvement strategies such as producing high quality content, increasing the number of images, etc.
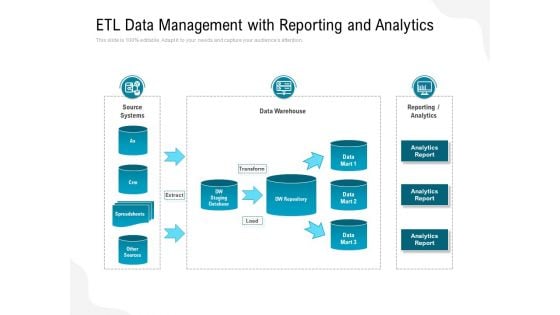
ETL Data Management With Reporting And Analytics Ppt PowerPoint Presentation Gallery Slide Download PDF
Pitch your topic with ease and precision using this etl data management with reporting and analytics ppt powerpoint presentation gallery slide download pdf. This layout presents information on source systems, data warehouse, analytics. It is also available for immediate download and adjustment. So, changes can be made in the color, design, graphics or any other component to create a unique layout.
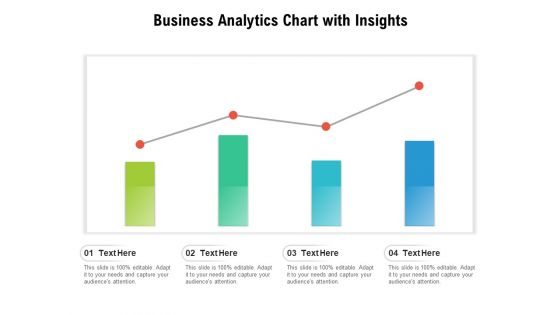
Business Analytics Chart With Insights Ppt PowerPoint Presentation Slides Guidelines PDF
Pitch your topic with ease and precision using this business analytics chart with insights ppt powerpoint presentation slides guidelines pdf. This layout presents information on business analytics chart with insights. It is also available for immediate download and adjustment. So, changes can be made in the color, design, graphics or any other component to create a unique layout.
Employee Presenting The Business Analytics Chart Ppt PowerPoint Presentation Model Layouts PDF
Pitch your topic with ease and precision using this employee presenting the business analytics chart ppt powerpoint presentation model layouts pdf. This layout presents information on employee presenting the business analytics chart. It is also available for immediate download and adjustment. So, changes can be made in the color, design, graphics or any other component to create a unique layout.
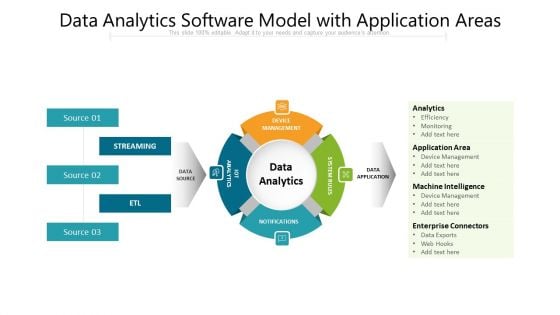
Data Analytics Software Model With Application Areas Ppt PowerPoint Presentation Inspiration Ideas PDF
Pitch your topic with ease and precision using this data analytics software model with application areas ppt powerpoint presentation inspiration ideas pdf. This layout presents information on device management, system rules, data analytics. It is also available for immediate download and adjustment. So, changes can be made in the color, design, graphics or any other component to create a unique layout.
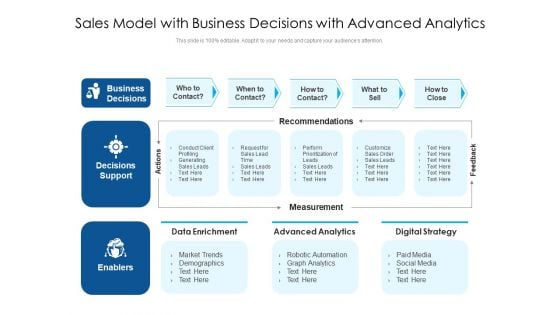
Sales Model With Business Decisions With Advanced Analytics Ppt PowerPoint Presentation Professional Slide PDF
Pitch your topic with ease and precision using this sales model with business decisions with advanced analytics ppt powerpoint presentation professional slide pdf. This layout presents information on data enrichment, advanced analytics, digital strategy. It is also available for immediate download and adjustment. So, changes can be made in the color, design, graphics or any other component to create a unique layout.

Why Invest With Us Financial Analytics Platform Investor Elevator Pitch Deck
This slide exhibits strengths and compelling reasons for investors to invest in company. It showcases benefits that the company possesses such as domain expertise, talented people, and support to provide an incredible customer experience. Are you in need of a template that can accommodate all of your creative concepts This one is crafted professionally and can be altered to fit any style. Use it with Google Slides or PowerPoint. Include striking photographs, symbols, depictions, and other visuals. Fill, move around, or remove text boxes as desired. Test out color palettes and font mixtures. Edit and save your work, or work with colleagues. Download Why Invest With Us Financial Analytics Platform Investor Elevator Pitch Deck and observe how to make your presentation outstanding. Give an impeccable presentation to your group and make your presentation unforgettable. This slide exhibits strengths and compelling reasons for investors to invest in company. It showcases benefits that the company possesses such as domain expertise, talented people, and support to provide an incredible customer experience.
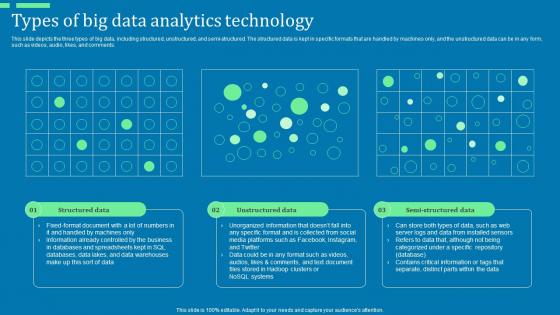
Types Of Big Data Analytics Technology Advanced Tools For Hyperautomation Ppt File Graphics Pictures Pdf
This slide depicts the three types of big data, including structured, unstructured, and semi-structured. The structured data is kept in specific formats that are handled by machines only, and the unstructured data can be in any form, such as videos, audio, likes, and comments. Make sure to capture your audiences attention in your business displays with our gratis customizable Types Of Big Data Analytics Technology Advanced Tools For Hyperautomation Ppt File Graphics Pictures Pdf. These are great for business strategies, office conferences, capital raising or task suggestions. If you desire to acquire more customers for your tech business and ensure they stay satisfied, create your own sales presentation with these plain slides. This slide depicts the three types of big data, including structured, unstructured, and semi-structured. The structured data is kept in specific formats that are handled by machines only, and the unstructured data can be in any form, such as videos, audio, likes, and comments.
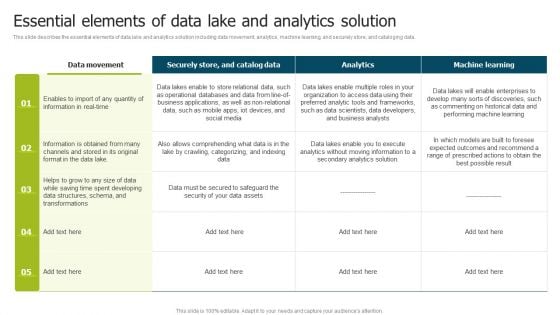
Data Lake Implementation Essential Elements Of Data Lake And Analytics Solution Brochure PDF
This slide describes the essential elements of data lake and analytics solution including data movement, analytics, machine learning, and securely store, and cataloging data. If you are looking for a format to display your unique thoughts, then the professionally designed Data Lake Implementation Essential Elements Of Data Lake And Analytics Solution Brochure PDF is the one for you. You can use it as a Google Slides template or a PowerPoint template. Incorporate impressive visuals, symbols, images, and other charts. Modify or reorganize the text boxes as you desire. Experiment with shade schemes and font pairings. Alter, share or cooperate with other people on your work. Download Data Lake Implementation Essential Elements Of Data Lake And Analytics Solution Brochure PDF and find out how to give a successful presentation. Present a perfect display to your team and make your presentation unforgettable.

Projection Model Difference Between Four Types Of Advanced Analytics Portrait PDF
This slide represents the difference between the main types of advanced analytics, and it includes diagnostic, descriptive, predictive, and prescriptive analytics. The four major categories of advanced analytics share certain commonalities but are distinguished mostly by their distinctions. Are you in need of a template that can accommodate all of your creative concepts This one is crafted professionally and can be altered to fit any style. Use it with Google Slides or PowerPoint. Include striking photographs, symbols, depictions, and other visuals. Fill, move around, or remove text boxes as desired. Test out color palettes and font mixtures. Edit and save your work, or work with colleagues. Download Projection Model Difference Between Four Types Of Advanced Analytics Portrait PDF and observe how to make your presentation outstanding. Give an impeccable presentation to your group and make your presentation unforgettable.
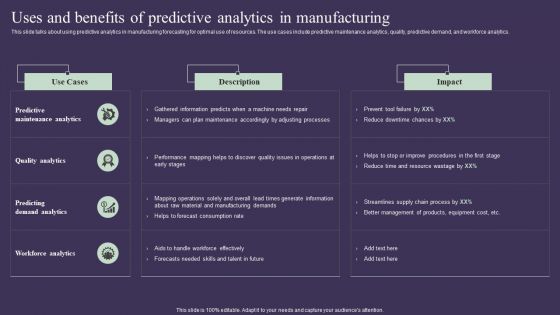
Projection Model Uses And Benefits Of Predictive Analytics In Manufacturing Topics PDF
This slide talks about using predictive analytics in manufacturing forecasting for optimal use of resources. The use cases include predictive maintenance analytics, quality, predictive demand, and workforce analytics. Are you in need of a template that can accommodate all of your creative concepts This one is crafted professionally and can be altered to fit any style. Use it with Google Slides or PowerPoint. Include striking photographs, symbols, depictions, and other visuals. Fill, move around, or remove text boxes as desired. Test out color palettes and font mixtures. Edit and save your work, or work with colleagues. Download Projection Model Uses And Benefits Of Predictive Analytics In Manufacturing Topics PDF and observe how to make your presentation outstanding. Give an impeccable presentation to your group and make your presentation unforgettable.
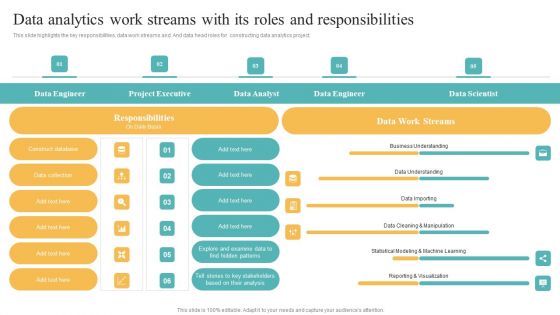
Data Analytics Work Streams With Its Roles And Responsibilities Graphics PDF
This slide highlights the key responsibilities, data work streams and. And data head roles for constructing data analytics project. Crafting an eye catching presentation has never been more straightforward. Let your presentation shine with this tasteful yet straightforward Data Analytics Work Streams With Its Roles And Responsibilities Graphics PDF template. It offers a minimalistic and classy look that is great for making a statement. The colors have been employed intelligently to add a bit of playfulness while still remaining professional. Construct the ideal Data Analytics Work Streams With Its Roles And Responsibilities Graphics PDF that effortlessly grabs the attention of your audience Begin now and be certain to wow your customers.
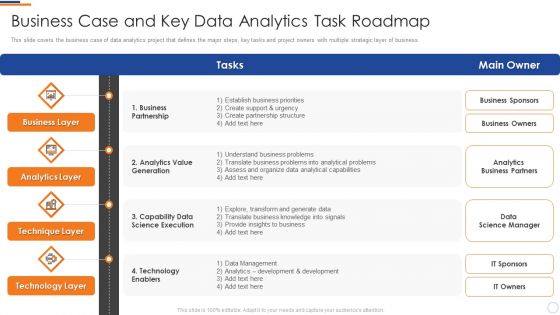
Business Intelligence And Big Business Case And Key Data Analytics Task Roadmap Graphics PDF
This slide covers the business case of data analytics project that defines the major steps, key tasks and project owners with multiple strategic layer of business. Deliver and pitch your topic in the best possible manner with this business intelligence and big business case and key data analytics task roadmap graphics pdf. Use them to share invaluable insights on business layer, analytics layer, technique layer, technology layer and impress your audience. This template can be altered and modified as per your expectations. So, grab it now.
Social Media Brand Promotion Instructions Playbook Google Analytics For All Web Tracking Graphics PDF
This template covers tools to measure marketing analytics such as google analytics for all web tracking, google data studio to build real-time reporting dashboards and google data studio reports.Deliver and pitch your topic in the best possible manner with this Social Media Brand Promotion Instructions Playbook Google Analytics For All Web Tracking Graphics PDF Use them to share invaluable insights on Demographics, Social Networks, Returning and impress your audience. This template can be altered and modified as per your expectations. So, grab it now.
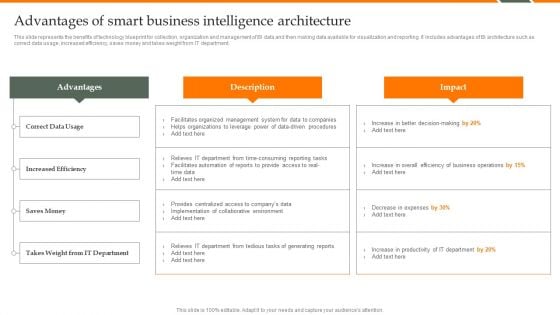
Human Resource Analytics Advantages Of Smart Business Intelligence Architecture Rules PDF
This slide represents the benefits of technology blueprint for collection, organization and management of BI data and then making data available for visualization and reporting. It includes advantages of BI architecture such as correct data usage, increased efficiency, saves money and takes weight from IT department. Take your projects to the next level with our ultimate collection of Human Resource Analytics Advantages Of Smart Business Intelligence Architecture Rules PDF. Slidegeeks has designed a range of layouts that are perfect for representing task or activity duration, keeping track of all your deadlines at a glance. Tailor these designs to your exact needs and give them a truly corporate look with your own brand colors theyll make your projects stand out from the rest.
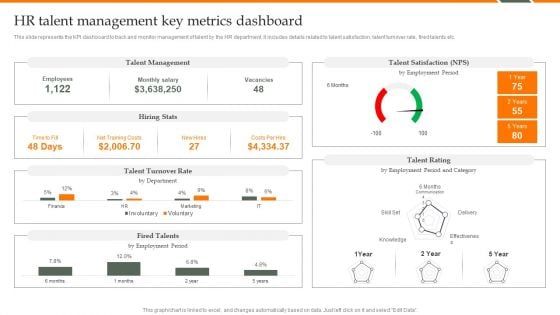
Human Resource Analytics HR Talent Management Key Metrics Dashboard Brochure PDF
This slide represents the KPI dashboard to track and monitor management of talent by the HR department. It includes details related to talent satisfaction, talent turnover rate, fired talents etc. Coming up with a presentation necessitates that the majority of the effort goes into the content and the message you intend to convey. The visuals of a PowerPoint presentation can only be effective if it supplements and supports the story that is being told. Keeping this in mind our experts created Human Resource Analytics HR Talent Management Key Metrics Dashboard Brochure PDF to reduce the time that goes into designing the presentation. This way, you can concentrate on the message while our designers take care of providing you with the right template for the situation.
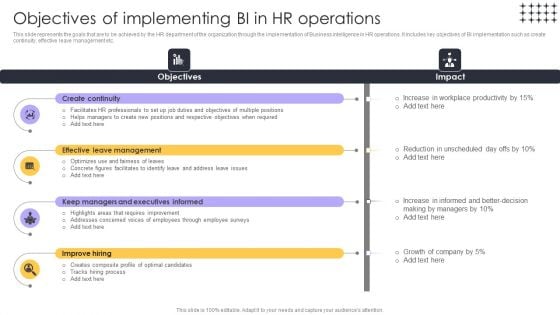
Tools For HR Business Analytics Objectives Of Implementing BI In HR Operations Clipart PDF
This slide represents the goals that are to be achieved by the HR department of the organization through the implementation of Business intelligence in HR operations. It includes key objectives of BI implementation such as create continuity, effective leave management etc. The Tools For HR Business Analytics Objectives Of Implementing BI In HR Operations Clipart PDF is a compilation of the most recent design trends as a series of slides. It is suitable for any subject or industry presentation, containing attractive visuals and photo spots for businesses to clearly express their messages. This template contains a variety of slides for the user to input data, such as structures to contrast two elements, bullet points, and slides for written information. Slidegeeks is prepared to create an impression.
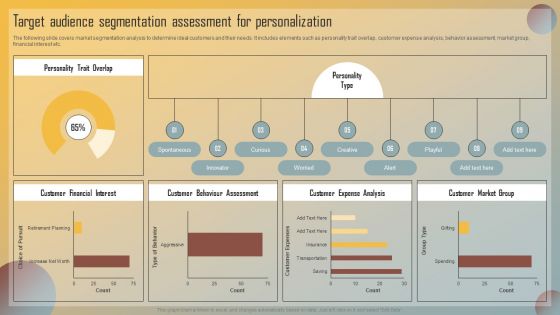
Guide For Marketing Analytics To Improve Decisions Target Audience Segmentation Assessment For Personalization Slides PDF
The following slide covers market segmentation analysis to determine ideal customers and their needs. It includes elements such as personality trait overlap, customer expense analysis, behavior assessment, market group, financial interest etc. The Guide For Marketing Analytics To Improve Decisions Target Audience Segmentation Assessment For Personalization Slides PDF is a compilation of the most recent design trends as a series of slides. It is suitable for any subject or industry presentation, containing attractive visuals and photo spots for businesses to clearly express their messages. This template contains a variety of slides for the user to input data, such as structures to contrast two elements, bullet points, and slides for written information. Slidegeeks is prepared to create an impression.
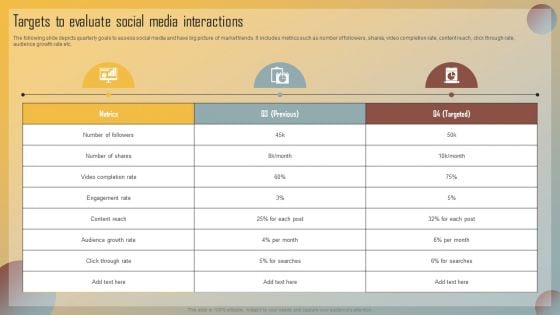
Guide For Marketing Analytics To Improve Decisions Targets To Evaluate Social Media Interactions Professional PDF
The following slide depicts quarterly goals to assess social media and have big picture of market trends. It includes metrics such as number of followers, shares, video completion rate, content reach, click through rate, audience growth rate etc. Coming up with a presentation necessitates that the majority of the effort goes into the content and the message you intend to convey. The visuals of a PowerPoint presentation can only be effective if it supplements and supports the story that is being told. Keeping this in mind our experts created Guide For Marketing Analytics To Improve Decisions Targets To Evaluate Social Media Interactions Professional PDF to reduce the time that goes into designing the presentation. This way, you can concentrate on the message while our designers take care of providing you with the right template for the situation.
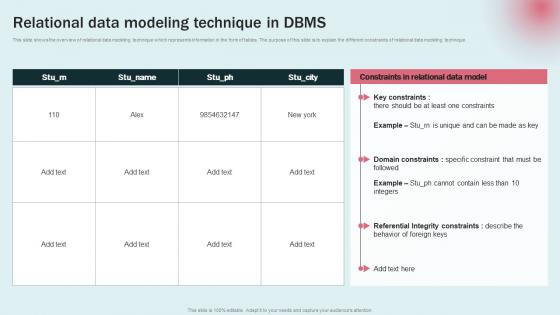
Relational Data Modeling Technique Data Modeling Approaches For Modern Analytics Information Pdf
This slide shows the overview of relational data modeling technique which represents information in the form of tables. The purpose of this slide is to explain the different constraints of relational data modeling technique. The best PPT templates are a great way to save time, energy, and resources. Slidegeeks have 100 percent editable powerpoint slides making them incredibly versatile. With these quality presentation templates, you can create a captivating and memorable presentation by combining visually appealing slides and effectively communicating your message. Download Relational Data Modeling Technique Data Modeling Approaches For Modern Analytics Information Pdf from Slidegeeks and deliver a wonderful presentation. This slide shows the overview of relational data modeling technique which represents information in the form of tables. The purpose of this slide is to explain the different constraints of relational data modeling technique.
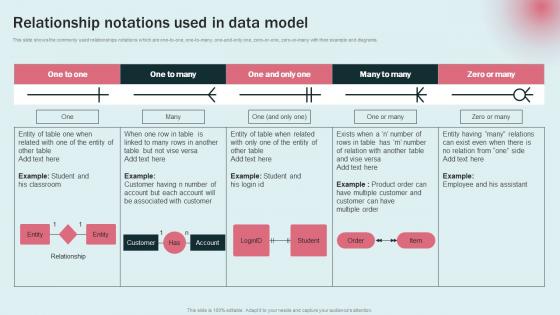
Relationship Notations Used Data Modeling Approaches For Modern Analytics Pictures Pdf
This slide shows the commonly used relationships notations which are one to one, one to many, one and only one, zero or one, zero or many with their example and diagrams. The Relationship Notations Used Data Modeling Approaches For Modern Analytics Pictures Pdf is a compilation of the most recent design trends as a series of slides. It is suitable for any subject or industry presentation, containing attractive visuals and photo spots for businesses to clearly express their messages. This template contains a variety of slides for the user to input data, such as structures to contrast two elements, bullet points, and slides for written information. Slidegeeks is prepared to create an impression. This slide shows the commonly used relationships notations which are one to one, one to many, one and only one, zero or one, zero or many with their example and diagrams.
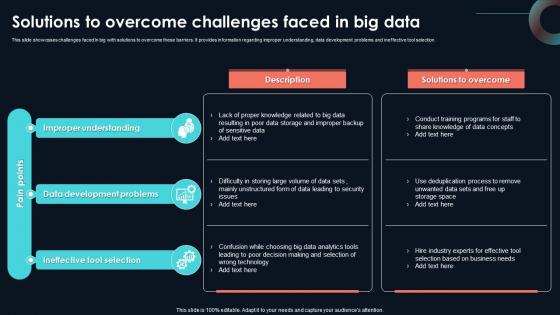
Solutions To Overcome Challenges Faced Developing Strategic Insights Using Big Data Analytics SS V
This slide showcases challenges faced In big with solutions to overcome these barriers. It provides information regarding improper understanding, data development problems and ineffective tool selection. The Solutions To Overcome Challenges Faced Developing Strategic Insights Using Big Data Analytics SS V is a compilation of the most recent design trends as a series of slides. It is suitable for any subject or industry presentation, containing attractive visuals and photo spots for businesses to clearly express their messages. This template contains a variety of slides for the user to input data, such as structures to contrast two elements, bullet points, and slides for written information. Slidegeeks is prepared to create an impression. This slide showcases challenges faced In big with solutions to overcome these barriers. It provides information regarding improper understanding, data development problems and ineffective tool selection.

Equity Asset Allocation Dashboard Analytics Strategic Investment Plan For Optimizing Risk SS V
This slide represents an equity asset allocation dashboard to measure and manage the performance of equity overtime. It tracks KPIs such as, average position size, market cap distribution, average PE distribution, ratio and yield, by geography, industry, currency and holding lists.If your project calls for a presentation, then Slidegeeks is your go-to partner because we have professionally designed, easy-to-edit templates that are perfect for any presentation. After downloading, you can easily edit Equity Asset Allocation Dashboard Analytics Strategic Investment Plan For Optimizing Risk SS V and make the changes accordingly. You can rearrange slides or fill them with different images. Check out all the handy templates This slide represents an equity asset allocation dashboard to measure and manage the performance of equity overtime. It tracks KPIs such as, average position size, market cap distribution, average PE distribution, ratio and yield, by geography, industry, currency and holding lists.
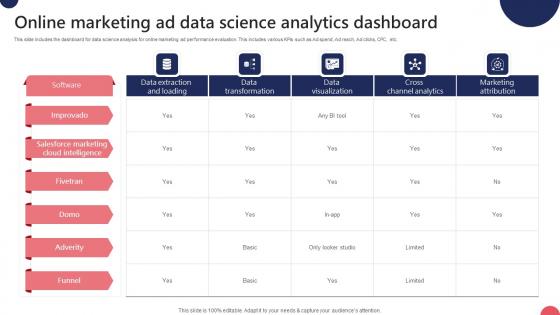
Online Marketing Ad Data Science Analytics Dashboard Ppt Inspiration Guidelines Pdf
This slide includes the dashboard for data science analysis for online marketing ad performance evaluation. This includes various KPIs such as Ad spend, Ad reach, Ad clicks, CPC, etc. Pitch your topic with ease and precision using this Online Marketing Ad Data Science Analytics Dashboard Ppt Inspiration Guidelines Pdf. This layout presents information on Ad Spend, Cost Per Thousand, Cost Per Click. It is also available for immediate download and adjustment. So, changes can be made in the color, design, graphics or any other component to create a unique layout. This slide includes the dashboard for data science analysis for online marketing ad performance evaluation. This includes various KPIs such as Ad spend, Ad reach, Ad clicks, CPC, etc.
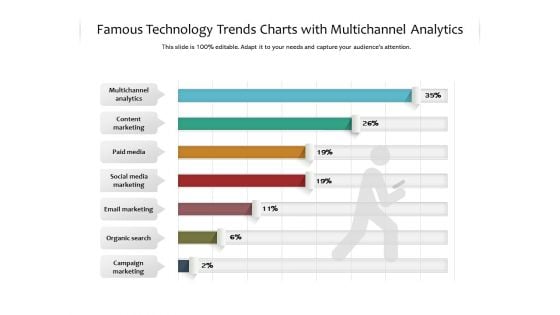
Famous Technology Trends Charts With Multichannel Analytics Ppt PowerPoint Presentation Ideas Graphics Tutorials PDF
Pitch your topic with ease and precision using this famous technology trends charts with multichannel analytics ppt powerpoint presentation ideas graphics tutorials pdf. This layout presents information on multichannel analytics, content marketing, paid media, social media marketing, email marketing . It is also available for immediate download and adjustment. So, changes can be made in the color, design, graphics or any other component to create a unique layout.
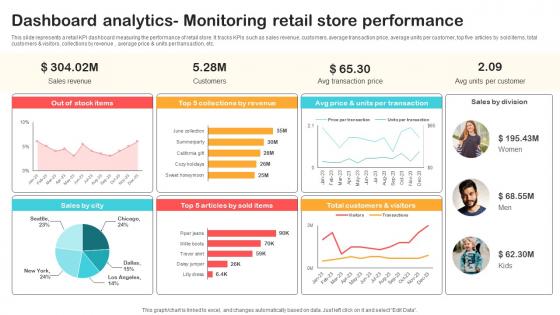
Dashboard Analytics Monitoring Retail Store Performance Optimizing Retail Operations With Digital DT SS V
This slide represents a retail KPI dashboard measuring the performance of retail store. It tracks KPIs such as sales revenue, customers, average transaction price, average units per customer, top five articles by sold items, total customers and visitors, collections by revenue , average price and units per transaction, etc.Are you in need of a template that can accommodate all of your creative concepts This one is crafted professionally and can be altered to fit any style. Use it with Google Slides or PowerPoint. Include striking photographs, symbols, depictions, and other visuals. Fill, move around, or remove text boxes as desired. Test out color palettes and font mixtures. Edit and save your work, or work with colleagues. Download Dashboard Analytics Monitoring Retail Store Performance Optimizing Retail Operations With Digital DT SS V and observe how to make your presentation outstanding. Give an impeccable presentation to your group and make your presentation unforgettable. This slide represents a retail KPI dashboard measuring the performance of retail store. It tracks KPIs such as sales revenue, customers, average transaction price, average units per customer, top five articles by sold items, total customers and visitors, collections by revenue , average price and units per transaction, etc.
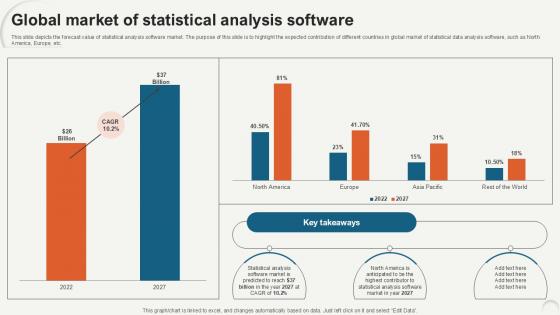
Global Market Of Statistical Data Analytics For Informed Decision Ppt PowerPoint
This slide depicts the forecast value of statistical analysis software market. The purpose of this slide is to highlight the expected contribution of different countries in global market of statistical data analysis software, such as North America, Europe, etc. Are you in need of a template that can accommodate all of your creative concepts This one is crafted professionally and can be altered to fit any style. Use it with Google Slides or PowerPoint. Include striking photographs, symbols, depictions, and other visuals. Fill, move around, or remove text boxes as desired. Test out color palettes and font mixtures. Edit and save your work, or work with colleagues. Download Global Market Of Statistical Data Analytics For Informed Decision Ppt PowerPoint and observe how to make your presentation outstanding. Give an impeccable presentation to your group and make your presentation unforgettable. This slide depicts the forecast value of statistical analysis software market. The purpose of this slide is to highlight the expected contribution of different countries in global market of statistical data analysis software, such as North America, Europe, etc.
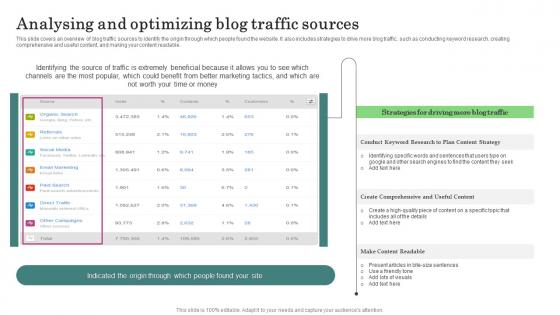
Analysing And Optimizing Blog Major Promotional Analytics Future Trends Inspiration Pdf
This slide covers an overview of blog traffic sources to identify the origin through which people found the website. It also includes strategies to drive more blog traffic, such as conducting keyword research, creating comprehensive and useful content, and making your content readable. This Analysing And Optimizing Blog Major Promotional Analytics Future Trends Inspiration Pdf from Slidegeeks makes it easy to present information on your topic with precision. It provides customization options, so you can make changes to the colors, design, graphics, or any other component to create a unique layout. It is also available for immediate download, so you can begin using it right away. Slidegeeks has done good research to ensure that you have everything you need to make your presentation stand out. Make a name out there for a brilliant performance. This slide covers an overview of blog traffic sources to identify the origin through which people found the website. It also includes strategies to drive more blog traffic, such as conducting keyword research, creating comprehensive and useful content, and making your content readable.
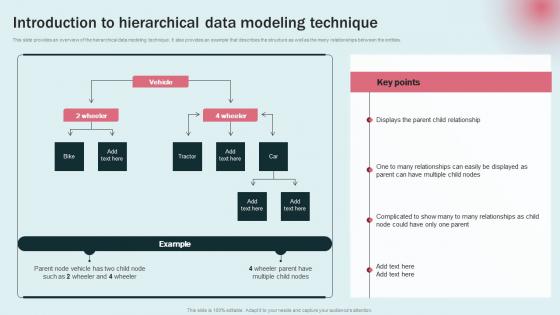
Introduction To Hierarchical Data Modeling Approaches For Modern Analytics Portrait Pdf
This slide provides an overview of the hierarchical data modeling technique. It also provides an example that describes the structure as well as the many relationships between the entities. Formulating a presentation can take up a lot of effort and time, so the content and message should always be the primary focus. The visuals of the PowerPoint can enhance the presenters message, so our Introduction To Hierarchical Data Modeling Approaches For Modern Analytics Portrait Pdf was created to help save time. Instead of worrying about the design, the presenter can concentrate on the message while our designers work on creating the ideal templates for whatever situation is needed. Slidegeeks has experts for everything from amazing designs to valuable content, we have put everything into Introduction To Hierarchical Data Modeling Approaches For Modern Analytics Portrait Pdf This slide provides an overview of the hierarchical data modeling technique. It also provides an example that describes the structure as well as the many relationships between the entities.
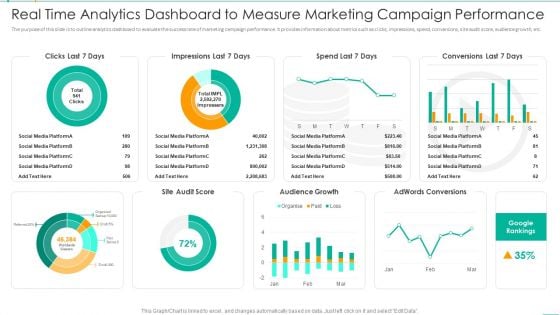
Real Time Analytics Dashboard To Measure Marketing Campaign Performance Information PDF
The purpose of this slide is to outline analytics dashboard to evaluate the success rate of marketing campaign performance. It provides information about metrics such as clicks, impressions, spend, conversions, site audit score, audience growth, etc. Pitch your topic with ease and precision using this Real Time Analytics Dashboard To Measure Marketing Campaign Performance Information PDF. This layout presents information on Real Time Analytics Dashboard To Measure Marketing Campaign Performance. It is also available for immediate download and adjustment. So, changes can be made in the color, design, graphics or any other component to create a unique layout.
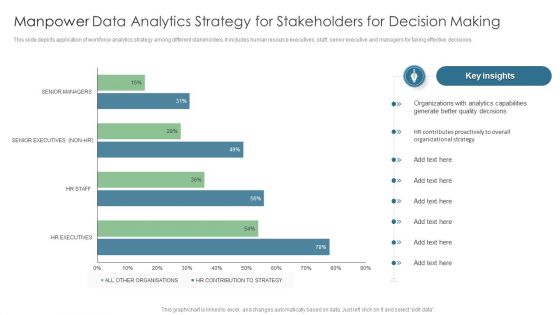
Manpower Data Analytics Strategy For Stakeholders For Decision Making Summary PDF
This slide depicts application of workforce analytics strategy among different stakeholders. It includes human resource executives, staff, senior executive and managers for taking effective decisions. Pitch your topic with ease and precision using this Manpower Data Analytics Strategy For Stakeholders For Decision Making Summary PDF. This layout presents information on Organizations, Analytics Capabilities, Generate Better Quality. It is also available for immediate download and adjustment. So, changes can be made in the color, design, graphics or any other component to create a unique layout.
Key Findings Of Consumer Intelligence Analytics Ppt PowerPoint Presentation Icon Model PDF
Following slide highlights consumer intelligence analytics findings that can be used by organization to understand individual customer needs and wants. Customer analytics findings include metrics such as customer name, tenure days, transaction usage, NPS, churn probability, churn prediction and required actions to be taken. Pitch your topic with ease and precision using this Key Findings Of Consumer Intelligence Analytics Ppt PowerPoint Presentation Icon Model PDF. This layout presents information on Customer, Tenure days, Transition Usage. It is also available for immediate download and adjustment. So, changes can be made in the color, design, graphics or any other component to create a unique layout.
Iot And Data Analytics Applications For In Agricultural Industry Value Chain Ppt Icon Shapes PDF
This slide covers applications for internet of things and predictive data analytics to improve quality of farming techniques and value chain. It includes elements such as technologies used comprising of big data, IOT, cloud computing, GPS system, remote sensing , etc. along with information required. Pitch your topic with ease and precision using this Iot And Data Analytics Applications For In Agricultural Industry Value Chain Ppt Icon Shapes PDF. This layout presents information on Technologies, Big Data Analytics, Cloud Computing. It is also available for immediate download and adjustment. So, changes can be made in the color, design, graphics or any other component to create a unique layout.
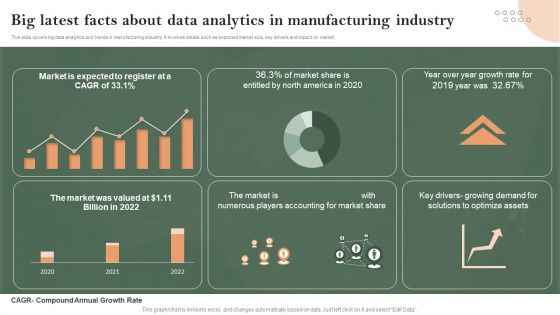
Big Latest Facts About Data Analytics In Manufacturing Industry Infographics PDF
This slide covers big data analytics and trends in manufacturing industry. It involves details such as expected market size, key drivers and impact on market. Pitch your topic with ease and precision using this Big Latest Facts About Data Analytics In Manufacturing Industry Infographics PDF. This layout presents information on Big Latest Facts, About Data Analytics, Manufacturing Industry. It is also available for immediate download and adjustment. So, changes can be made in the color, design, graphics or any other component to create a unique layout.
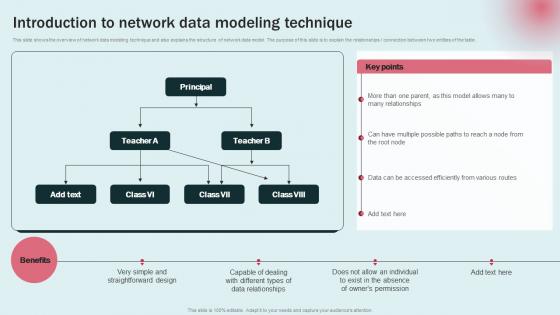
Data Modeling Approaches For Modern Analytics Introduction To Network Data Modeling Graphics Pdf
This slide shows the overview of network data modeling technique and also explains the structure of network data model. The purpose of this slide is to explain the relationships connection between two entities of the table. Slidegeeks is here to make your presentations a breeze with Data Modeling Approaches For Modern Analytics Introduction To Network Data Modeling Graphics Pdf With our easy to use and customizable templates, you can focus on delivering your ideas rather than worrying about formatting. With a variety of designs to choose from, you are sure to find one that suits your needs. And with animations and unique photos, illustrations, and fonts, you can make your presentation pop. So whether you are giving a sales pitch or presenting to the board, make sure to check out Slidegeeks first This slide shows the overview of network data modeling technique and also explains the structure of network data model. The purpose of this slide is to explain the relationships connection between two entities of the table.
Business Diagram Technology Predictive Data Analytics Networking Social Icons Ppt Slide
This technology diagram slide has been designed with graphic of data icons. These icons may be used to displays the data analytics and social media networking. Use this PPT slide for networking and technology related presentations.
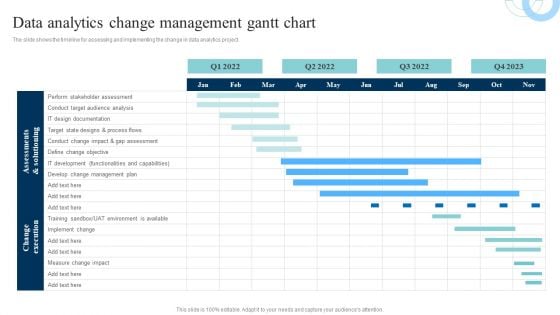
Data Evaluation And Processing Toolkit Data Analytics Change Management Gantt Chart Elements PDF
The slide shows the timeline for assessing and implementing the change in data analytics project. If your project calls for a presentation, then Slidegeeks is your go-to partner because we have professionally designed, easy-to-edit templates that are perfect for any presentation. After downloading, you can easily edit Data Evaluation And Processing Toolkit Data Analytics Change Management Gantt Chart Elements PDF and make the changes accordingly. You can rearrange slides or fill them with different images. Check out all the handy templates.
HR Services Icon With Analytics Technology And Charts Ppt PowerPoint Presentation Inspiration Format Ideas PDF
Pitch your topic with ease and precision using this hr services icon with analytics technology and charts ppt powerpoint presentation inspiration format ideas pdf. This layout presents information on hr services icon with analytics technology and charts. It is also available for immediate download and adjustment. So, changes can be made in the color, design, graphics or any other component to create a unique layout.
Icon For Customer Relation Management Lifecycle Process Data Analytics In CRM Portrait PDF
Pitch your topic with ease and precision using this Icon For Customer Relation Management Lifecycle Process Data Analytics In CRM Portrait PDF. This layout presents information on Icon For Customer Relation Management Lifecycle Process Data Analytics In CRM. It is also available for immediate download and adjustment. So, changes can be made in the color, design, graphics or any other component to create a unique layout.

Customer Relationship Management Lifecycle Analytics Dashboard With Sales Record Brochure PDF
This slide signifies the customer relationship management analytics dashboard. It covers information about sales record by different representative, total products sold, sales by different month, etc.Pitch your topic with ease and precision using this Customer Relationship Management Lifecycle Analytics Dashboard With Sales Record Brochure PDF. This layout presents information on Sales Record, Representative, Total Items. It is also available for immediate download and adjustment. So, changes can be made in the color, design, graphics or any other component to create a unique layout.
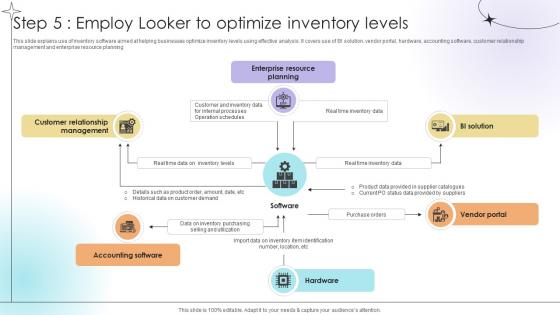
Step 5 Employ Looker To Optimize Inventory Levels Data Analytics SS V
This slide explains use of inventory software aimed at helping businesses optimize inventory levels using effective analysis. It covers use of BI solution, vendor portal, hardware, accounting software, customer relationship management and enterprise resource planning.This modern and well-arranged Step 5 Employ Looker To Optimize Inventory Levels Data Analytics SS V provides lots of creative possibilities. It is very simple to customize and edit with the Powerpoint Software. Just drag and drop your pictures into the shapes. All facets of this template can be edited with Powerpoint, no extra software is necessary. Add your own material, put your images in the places assigned for them, adjust the colors, and then you can show your slides to the world, with an animated slide included. This slide explains use of inventory software aimed at helping businesses optimize inventory levels using effective analysis. It covers use of BI solution, vendor portal, hardware, accounting software, customer relationship management and enterprise resource planning.
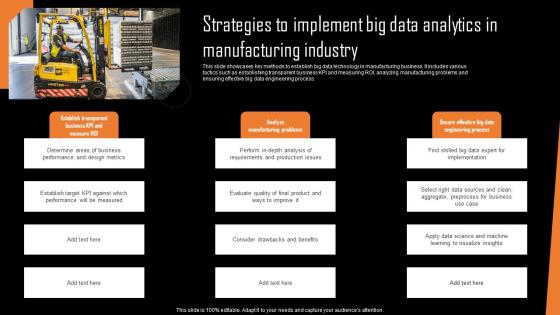
Strategies To Implement Big Data Analytics In Manufacturing Industry Portrait Pdf
This slide showcases key methods to establish big data technology in manufacturing business. It includes various tactics such as establishing transparent business KPI and measuring ROI, analyzing manufacturing problems and ensuring effective big data engineering process.Pitch your topic with ease and precision using this Strategies To Implement Big Data Analytics In Manufacturing Industry Portrait Pdf This layout presents information on Determine Areas, Performance Design Metrics, Performance Measured It is also available for immediate download and adjustment. So, changes can be made in the color, design, graphics or any other component to create a unique layout. This slide showcases key methods to establish big data technology in manufacturing business. It includes various tactics such as establishing transparent business KPI and measuring ROI, analyzing manufacturing problems and ensuring effective big data engineering process.

Statistical Analysis Software Features Data Analytics For Informed Decision Ppt Presentation
The purpose of this slide is to outline the different software used to perform statistical analysis. This slide represents the primary features and benefits of various statistical software available in the market. This Statistical Analysis Software Features Data Analytics For Informed Decision Ppt Presentation from Slidegeeks makes it easy to present information on your topic with precision. It provides customization options, so you can make changes to the colors, design, graphics, or any other component to create a unique layout. It is also available for immediate download, so you can begin using it right away. Slidegeeks has done good research to ensure that you have everything you need to make your presentation stand out. Make a name out there for a brilliant performance. The purpose of this slide is to outline the different software used to perform statistical analysis. This slide represents the primary features and benefits of various statistical software available in the market.
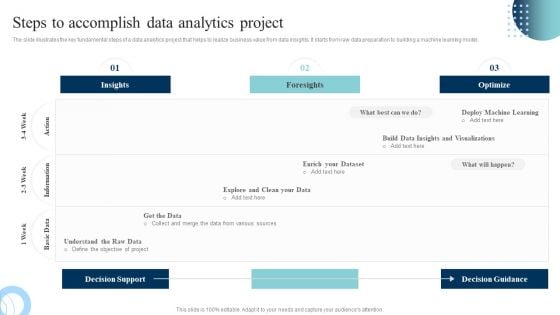
Data Evaluation And Processing Toolkit Steps To Accomplish Data Analytics Project Structure PDF
The slide illustrates the key fundamental steps of a data analytics project that helps to realize business value from data insights. It starts from raw data preparation to building a machine learning model. If you are looking for a format to display your unique thoughts, then the professionally designed Data Evaluation And Processing Toolkit Steps To Accomplish Data Analytics Project Structure PDF is the one for you. You can use it as a Google Slides template or a PowerPoint template. Incorporate impressive visuals, symbols, images, and other charts. Modify or reorganize the text boxes as you desire. Experiment with shade schemes and font pairings. Alter, share or cooperate with other people on your work. Download Data Evaluation And Processing Toolkit Steps To Accomplish Data Analytics Project Structure PDF and find out how to give a successful presentation. Present a perfect display to your team and make your presentation unforgettable.
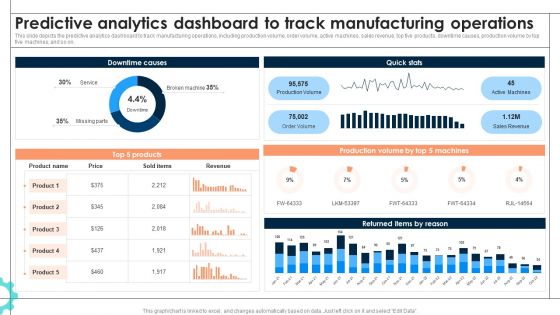
Intelligent Manufacturing Predictive Analytics Dashboard To Track Manufacturing Operations Information PDF
This slide depicts the predictive analytics dashboard to track manufacturing operations, including production volume, order volume, active machines, sales revenue, top five products, downtime causes, production volume by top five machines, and so on. If you are looking for a format to display your unique thoughts, then the professionally designed Intelligent Manufacturing Predictive Analytics Dashboard To Track Manufacturing Operations Information PDF is the one for you. You can use it as a Google Slides template or a PowerPoint template. Incorporate impressive visuals, symbols, images, and other charts. Modify or reorganize the text boxes as you desire. Experiment with shade schemes and font pairings. Alter, share or cooperate with other people on your work. Download Intelligent Manufacturing Predictive Analytics Dashboard To Track Manufacturing Operations Information PDF and find out how to give a successful presentation. Present a perfect display to your team and make your presentation unforgettable.
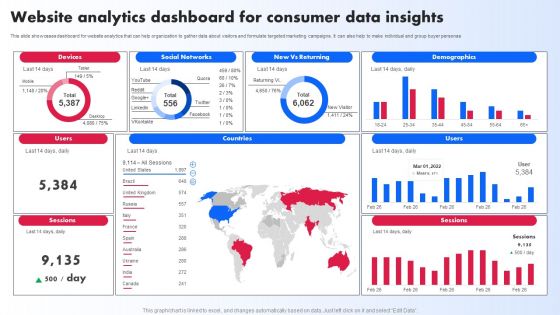
Website Analytics Dashboard For Consumer Data Insights Ppt PowerPoint Presentation File Slides PDF
This slide showcases dashboard for website analytics that can help organization to gather data about visitors and formulate targeted marketing campaigns. It can also help to make individual and group buyer personas. If you are looking for a format to display your unique thoughts, then the professionally designed Website Analytics Dashboard For Consumer Data Insights Ppt PowerPoint Presentation File Slides PDF is the one for you. You can use it as a Google Slides template or a PowerPoint template. Incorporate impressive visuals, symbols, images, and other charts. Modify or reorganize the text boxes as you desire. Experiment with shade schemes and font pairings. Alter, share or cooperate with other people on your work. Download Website Analytics Dashboard For Consumer Data Insights Ppt PowerPoint Presentation File Slides PDF and find out how to give a successful presentation. Present a perfect display to your team and make your presentation unforgettable.
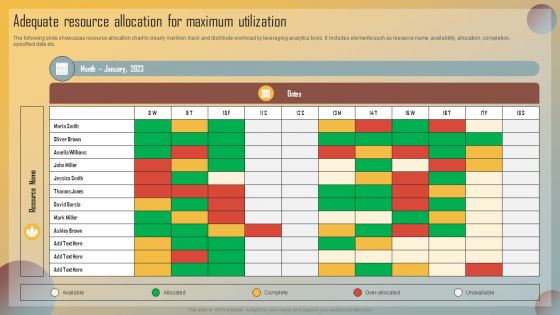
Guide For Marketing Analytics To Improve Decisions Adequate Resource Allocation For Maximum Utilization Download PDF
The following slide showcases resource allocation chart to clearly mention, track and distribute workload by leveraging analytics tools. It includes elements such as resource name, availability, allocation, completion, specified date etc. If you are looking for a format to display your unique thoughts, then the professionally designed Guide For Marketing Analytics To Improve Decisions Adequate Resource Allocation For Maximum Utilization Download PDF is the one for you. You can use it as a Google Slides template or a PowerPoint template. Incorporate impressive visuals, symbols, images, and other charts. Modify or reorganize the text boxes as you desire. Experiment with shade schemes and font pairings. Alter, share or cooperate with other people on your work. Download Guide For Marketing Analytics To Improve Decisions Adequate Resource Allocation For Maximum Utilization Download PDF and find out how to give a successful presentation. Present a perfect display to your team and make your presentation unforgettable.
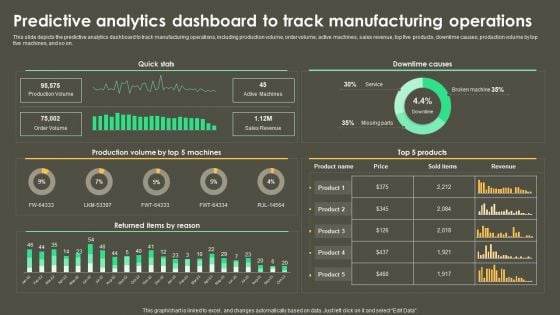
Iot Integration In Manufacturing Predictive Analytics Dashboard To Track Manufacturing Operations Background PDF
This slide depicts the predictive analytics dashboard to track manufacturing operations, including production volume, order volume, active machines, sales revenue, top five products, downtime causes, production volume by top five machines, and so on. If you are looking for a format to display your unique thoughts, then the professionally designed Iot Integration In Manufacturing Predictive Analytics Dashboard To Track Manufacturing Operations Background PDF is the one for you. You can use it as a Google Slides template or a PowerPoint template. Incorporate impressive visuals, symbols, images, and other charts. Modify or reorganize the text boxes as you desire. Experiment with shade schemes and font pairings. Alter, share or cooperate with other people on your work. Download Iot Integration In Manufacturing Predictive Analytics Dashboard To Track Manufacturing Operations Background PDF and find out how to give a successful presentation. Present a perfect display to your team and make your presentation unforgettable.
BI Technique For Data Informed Decisions Global Market Landscape Of Sap Analytics Cloud Suite Icons PDF
The purpose of this slide is to showcase the global market landscape of SAP analytics cloud as BI tool. It also contains information regarding the business intelligence BI software market share and SAP analytics cloud customers by industry. Are you in need of a template that can accommodate all of your creative concepts This one is crafted professionally and can be altered to fit any style. Use it with Google Slides or PowerPoint. Include striking photographs, symbols, depictions, and other visuals. Fill, move around, or remove text boxes as desired. Test out color palettes and font mixtures. Edit and save your work, or work with colleagues. Download BI Technique For Data Informed Decisions Global Market Landscape Of Sap Analytics Cloud Suite Icons PDF and observe how to make your presentation outstanding. Give an impeccable presentation to your group and make your presentation unforgettable.
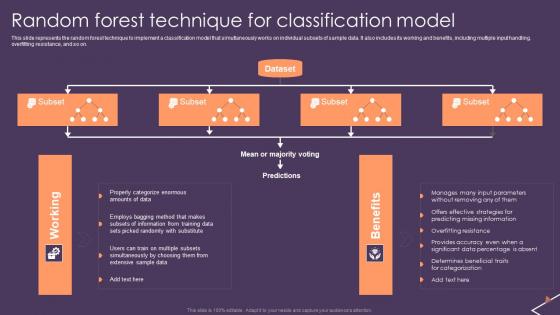
Predictive Analytics For Empowering Random Forest Technique For Classification Model Guidelines Pdf
This slide represents the random forest technique to implement a classification model that simultaneously works on individual subsets of sample data. It also includes its working and benefits, including multiple input handling, overfitting resistance, and so on. This Predictive Analytics For Empowering Random Forest Technique For Classification Model Guidelines Pdf from Slidegeeks makes it easy to present information on your topic with precision. It provides customization options, so you can make changes to the colors, design, graphics, or any other component to create a unique layout. It is also available for immediate download, so you can begin using it right away. Slidegeeks has done good research to ensure that you have everything you need to make your presentation stand out. Make a name out there for a brilliant performance. This slide represents the random forest technique to implement a classification model that simultaneously works on individual subsets of sample data. It also includes its working and benefits, including multiple input handling, overfitting resistance, and so on.
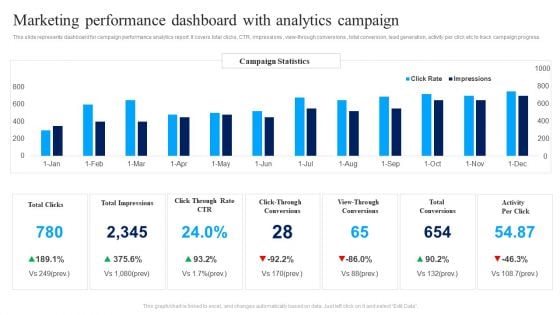
Marketing Performance Dashboard With Analytics Campaign Ppt Infographics Background Images PDF
This slide represents dashboard for campaign performance analytics report. It covers total clicks, CTR, impressions , view-through conversions , total conversion, lead generation, activity per click etc to track campaign progress. Showcasing this set of slides titled Marketing Performance Dashboard With Analytics Campaign Ppt Infographics Background Images PDF. The topics addressed in these templates are Total Clicks, Total Impressions, Total Conversions, Activity Per Click. All the content presented in this PPT design is completely editable. Download it and make adjustments in color, background, font etc. as per your unique business setting.
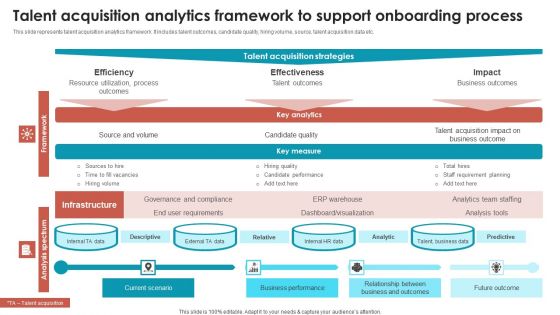
Talent Management Optimization With Workforce Staffing Talent Acquisition Analytics Framework Graphics PDF
This slide represents talent acquisition analytics framework. It includes talent outcomes, candidate quality, hiring volume, source, talent acquisition data etc. This modern and well arranged Talent Management Optimization With Workforce Staffing Talent Acquisition Analytics Framework Graphics PDF provides lots of creative possibilities. It is very simple to customize and edit with the Powerpoint Software. Just drag and drop your pictures into the shapes. All facets of this template can be edited with Powerpoint no extra software is necessary. Add your own material, put your images in the places assigned for them, adjust the colors, and then you can show your slides to the world, with an animated slide included.
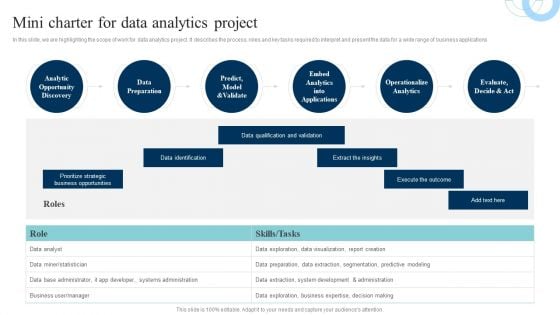
Data Evaluation And Processing Toolkit Mini Charter For Data Analytics Project Graphics PDF
In this slide, we are highlighting the scope of work for data analytics project. It describes the process, roles and key tasks required to interpret and present the data for a wide range of business applications. Do you have to make sure that everyone on your team knows about any specific topic I yes, then you should give Data Evaluation And Processing Toolkit Mini Charter For Data Analytics Project Graphics PDF a try. Our experts have put a lot of knowledge and effort into creating this impeccable Data Evaluation And Processing Toolkit Mini Charter For Data Analytics Project Graphics PDF. You can use this template for your upcoming presentations, as the slides are perfect to represent even the tiniest detail. You can download these templates from the Slidegeeks website and these are easy to edit. So grab these today.
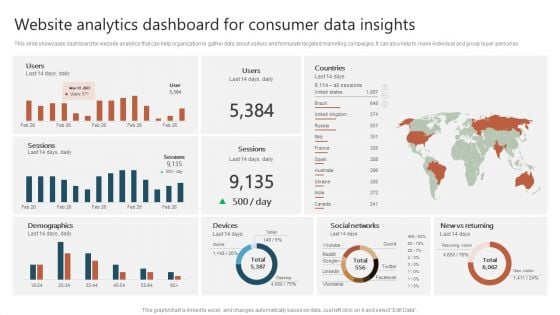
Website Analytics Dashboard For Consumer Data Insights Ppt Show Graphics Download PDF
This slide showcases dashboard for website analytics that can help organization to gather data about visitors and formulate targeted marketing campaigns. It can also help to make individual and group buyer personas. Crafting an eye catching presentation has never been more straightforward. Let your presentation shine with this tasteful yet straightforward Website Analytics Dashboard For Consumer Data Insights Ppt Show Graphics Download PDF template. It offers a minimalistic and classy look that is great for making a statement. The colors have been employed intelligently to add a bit of playfulness while still remaining professional. Construct the ideal Website Analytics Dashboard For Consumer Data Insights Ppt Show Graphics Download PDF that effortlessly grabs the attention of your audience Begin now and be certain to wow your customers.
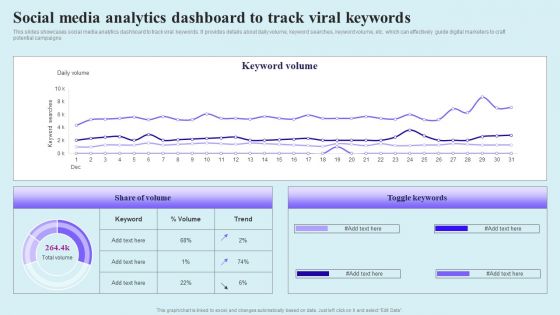
Go Viral Campaign Strategies To Increase Engagement Social Media Analytics Dashboard Track Viral Graphics PDF
This slides showcases social media analytics dashboard to track viral keywords. It provides details about daily volume, keyword searches, keyword volume, etc. which can effectively guide digital marketers to craft potential campaigns Are you searching for a Go Viral Campaign Strategies To Increase Engagement Social Media Analytics Dashboard Track Viral Graphics PDF that is uncluttered, straightforward, and original Its easy to edit, and you can change the colors to suit your personal or business branding. For a presentation that expresses how much effort you have put in, this template is ideal. With all of its features, including tables, diagrams, statistics, and lists, its perfect for a business plan presentation. Make your ideas more appealing with these professional slides. Download Go Viral Campaign Strategies To Increase Engagement Social Media Analytics Dashboard Track Viral Graphics PDF from Slidegeeks today.
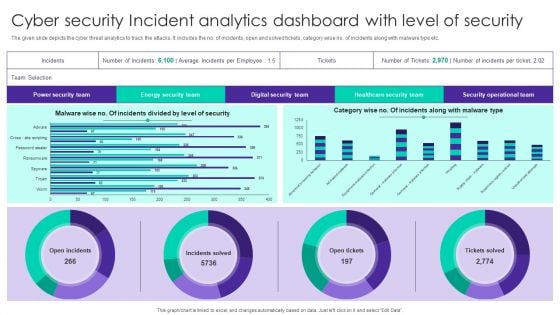
Cyber Security Incident Analytics Dashboard With Level Of Security Ppt Ideas Graphics Tutorials PDF
The given slide depicts the cyber threat analytics to track the attacks. It includes the no. of incidents, open and solved tickets, category wise no. of incidents along with malware type etc. Pitch your topic with ease and precision using this Cyber Security Incident Analytics Dashboard With Level Of Security Ppt Ideas Graphics Tutorials PDF. This layout presents information on Power Security Team, Open Incidents, Incidents Solved, Open Tickets. It is also available for immediate download and adjustment. So, changes can be made in the color, design, graphics or any other component to create a unique layout.
Icons Slide Tools For HR Business Analytics Application In HR Ppt Professional Images PDF
Presenting our innovatively structured Icons Slide Tools For HR Business Analytics Application In HR Ppt Professional Images PDF set of slides. The slides contain a hundred percent editable icons. You can replace these icons without any inconvenience. Therefore, pick this set of slides and create a striking presentation.
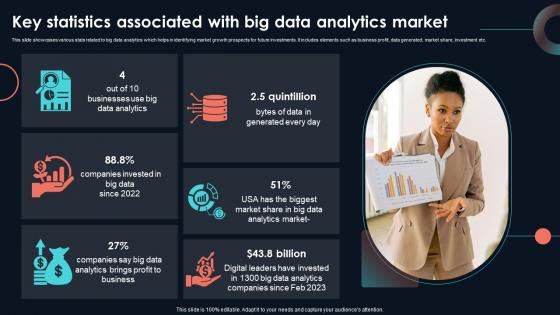
Key Statistics Associated With Big Data Developing Strategic Insights Using Big Data Analytics SS V
This slide showcases various stats related to big data analytics which helps in identifying market growth prospects for future investments. It includes elements such as business profit, data generated, market share, investment etc. If you are looking for a format to display your unique thoughts, then the professionally designed Key Statistics Associated With Big Data Developing Strategic Insights Using Big Data Analytics SS V is the one for you. You can use it as a Google Slides template or a PowerPoint template. Incorporate impressive visuals, symbols, images, and other charts. Modify or reorganize the text boxes as you desire. Experiment with shade schemes and font pairings. Alter, share or cooperate with other people on your work. Download Key Statistics Associated With Big Data Developing Strategic Insights Using Big Data Analytics SS V and find out how to give a successful presentation. Present a perfect display to your team and make your presentation unforgettable. This slide showcases various stats related to big data analytics which helps in identifying market growth prospects for future investments. It includes elements such as business profit, data generated, market share, investment etc.


 Continue with Email

 Home
Home


