Visual Analytics
Big Data Analytics Framework Ppt PowerPoint Presentation Complete Deck With Slides
Big Data Analytics Procedure Ppt PowerPoint Presentation Complete Deck With Slides
Improve your presentation delivery using this Big Data Analytics Procedure Ppt PowerPoint Presentation Complete Deck With Slides. Support your business vision and objectives using this well-structured PPT deck. This template offers a great starting point for delivering beautifully designed presentations on the topic of your choice. Comprising twenty this professionally designed template is all you need to host discussion and meetings with collaborators. Each slide is self-explanatory and equipped with high-quality graphics that can be adjusted to your needs. Therefore, you will face no difficulty in portraying your desired content using this PPT slideshow. This PowerPoint slideshow contains every important element that you need for a great pitch. It is not only editable but also available for immediate download and utilization. The color, font size, background, shapes everything can be modified to create your unique presentation layout. Therefore, download it now.
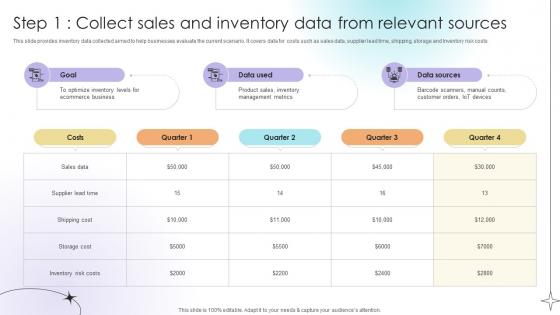
Step 1 Collect Sales And Inventory Data From Relevant Sources Data Analytics SS V
This slide provides inventory data collected aimed to help businesses evaluate the current scenario. It covers data for costs such as sales data, supplier lead time, shipping, storage and Inventory risk costs.Are you in need of a template that can accommodate all of your creative concepts This one is crafted professionally and can be altered to fit any style. Use it with Google Slides or PowerPoint. Include striking photographs, symbols, depictions, and other visuals. Fill, move around, or remove text boxes as desired. Test out color palettes and font mixtures. Edit and save your work, or work with colleagues. Download Step 1 Collect Sales And Inventory Data From Relevant Sources Data Analytics SS V and observe how to make your presentation outstanding. Give an impeccable presentation to your group and make your presentation unforgettable. This slide provides inventory data collected aimed to help businesses evaluate the current scenario. It covers data for costs such as sales data, supplier lead time, shipping, storage and Inventory risk costs.
1 Big Data Technology Icons Analytics Storage Replication Dashboard Magnify Ppt Slide
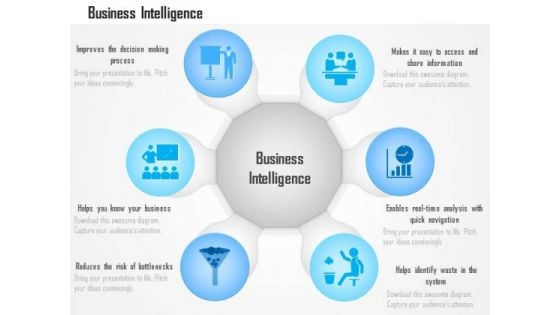
Business Diagram Benefits Advantages Of Business Intelligence Data Analytics Ppt Slide
This technology diagram has been designed with graphic of circular chart with various icons. This slide contains the concept of business intelligence data analytics. Explain advantages of business intelligence in any technical presentations with this quality diagram.
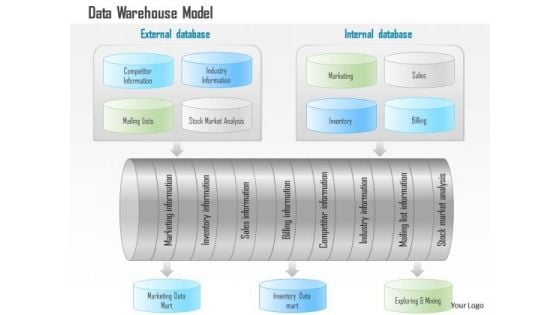
Business Diagram Data Warehouse Model With Analytics And Business Intelligence Ppt Slide
This technology diagram has been designed with graphic of data warehouse model. This model depicts concept of business intelligence and analysis. Download this editable slide build an exclusive presentation.

Executing Advance Data Analytics At Workspace Ppt PowerPoint Presentation Complete Deck With Slides
This complete deck acts as a great communication tool. It helps you in conveying your business message with personalized sets of graphics, icons etc. Comprising a set of seventy three slides, this complete deck can help you persuade your audience. It also induces strategic thinking as it has been thoroughly researched and put together by our experts. Not only is it easily downloadable but also editable. The color, graphics, theme any component can be altered to fit your individual needs. So grab it now.

Business Intelligence And Big Data Analytics Transformation Toolkit Ppt PowerPoint Presentation Complete Deck With Slides
This complete deck acts as a great communication tool. It helps you in conveying your business message with personalized sets of graphics, icons etc. Comprising a set of ninety five slides, this complete deck can help you persuade your audience. It also induces strategic thinking as it has been thoroughly researched and put together by our experts. Not only is it easily downloadable but also editable. The color, graphics, theme any component can be altered to fit your individual needs. So grab it now.

Oracle Cloud Data Analytics Administration IT Ppt PowerPoint Presentation Complete Deck With Slides
Induce strategic thinking by presenting this complete deck. Enthrall your audience by deploying this thought provoking PPT deck. It can be downloaded in both standard and widescreen aspect ratios, thus making it a complete package to use and deploy. Convey your thoughts and actions using the sixty three slides presented in this complete deck. Additionally, feel free to alter its components like color, graphics, design, etc, to create a great first impression. Grab it now by clicking on the download button below.

Developing Business Analytics Framework Ppt PowerPoint Presentation Complete Deck With Slides
Induce strategic thinking by presenting this complete deck. Enthrall your audience by deploying this thought provoking PPT deck. It can be downloaded in both standard and widescreen aspect ratios, thus making it a complete package to use and deploy. Convey your thoughts and actions using the seventy one slides presented in this complete deck. Additionally, feel free to alter its components like color, graphics, design, etc, to create a great first impression. Grab it now by clicking on the download button below.

Distributor Profile For Data Analytics Software Ppt PowerPoint Presentation Complete Deck With Slides
Induce strategic thinking by presenting this complete deck. Enthrall your audience by deploying this thought provoking PPT deck. It can be downloaded in both standard and widescreen aspect ratios, thus making it a complete package to use and deploy. Convey your thoughts and actions using the fourteen slides presented in this complete deck. Additionally, feel free to alter its components like color, graphics, design, etc, to create a great first impression. Grab it now by clicking on the download button below.

Data Analytics Program Checklist Ppt PowerPoint Presentation Complete Deck With Slides
Induce strategic thinking by presenting this complete deck. Enthrall your audience by deploying this thought provoking PPT deck. It can be downloaded in both standard and widescreen aspect ratios, thus making it a complete package to use and deploy. Convey your thoughts and actions using the fourteen slides presented in this complete deck. Additionally, feel free to alter its components like color, graphics, design, etc, to create a great first impression. Grab it now by clicking on the download button below.

Information Analytics And Ml Strategy Playbook Ppt PowerPoint Presentation Complete With Slides
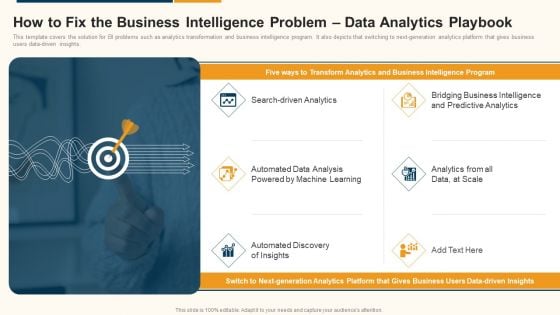
Data Interpretation And Analysis Playbook How To Fix The Business Intelligence Problem Data Analytics Playbook Sample PDF
This template covers the solution for BI problems such as analytics transformation and business intelligence program. It also depicts that switching to next-generation analytics platform that gives business users data-driven insights. Presenting data interpretation and analysis playbook how to fix the business intelligence problem data analytics playbook sample pdf to provide visual cues and insights. Share and navigate important information on six stages that need your due attention. This template can be used to pitch topics like analytics, business intelligence, predictive analytics. In addtion, this PPT design contains high resolution images, graphics, etc, that are easily editable and available for immediate download.
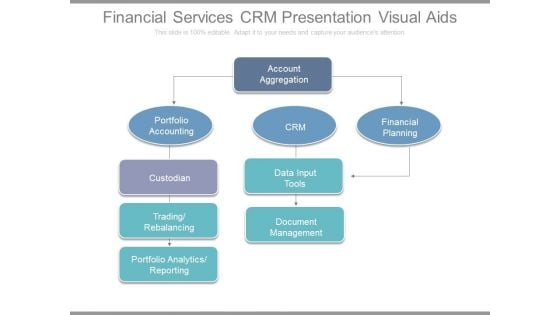
Financial Services Crm Presentation Visual Aids
This is a financial services crm presentation visual aids. This is a five stage process. The stages in this process are account aggregation, financial planning, crm, data input tools, document management, portfolio accounting, custodian, trading rebalancing, portfolio analytics reporting.
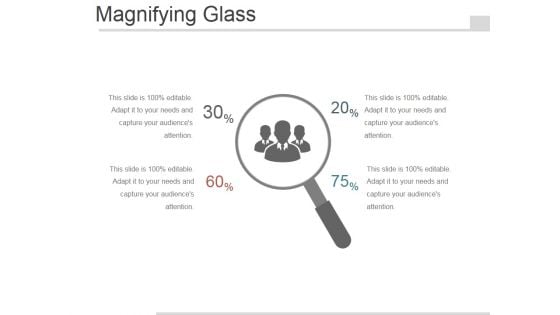
Magnifying Glass Ppt PowerPoint Presentation Visual Aids
This is a magnifying glass ppt powerpoint presentation visual aids. This is a two stage process. The stages in this process are management, magnifying glass, business, marketing.
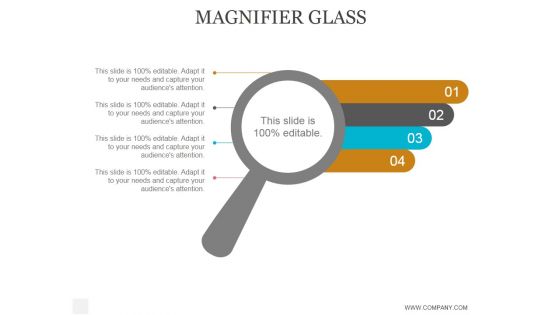
Magnifier Glass Ppt PowerPoint Presentation Visual Aids
This is a magnifier glass ppt powerpoint presentation visual aids. This is a four stage process. The stages in this process are business, strategy, marketing, analysis, success, magnifier glass.
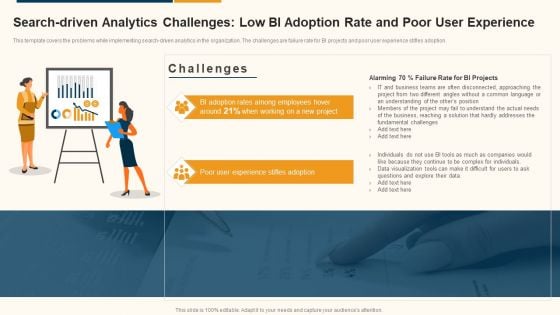
Data Interpretation And Analysis Playbook Search Driven Analytics Challenges Low Bi Adoption Rate And Poor Demonstration PDF
This template covers the problems while implementing search-driven analytics in the organization. The challenges are failure rate for BI projects and poor user experience stifles adoption. Presenting data interpretation and analysis playbook search driven analytics challenges low bi adoption rate and poor demonstration pdf to provide visual cues and insights. Share and navigate important information on two stages that need your due attention. This template can be used to pitch topics like business, data visualization, fundamental challenges. In addtion, this PPT design contains high resolution images, graphics, etc, that are easily editable and available for immediate download.
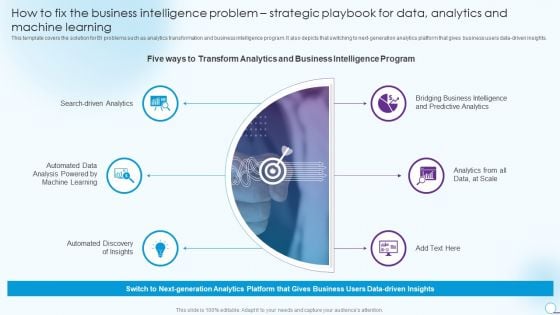
How To Fix The Business Intelligence Problem Strategic Playbook For Data Analytics And Machine Learning Designs PDF
This template covers the solution for BI problems such as analytics transformation and business intelligence program. It also depicts that switching to next generation analytics platform that gives business users data driven insights. This is a How To Fix The Business Intelligence Problem Strategic Playbook For Data Analytics And Machine Learning Designs PDF template with various stages. Focus and dispense information on six stages using this creative set, that comes with editable features. It contains large content boxes to add your information on topics like Automated Data Analysis, Search Driven Analytics, Predictive Analytics. You can also showcase facts, figures, and other relevant content using this PPT layout. Grab it now.
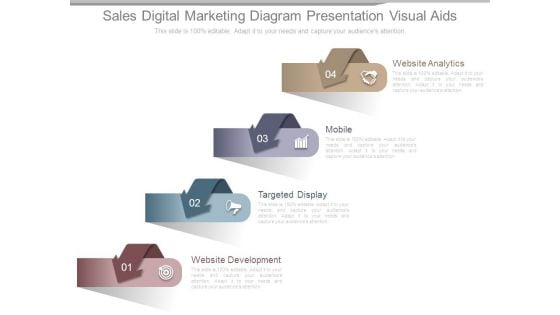
Sales Digital Marketing Diagram Presentation Visual Aids
This is a sales digital marketing diagram presentation visual aids. This is a four stage process. The stages in this process are website analytics, mobile, targeted display, website development.
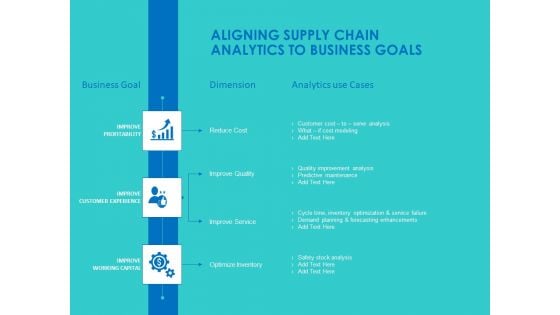
Modifying Supply Chain Digitally Aligning Supply Chain Analytics To Business Goals Ppt PowerPoint Presentation Summary Graphics Tutorials PDF
Presenting this set of slides with name modifying supply chain digitally aligning supply chain analytics to business goals ppt powerpoint presentation summary graphics tutorials pdf. This is a three stage process. The stages in this process are business goal, dimension, analytics use cases, reduce cost, improve quality, improve service, optimize inventory. This is a completely editable PowerPoint presentation and is available for immediate download. Download now and impress your audience.
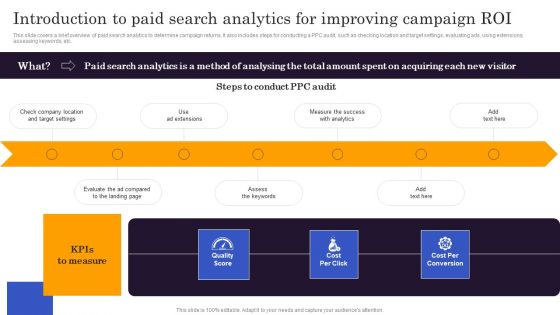
Marketers Guide To Data Analysis Optimization Introduction To Paid Search Analytics For Improving Campaign Roi Demonstration PDF
This slide covers a brief overview of paid search analytics to determine campaign returns. It also includes steps for conducting a PPC audit, such as checking location and target settings, evaluating ads, using extensions, assessing keywords, etc. The best PPT templates are a great way to save time, energy, and resources. Slidegeeks have 100 percent editable powerpoint slides making them incredibly versatile. With these quality presentation templates, you can create a captivating and memorable presentation by combining visually appealing slides and effectively communicating your message. Download Marketers Guide To Data Analysis Optimization Introduction To Paid Search Analytics For Improving Campaign Roi Demonstration PDF from Slidegeeks and deliver a wonderful presentation.
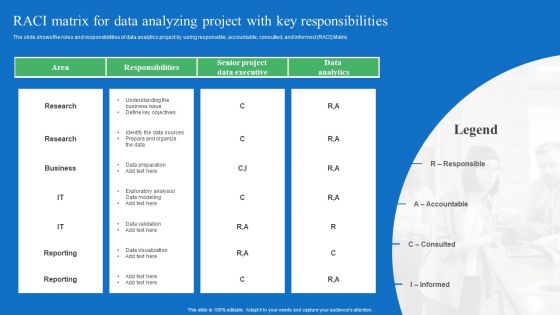
Toolkit For Data Science And Analytics Transition RACI Matrix For Data Analyzing Project With Key Responsibilities Background PDF
The slide shows the roles and responsibilities of data analytics project by using responsible, accountable, consulted, and informed RACI Matrix. Whether you have daily or monthly meetings, a brilliant presentation is necessary. Toolkit For Data Science And Analytics Transition RACI Matrix For Data Analyzing Project With Key Responsibilities Background PDF can be your best option for delivering a presentation. Represent everything in detail using Toolkit For Data Science And Analytics Transition RACI Matrix For Data Analyzing Project With Key Responsibilities Background PDF and make yourself stand out in meetings. The template is versatile and follows a structure that will cater to your requirements. All the templates prepared by Slidegeeks are easy to download and edit. Our research experts have taken care of the corporate themes as well. So, give it a try and see the results.
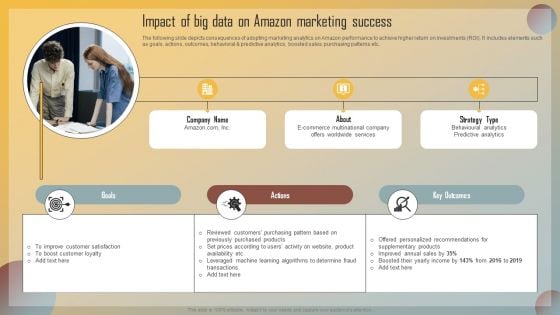
Guide For Marketing Analytics To Improve Decisions Impact Of Big Data On Amazon Marketing Success Summary PDF
The following slide depicts consequences of adopting marketing analytics on Amazon performance to achieve higher return on investments ROI. It includes elements such as goals, actions, outcomes, behavioral and predictive analytics, boosted sales, purchasing patterns etc. Slidegeeks is here to make your presentations a breeze with Guide For Marketing Analytics To Improve Decisions Impact Of Big Data On Amazon Marketing Success Summary PDF With our easy to use and customizable templates, you can focus on delivering your ideas rather than worrying about formatting. With a variety of designs to choose from, you are sure to find one that suits your needs. And with animations and unique photos, illustrations, and fonts, you can make your presentation pop. So whether you are giving a sales pitch or presenting to the board, make sure to check out Slidegeeks first.

Information Analysis And BI Playbook How To Fix The Business Intelligence Problem Data Analytics Playbook Designs PDF
This template covers the solution for BI problems such as analytics transformation and business intelligence program. It also depicts that switching to next generation analytics platform that gives business users data-driven insights. Get a simple yet stunning designed Information Analysis And BI Playbook How To Fix The Business Intelligence Problem Data Analytics Playbook Designs PDF. It is the best one to establish the tone in your meetings. It is an excellent way to make your presentations highly effective. So, download this PPT today from Slidegeeks and see the positive impacts. Our easy to edit Information Analysis And BI Playbook How To Fix The Business Intelligence Problem Data Analytics Playbook Designs PDF can be your go to option for all upcoming conferences and meetings. So, what are you waiting for Grab this template today.
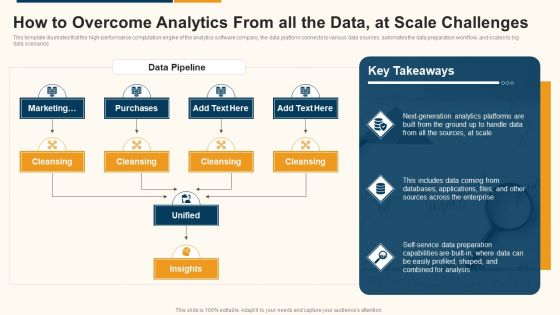
Data Interpretation And Analysis Playbook How To Overcome Analytics From All The Data At Scale Challenges Designs PDF
This template illustrates that the high-performance computation engine of the analytics software company, the data platform connects to various data sources, automates the data preparation workflow, and scales to big data scenarios. This is a data interpretation and analysis playbook how to overcome analytics from all the data at scale challenges designs pdf template with various stages. Focus and dispense information on three stages using this creative set, that comes with editable features. It contains large content boxes to add your information on topics like marketing, analysis, capabilities, service, databases, sources. You can also showcase facts, figures, and other relevant content using this PPT layout. Grab it now.
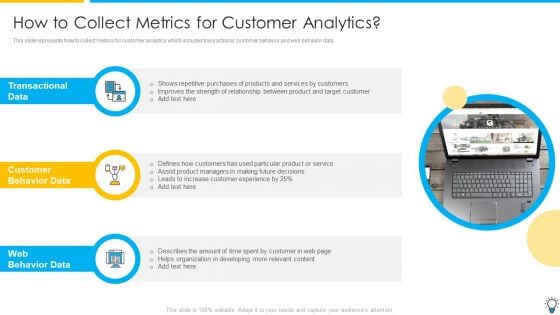
Assuring Management In Product Innovation To Enhance Processes How To Collect Metrics For Customer Analytics Infographics PDF
This slide represents how to collect metrics for customer analytics which includes transactional, customer behavior and web behavior data.This is a assuring management in product innovation to enhance processes how to collect metrics for customer analytics infographics pdf template with various stages. Focus and dispense information on three stages using this creative set, that comes with editable features. It contains large content boxes to add your information on topics like transactional data, customer behavior data, web behavior data You can also showcase facts, figures, and other relevant content using this PPT layout. Grab it now.
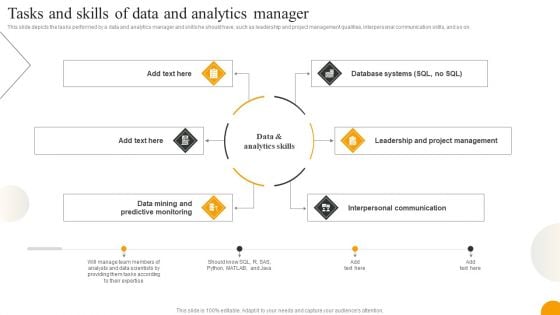
Using Data Science Technologies For Business Transformation Tasks And Skills Of Data And Analytics Manager Brochure PDF
This slide depicts the tasks performed by a data and analytics manager and skills he should have, such as leadership and project management qualities, interpersonal communication skills, and so on. Are you in need of a template that can accommodate all of your creative concepts This one is crafted professionally and can be altered to fit any style. Use it with Google Slides or PowerPoint. Include striking photographs, symbols, depictions, and other visuals. Fill, move around, or remove text boxes as desired. Test out color palettes and font mixtures. Edit and save your work, or work with colleagues. Download Using Data Science Technologies For Business Transformation Tasks And Skills Of Data And Analytics Manager Brochure PDF and observe how to make your presentation outstanding. Give an impeccable presentation to your group and make your presentation unforgettable.
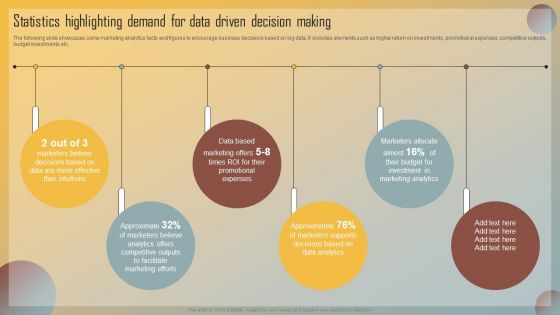
Guide For Marketing Analytics To Improve Decisions Statistics Highlighting Demand For Data Driven Decision Making Slides PDF
The following slide showcases some marketing analytics facts and figures to encourage business decisions based on big data. It includes elements such as higher return on investments, promotional expenses, competitive outputs, budget investments etc. This modern and well arranged Guide For Marketing Analytics To Improve Decisions Statistics Highlighting Demand For Data Driven Decision Making Slides PDF provides lots of creative possibilities. It is very simple to customize and edit with the Powerpoint Software. Just drag and drop your pictures into the shapes. All facets of this template can be edited with Powerpoint no extra software is necessary. Add your own material, put your images in the places assigned for them, adjust the colors, and then you can show your slides to the world, with an animated slide included.
Gym Health And Fitness Market Industry Report Analytics Dashboard For Gym Health And Fitness Clubs Ppt Icon Slideshow PDF
Presenting this set of slides with name gym health and fitness market industry report analytics dashboard for gym health and fitness clubs ppt icon slideshow pdf. This is a seven stage process. The stages in this process are attended special events, facebook fans, web hits, enrollment for gym, social media friends, twitter followers, emails collected on website. This is a completely editable PowerPoint presentation and is available for immediate download. Download now and impress your audience.
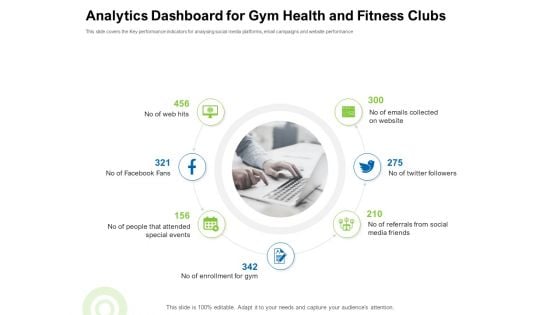
Strategies To Enter Physical Fitness Club Business Analytics Dashboard For Gym Health And Fitness Clubs Brochure PDF
This slide covers the Key performance indicators for analysing social media platforms, email campaigns and website performance This is a strategies to enter physical fitness club business analytics dashboard for gym health and fitness clubs brochure pdf template with various stages. Focus and dispense information on seven stages using this creative set, that comes with editable features. It contains large content boxes to add your information on topics like web, facebook, twitter, followers, friends. You can also showcase facts, figures, and other relevant content using this PPT layout. Grab it now.
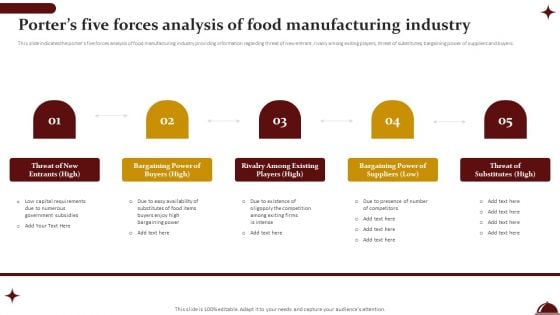
Food Processing Industry Latest Insights Trends And Analytics Porters Five Forces Analysis Of Food Manufacturing Industry Formats PDF
This slide indicates the porters five forces analysis of food manufacturing industry providing information regarding threat of new entrant, rivalry among exiting players, threat of substitutes, bargaining power of suppliers and buyers. From laying roadmaps to briefing everything in detail, our templates are perfect for you. You can set the stage with your presentation slides. All you have to do is download these easy to edit and customizable templates. Food Processing Industry Latest Insights Trends And Analytics Porters Five Forces Analysis Of Food Manufacturing Industry Formats PDF will help you deliver an outstanding performance that everyone would remember and praise you for. Do download this presentation today.
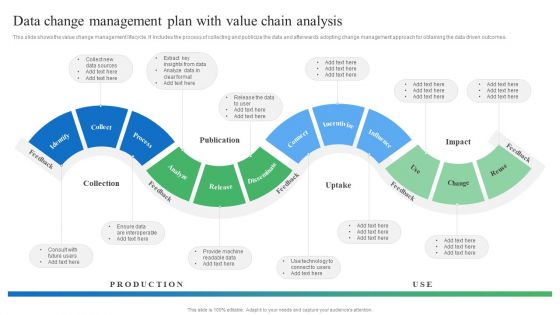
Toolkit For Data Science And Analytics Transition Data Change Management Plan With Value Chain Analysis Information PDF
This slide shows the value change management lifecycle. It includes the process of collecting and publicize the data and afterwards adopting change management approach for obtaining the data driven outcomes. Get a simple yet stunning designed Toolkit For Data Science And Analytics Transition Data Change Management Plan With Value Chain Analysis Information PDF. It is the best one to establish the tone in your meetings. It is an excellent way to make your presentations highly effective. So, download this PPT today from Slidegeeks and see the positive impacts. Our easy to edit Toolkit For Data Science And Analytics Transition Data Change Management Plan With Value Chain Analysis Information PDF can be your go to option for all upcoming conferences and meetings. So, what are you waiting for Grab this template today.
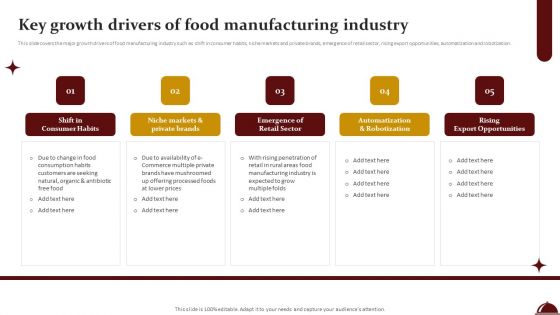
Food Processing Industry Latest Insights Trends And Analytics Key Growth Drivers Of Food Manufacturing Industry Slides PDF
This slide covers the major growth drivers of food manufacturing industry such as shift in consumer habits, niche markets and private brands, emergence of retail sector, rising export opportunities, automatization and robotization. Are you in need of a template that can accommodate all of your creative concepts This one is crafted professionally and can be altered to fit any style. Use it with Google Slides or PowerPoint. Include striking photographs, symbols, depictions, and other visuals. Fill, move around, or remove text boxes as desired. Test out color palettes and font mixtures. Edit and save your work, or work with colleagues. Download Food Processing Industry Latest Insights Trends And Analytics Key Growth Drivers Of Food Manufacturing Industry Slides PDF and observe how to make your presentation outstanding. Give an impeccable presentation to your group and make your presentation unforgettable.
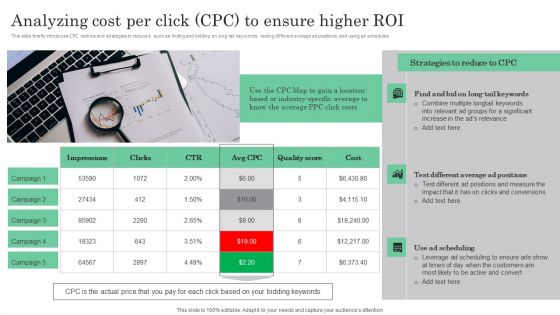
Online Marketing Analytics To Enhance Business Growth Analyzing Cost Per Click CPC To Ensure Higher ROI Graphics PDF
This slide briefly introduces CPC metrics and strategies to reduce it, such as finding and bidding on long tail keywords, testing different average ad positions, and using ad schedules. Slidegeeks is one of the best resources for PowerPoint templates. You can download easily and regulate Online Marketing Analytics To Enhance Business Growth Analyzing Cost Per Click CPC To Ensure Higher ROI Graphics PDF for your personal presentations from our wonderful collection. A few clicks is all it takes to discover and get the most relevant and appropriate templates. Use our Templates to add a unique zing and appeal to your presentation and meetings. All the slides are easy to edit and you can use them even for advertisement purposes.
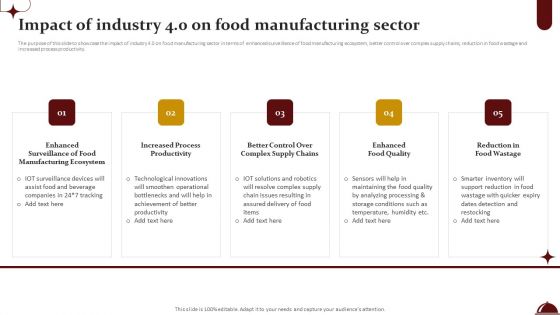
Food Processing Industry Latest Insights Trends And Analytics Impact Of Industry 4 0 On Food Manufacturing Sector Guidelines PDF
The purpose of this slide to showcase the impact of industry 4.0 on food manufacturing sector in terms of enhanced surveillance of food manufacturing ecosystem, better control over complex supply chains, reduction in food wastage and increased process productivity. Want to ace your presentation in front of a live audience Our Food Processing Industry Latest Insights Trends And Analytics Impact Of Industry 4 0 On Food Manufacturing Sector Guidelines PDF can help you do that by engaging all the users towards you. Slidegeeks experts have put their efforts and expertise into creating these impeccable powerpoint presentations so that you can communicate your ideas clearly. Moreover, all the templates are customizable, and easy to edit and downloadable. Use these for both personal and commercial use.
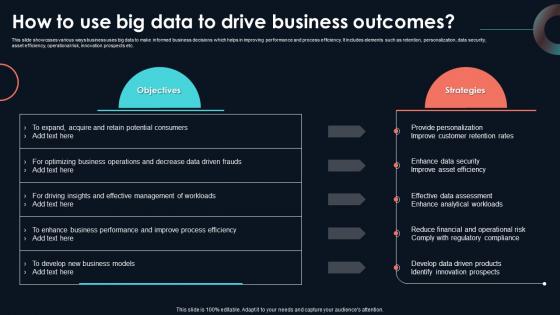
How To Use Big Data To Drive Business Developing Strategic Insights Using Big Data Analytics SS V
This slide showcases various ways business uses big data to make informed business decisions which helps in improving performance and process efficiency. It includes elements such as retention, personalization, data security, asset efficiency, operational risk, innovation prospects etc. Here you can discover an assortment of the finest PowerPoint and Google Slides templates. With these templates, you can create presentations for a variety of purposes while simultaneously providing your audience with an eye-catching visual experience. Download How To Use Big Data To Drive Business Developing Strategic Insights Using Big Data Analytics SS V to deliver an impeccable presentation. These templates will make your job of preparing presentations much quicker, yet still, maintain a high level of quality. Slidegeeks has experienced researchers who prepare these templates and write high-quality content for you. Later on, you can personalize the content by editing the How To Use Big Data To Drive Business Developing Strategic Insights Using Big Data Analytics SS V. This slide showcases various ways business uses big data to make informed business decisions which helps in improving performance and process efficiency. It includes elements such as retention, personalization, data security, asset efficiency, operational risk, innovation prospects etc.
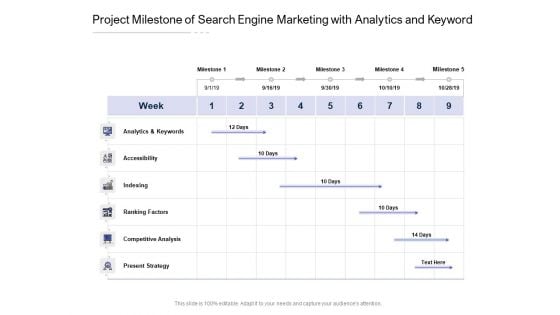
Project Milestone Of Search Engine Marketing With Analytics And Keyword Ppt PowerPoint Presentation Gallery Graphics Download PDF
Presenting this set of slides with name project milestone of search engine marketing with analytics and keyword ppt powerpoint presentation gallery graphics download pdf. The topics discussed in these slides are analytics, accessibility, indexing. This is a completely editable PowerPoint presentation and is available for immediate download. Download now and impress your audience.
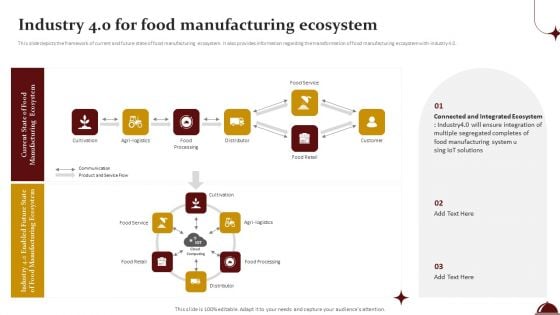
Food Processing Industry Latest Insights Trends And Analytics Industry 4 0 For Food Manufacturing Ecosystem Mockup PDF
This slide depicts the framework of current and future state of food manufacturing ecosystem. It also provides information regarding the transformation of food manufacturing ecosystem with industry 4.0. If you are looking for a format to display your unique thoughts, then the professionally designed Food Processing Industry Latest Insights Trends And Analytics Industry 4 0 For Food Manufacturing Ecosystem Mockup PDF is the one for you. You can use it as a Google Slides template or a PowerPoint template. Incorporate impressive visuals, symbols, images, and other charts. Modify or reorganize the text boxes as you desire. Experiment with shade schemes and font pairings. Alter, share or cooperate with other people on your work. Download Food Processing Industry Latest Insights Trends And Analytics Industry 4 0 For Food Manufacturing Ecosystem Mockup PDF and find out how to give a successful presentation. Present a perfect display to your team and make your presentation unforgettable.
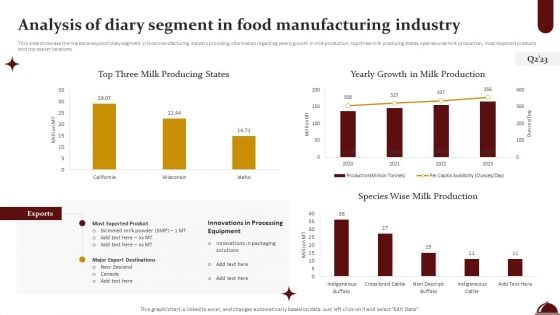
Food Processing Industry Latest Insights Trends And Analytics Analysis Of Diary Segment In Food Manufacturing Industry Mockup PDF
This slide showcase the market analysis of diary segment in food manufacturing industry providing information regarding yearly growth in milk production, top three milk producing states, species wise milk production, most exported products and top export locations. This Food Processing Industry Latest Insights Trends And Analytics Analysis Of Diary Segment In Food Manufacturing Industry Mockup PDF from Slidegeeks makes it easy to present information on your topic with precision. It provides customization options, so you can make changes to the colors, design, graphics, or any other component to create a unique layout. It is also available for immediate download, so you can begin using it right away. Slidegeeks has done good research to ensure that you have everything you need to make your presentation stand out. Make a name out there for a brilliant performance.
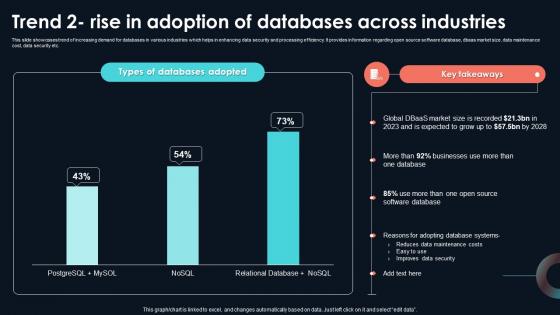
Trend 2 Rise In Adoption Of Databases Across Developing Strategic Insights Using Big Data Analytics SS V
This slide showcases trend of increasing demand for databases in various industries which helps in enhancing data security and processing efficiency. It provides information regarding open source software database, dbaas market size, data maintenance cost, data security etc. This Trend 2 Rise In Adoption Of Databases Across Developing Strategic Insights Using Big Data Analytics SS V from Slidegeeks makes it easy to present information on your topic with precision. It provides customization options, so you can make changes to the colors, design, graphics, or any other component to create a unique layout. It is also available for immediate download, so you can begin using it right away. Slidegeeks has done good research to ensure that you have everything you need to make your presentation stand out. Make a name out there for a brilliant performance. This slide showcases trend of increasing demand for databases in various industries which helps in enhancing data security and processing efficiency. It provides information regarding open source software database, dbaas market size, data maintenance cost, data security etc.
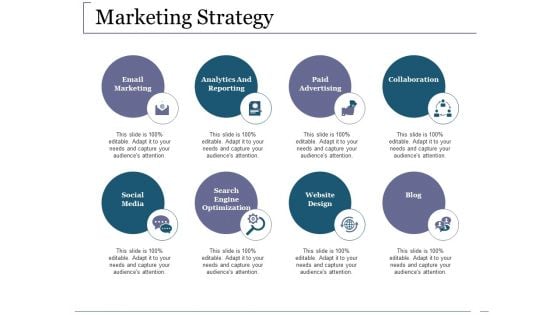
Marketing Strategy Ppt PowerPoint Presentation Slides Visual Aids
This is a marketing strategy ppt powerpoint presentation slides visual aids. This is a eight stage process. The stages in this process are email marketing, analytics and reporting, paid advertising, collaboration, website design.
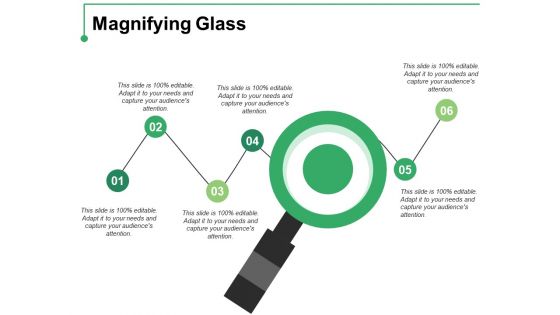
Magnifying Glass Ppt PowerPoint Presentation Visual Aids Inspiration
This is a magnifying glass ppt powerpoint presentation visual aids inspiration. This is a six stage process. The stages in this process are magnifier glass, research, business, marketing, focus.

Man Power Requirements Ppt PowerPoint Presentation Visual Aids Ideas
This is a man power requirements ppt powerpoint presentation visual aids ideas. This is a four stage process. The stages in this process are magnifying, glass, search, marketing.
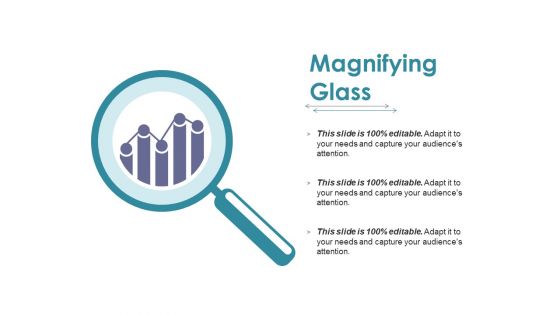
Magnifying Glass Ppt PowerPoint Presentation Visual Aids Summary
This is a magnifying glass ppt powerpoint presentation visual aids summary. This is a one stage process. The stages in this process are magnifying glass, business, marketing, technology.
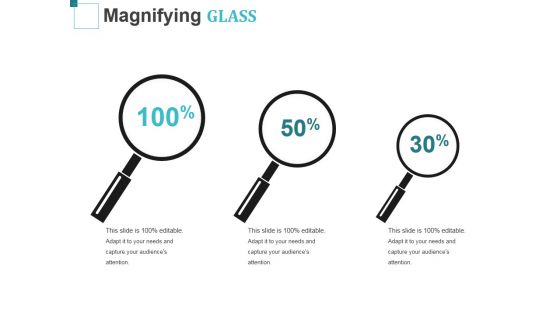
Magnifying Glass Ppt PowerPoint Presentation Ideas Visual Aids
This is a magnifying glass ppt powerpoint presentation ideas visual aids. This is a three stage process. The stages in this process are business, strategy, analysis, magnifying glass.
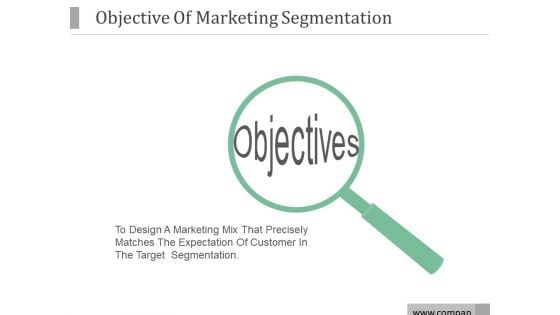
Objective Of Marketing Segmentation Ppt PowerPoint Presentation Visual Aids
This is a objective of marketing segmentation ppt powerpoint presentation visual aids. This is a one stage process. The stages in this process are objectives, business, marketing, strategy, models.
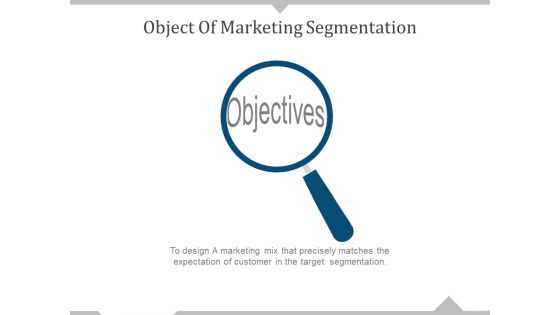
Object Of Marketing Segmentation Ppt PowerPoint Presentation Gallery Visual Aids
This is a object of marketing segmentation ppt powerpoint presentation gallery visual aids. This is a one stage process. The stages in this process are magnifier glass, strategy, communication, business, marketing, search.
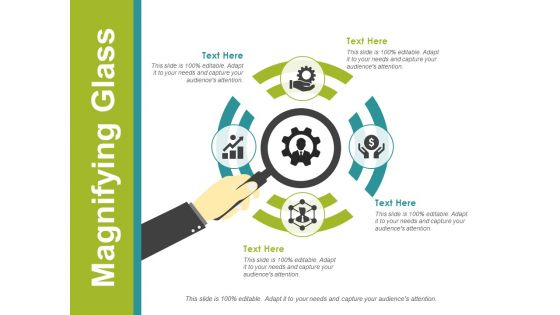
Magnifying Glass Ppt PowerPoint Presentation Visual Aids Show
This is a magnifying glass ppt powerpoint presentation visual aids show. This is a four stage process. The stages in this process are magnifying glass, business, marketing, technology, icons.

Magnifying Glass Technology Ppt PowerPoint Presentation Gallery Visual Aids
Presenting this set of slides with name magnifying glass technology ppt powerpoint presentation gallery visual aids. This is a three stage process. The stages in this process are technology, marketing, planning, business, management. This is a completely editable PowerPoint presentation and is available for immediate download. Download now and impress your audience.
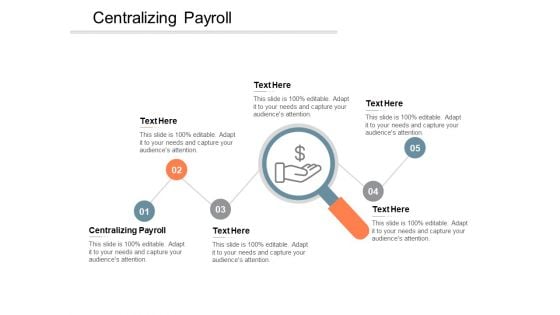
Centralizing Payroll Ppt PowerPoint Presentation Inspiration Visual Aids Cpb
Presenting this set of slides with name centralizing payroll ppt powerpoint presentation inspiration visual aids cpb. This is an editable Powerpoint five stages graphic that deals with topics like centralizing payroll to help convey your message better graphically. This product is a premium product available for immediate download and is 100 percent editable in Powerpoint. Download this now and use it in your presentations to impress your audience.
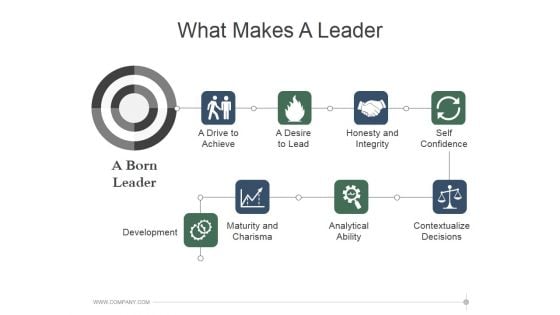
What Makes A Leader Ppt PowerPoint Presentation Visual Aids
This is a what makes a leader ppt powerpoint presentation visual aids. This is a eight stage process. The stages in this process are a drive to achieve, a desire to lead, honesty and integrity, self confidence, maturity and charisma, analytical ability, contextualize decisions, development.
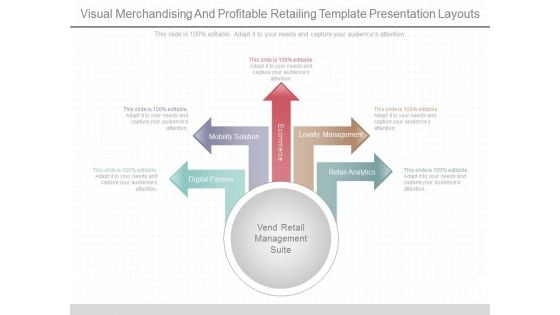
Visual Merchandising And Profitable Retailing Template Presentation Layouts
This is a visual merchandising and profitable retailing template presentation layouts. This is a five stage process. The stages in this process are digital passes, mobility solution, ecommerce, loyalty management, retail analytics, vend retail management suite.

Our Service Maintenance Ppt PowerPoint Presentation Professional Visual Aids
Presenting this set of slides with name our service maintenance ppt powerpoint presentation professional visual aids. This is a four stage process. The stages in this process are our service, marketing, analytics, security, maintenance. This is a completely editable PowerPoint presentation and is available for immediate download. Download now and impress your audience.
Business Report Vector Icon Ppt PowerPoint Presentation Professional Visual Aids
Presenting this set of slides with name business report vector icon ppt powerpoint presentation professional visual aids. This is a one stage process. The stages in this process are audit observation, business analytics, business performance. This is a completely editable PowerPoint presentation and is available for immediate download. Download now and impress your audience.
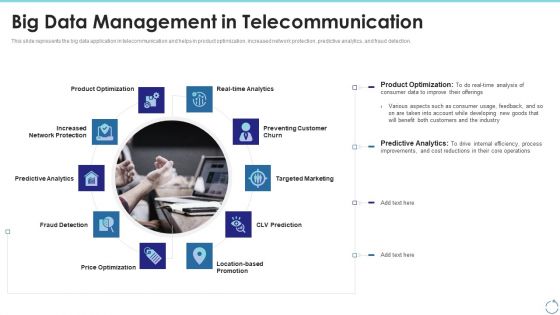
Big Data Management In Telecommunication Ppt Outline Visual Aids PDF
This slide represents the big data application in telecommunication and helps in product optimization, increased network protection, predictive analytics, and fraud detection. Presenting big data management in telecommunication ppt outline visual aids pdf to provide visual cues and insights. Share and navigate important information on ten stages that need your due attention. This template can be used to pitch topics like cost reductions, developing, industry, product optimization. In addtion, this PPT design contains high resolution images, graphics, etc, that are easily editable and available for immediate download.
Financial Charts Data Analysis Vector Icon Ppt PowerPoint Presentation Visual Aids Summary Cpb
This is a financial charts data analysis vector icon ppt powerpoint presentation visual aids summary cpb. This is a three stage process. The stages in this process are data analysis, analytics architecture, analytics framework.
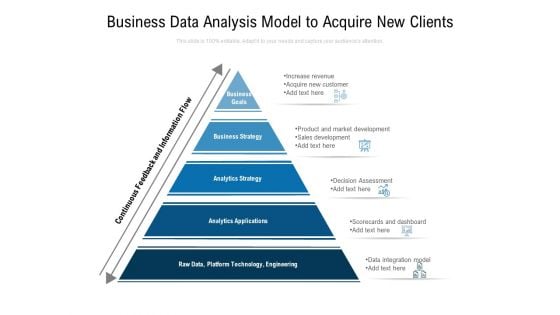
Business Data Analysis Model To Acquire New Clients Ppt PowerPoint Presentation Visual Aids Infographics PDF
Presenting this set of slides with name business data analysis model to acquire new clients ppt powerpoint presentation visual aids infographics pdf. This is a five stage process. The stages in this process are business goals, business strategy, analytics strategy, analytics applications, data, platform technology, engineering. This is a completely editable PowerPoint presentation and is available for immediate download. Download now and impress your audience.
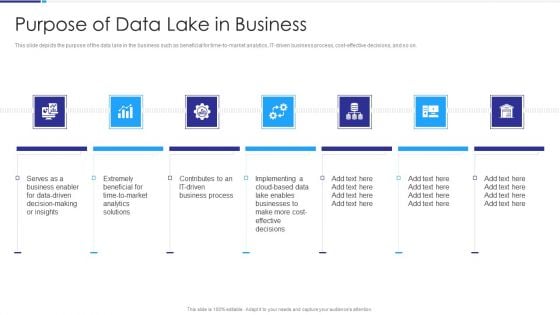
Data Lake Architecture Purpose Of Data Lake In Business Ppt Visual Aids Outline PDF
This slide depicts the purpose of the data lake in the business such as beneficial for time-to-market analytics, IT-driven business process, cost-effective decisions, and so on. This is a Data Lake Architecture Purpose Of Data Lake In Business Ppt Visual Aids Outline PDF template with various stages. Focus and dispense information on seven stages using this creative set, that comes with editable features. It contains large content boxes to add your information on topics like Business Enabler, Data Driven, Time To Market, Analytics Solutions, IT Driven Business Process. You can also showcase facts, figures, and other relevant content using this PPT layout. Grab it now.
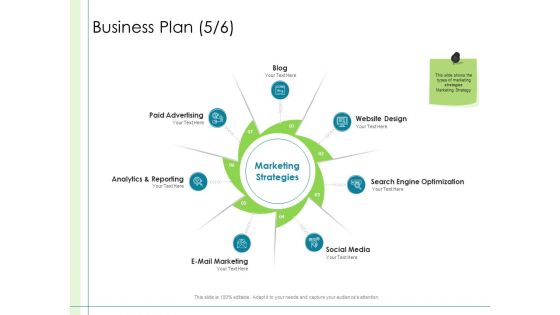
In Depth Business Assessment Business Plan Blog Ppt PowerPoint Presentation Infographic Template Visual Aids PDF
Presenting in depth business assessment business plan blog ppt powerpoint presentation infographic template visual aids pdf to provide visual cues and insights. Share and navigate important information on seven stages that need your due attention. This template can be used to pitch topics like paid advertising, analytics and reporting, e mail marketing, social media, search engine optimization, website design, blog. In addition, this PPT design contains high-resolution images, graphics, etc, that are easily editable and available for immediate download.


 Continue with Email

 Home
Home


