Web Analytics
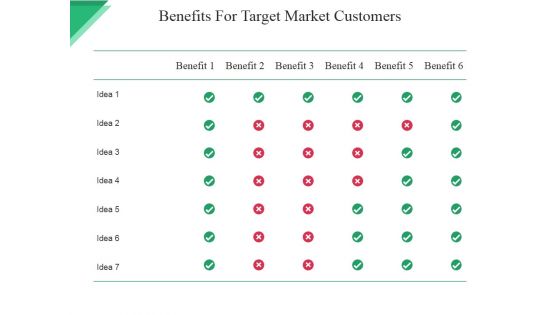
Benefits For Target Market Customers Ppt PowerPoint Presentation Summary Example Introduction
This is a benefits for target market customers ppt powerpoint presentation summary example introduction. This is a six stage process. The stages in this process are benefits, table, compare, data, analysis.
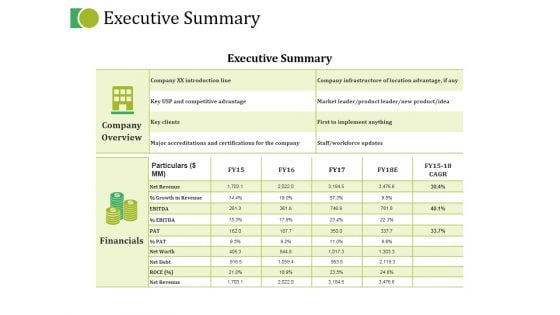
Executive Summary Ppt PowerPoint Presentation Portfolio Maker
This is a executive summary ppt powerpoint presentation portfolio maker. This is a two stage process. The stages in this process are company overview, financials, tables, management, data analysis.
Manufacturing Plan Ppt PowerPoint Presentation Infographic Template Icons
This is a manufacturing plan ppt powerpoint presentation infographic template icons. This is a seven stage process. The stages in this process are table, marketing, planning, strategy, data analysis.
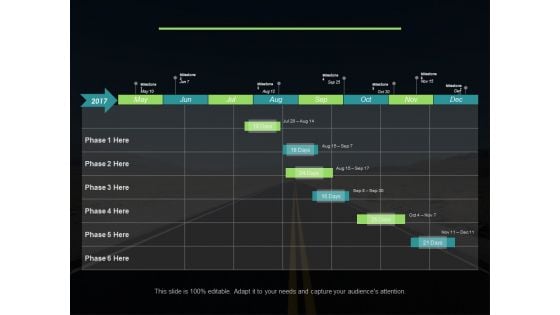
Milestone Plan Strategy Ppt PowerPoint Presentation Inspiration Graphics Template
This is a milestone plan strategy ppt powerpoint presentation inspiration graphics template. This is a six stage process. The stages in this process are table, data management, planning, strategy, analysis.
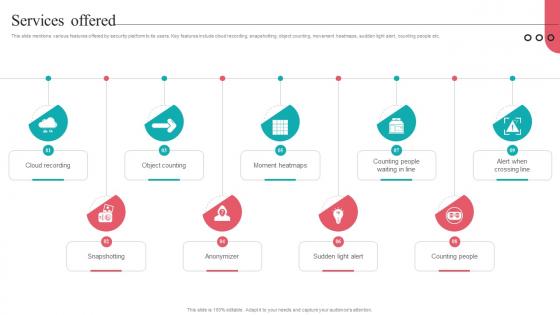
Services Offered Camera Management Platform Investor Funding Elevator Pitch Deck
This slide mentions various features offered by security platform to its users. Key features include cloud recording, snapshotting, object counting, movement heatmaps, sudden light alert, counting people etc. Coming up with a presentation necessitates that the majority of the effort goes into the content and the message you intend to convey. The visuals of a PowerPoint presentation can only be effective if it supplements and supports the story that is being told. Keeping this in mind our experts created Services Offered Camera Management Platform Investor Funding Elevator Pitch Deck to reduce the time that goes into designing the presentation. This way, you can concentrate on the message while our designers take care of providing you with the right template for the situation. This slide mentions various features offered by security platform to its users. Key features include cloud recording, snapshotting, object counting, movement heatmaps, sudden light alert, counting people etc.
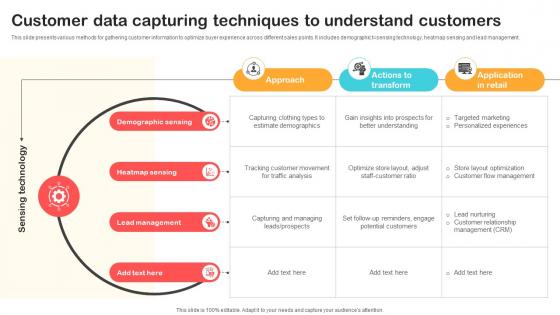
Customer Data Capturing Techniques To Understand Customers Optimizing Retail Operations With Digital DT SS V
This slide presents various methods for gathering customer information to optimize buyer experience across different sales points. It includes demographic t sensing technology, heatmap sensing and lead management.If your project calls for a presentation, then Slidegeeks is your go-to partner because we have professionally designed, easy-to-edit templates that are perfect for any presentation. After downloading, you can easily edit Customer Data Capturing Techniques To Understand Customers Optimizing Retail Operations With Digital DT SS V and make the changes accordingly. You can rearrange slides or fill them with different images. Check out all the handy templates This slide presents various methods for gathering customer information to optimize buyer experience across different sales points. It includes demographic t sensing technology, heatmap sensing and lead management.
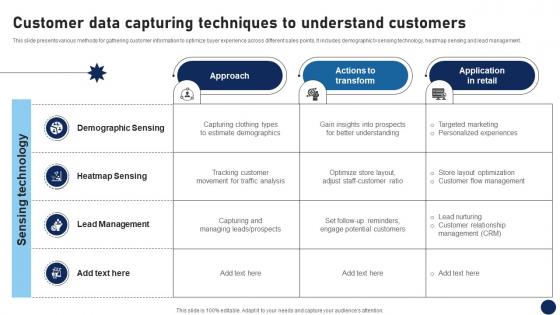
Customer Data Capturing Techniques To Understand Customers DT SS V
This slide presents various methods for gathering customer information to optimize buyer experience across different sales points. It includes demographic tsensing technology, heatmap sensing and lead management.If your project calls for a presentation, then Slidegeeks is your go-to partner because we have professionally designed, easy-to-edit templates that are perfect for any presentation. After downloading, you can easily edit Customer Data Capturing Techniques To Understand Customers DT SS V and make the changes accordingly. You can rearrange slides or fill them with different images. Check out all the handy templates This slide presents various methods for gathering customer information to optimize buyer experience across different sales points. It includes demographic tsensing technology, heatmap sensing and lead management.

Comparative Analysis Of Encryption And Tokenization In Ds Securing Your Data Ppt Presentation
This slide represents the comparison of encryption and tokenization. The purpose of this slide is to highlight different components of comparison such as definition, importance, objective, and so on Do you have an important presentation coming up Are you looking for something that will make your presentation stand out from the rest Look no further than Comparative Analysis Of Encryption And Tokenization In Ds Securing Your Data Ppt Presentation With our professional designs, you can trust that your presentation will pop and make delivering it a smooth process. And with Slidegeeks, you can trust that your presentation will be unique and memorable. So why wait Grab Comparative Analysis Of Encryption And Tokenization In Ds Securing Your Data Ppt Presentation today and make your presentation stand out from the rest This slide represents the comparison of encryption and tokenization. The purpose of this slide is to highlight different components of comparison such as definition, importance, objective, and so on
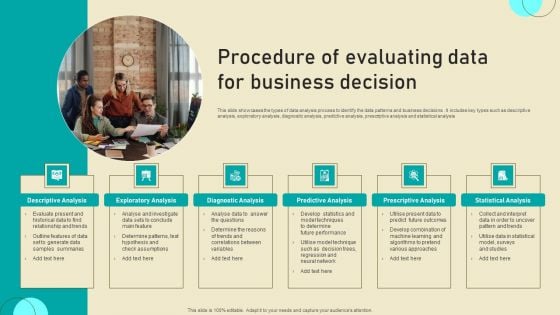
Procedure Of Evaluating Data For Business Decision Professional PDF
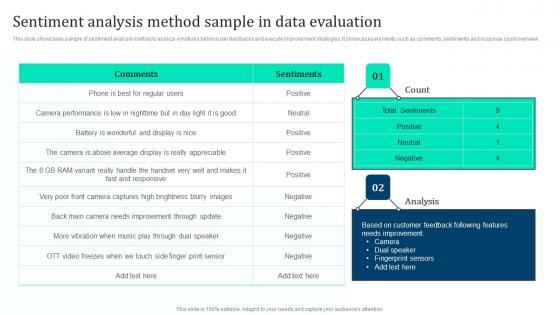
Sentiment Analysis Method Sample Marketing Intelligence Guide Data Gathering Rules Pdf
This slide showcases sample of sentiment analysis method to analyze emotions behind user feedbacks and execute improvement strategies. It showcases elements such as comments, sentiments and response count overview. Want to ace your presentation in front of a live audience Our Sentiment Analysis Method Sample Marketing Intelligence Guide Data Gathering Rules Pdf can help you do that by engaging all the users towards you. Slidegeeks experts have put their efforts and expertise into creating these impeccable powerpoint presentations so that you can communicate your ideas clearly. Moreover, all the templates are customizable, and easy to edit and downloadable. Use these for both personal and commercial use. This slide showcases sample of sentiment analysis method to analyze emotions behind user feedbacks and execute improvement strategies. It showcases elements such as comments, sentiments and response count overview.

Deploying Online Marketing Seo Checklist For Website Optimization And Marketing Ideas PDF
This slide represents four level process checklist for optimization for search engine and marketing of website. It includes target market business analysis, keyword research and analysis, content optimization, testing and measurement. If your project calls for a presentation, then Slidegeeks is your go-to partner because we have professionally designed, easy-to-edit templates that are perfect for any presentation. After downloading, you can easily edit Deploying Online Marketing Seo Checklist For Website Optimization And Marketing Ideas PDF and make the changes accordingly. You can rearrange slides or fill them with different images. Check out all the handy templates.
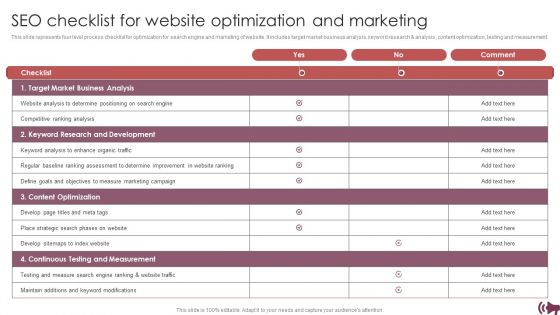
Guide Digital Advertising Optimize Lead Targeting SEO Checklist For Website Optimization And Marketing Mockup PDF
This slide represents four level process checklist for optimization for search engine and marketing of website. It includes target market business analysis, keyword research and analysis, content optimization, testing and measurement. If your project calls for a presentation, then Slidegeeks is your go to partner because we have professionally designed, easy to edit templates that are perfect for any presentation. After downloading, you can easily edit Guide Digital Advertising Optimize Lead Targeting SEO Checklist For Website Optimization And Marketing Mockup PDF and make the changes accordingly. You can rearrange slides or fill them with different images. Check out all the handy templates
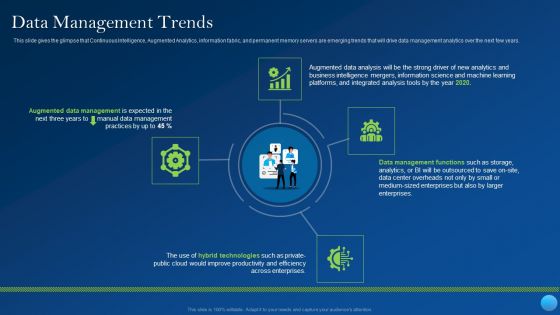
Data Management Trends Clipart PDF
This is a data management trends clipart pdf template with various stages. Focus and dispense information on four stages using this creative set, that comes with editable features. It contains large content boxes to add your information on topics like augmented data management, augmented data analysis, data management functions. You can also showcase facts, figures, and other relevant content using this PPT layout. Grab it now.
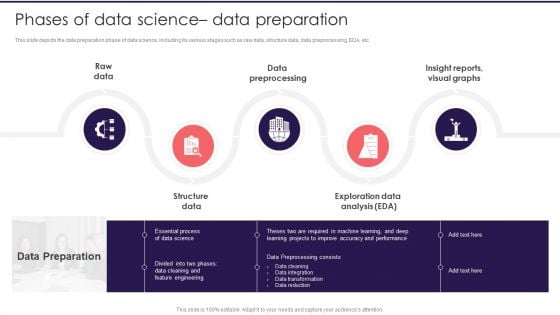
Information Studies Phases Of Data Science Data Preparation Elements PDF
This slide depicts the data preparation phase of data science, including its various stages such as raw data, structure data, data preprocessing, EDA, etc. This is a Information Studies Phases Of Data Science Data Preparation Elements PDF template with various stages. Focus and dispense information on five stages using this creative set, that comes with editable features. It contains large content boxes to add your information on topics like Raw Data, Data Preprocessing, Exploration Data Analysis. You can also showcase facts, figures, and other relevant content using this PPT layout. Grab it now.
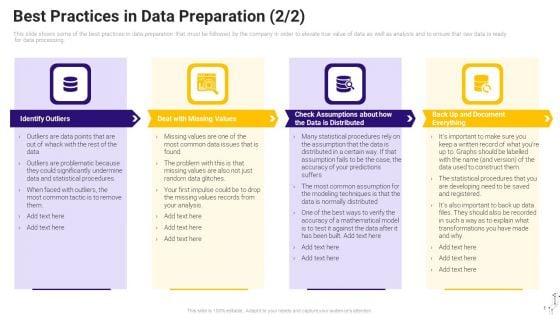
Effective Data Arrangement For Data Accessibility And Processing Readiness Best Practices In Data Preparation Values Information PDF
This slide shows some of the best practices in data preparation that must be followed by the company in order to elevate true value of data as well as analysis and to ensure that raw data is ready for data processing. This is a effective data arrangement for data accessibility and processing readiness best practices in data preparation values information pdf template with various stages. Focus and dispense information on four stages using this creative set, that comes with editable features. It contains large content boxes to add your information on topics like check data formats, verify data types, graph the data, verify data accuracy. You can also showcase facts, figures, and other relevant content using this PPT layout. Grab it now.
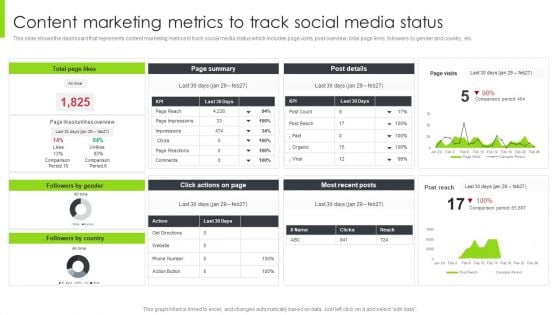
Optimizing Content Marketing Strategies To Enhance Conversion Rate Content Marketing Metrics To Track Social Media Status Brochure PDF
This slide shows the dashboard that represents content marketing metrics to track social media status which includes page visits, post overview, total page links, followers by gender and country, etc. Create an editable Optimizing Content Marketing Strategies To Enhance Conversion Rate Content Marketing Metrics To Track Social Media Status Brochure PDF that communicates your idea and engages your audience. Whether youre presenting a business or an educational presentation, pre-designed presentation templates help save time. Optimizing Content Marketing Strategies To Enhance Conversion Rate Content Marketing Metrics To Track Social Media Status Brochure PDF is highly customizable and very easy to edit, covering many different styles from creative to business presentations. Slidegeeks has creative team members who have crafted amazing templates. So, go and get them without any delay.
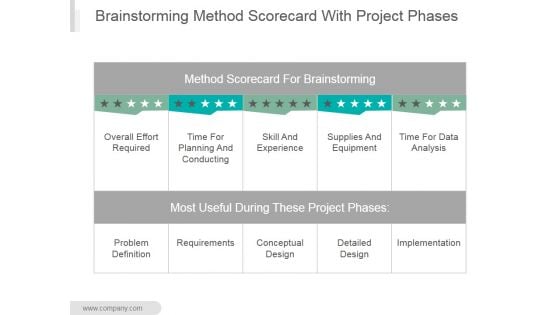
Brainstorming Method Scorecard With Project Phases Ppt PowerPoint Presentation Sample
This is a brainstorming method scorecard with project phases ppt powerpoint presentation sample. This is a five stage process. The stages in this process are method scorecard for brainstorming, overall effort required, time for planning and conducting, skill and experience, supplies and equipment, time for data analysis.
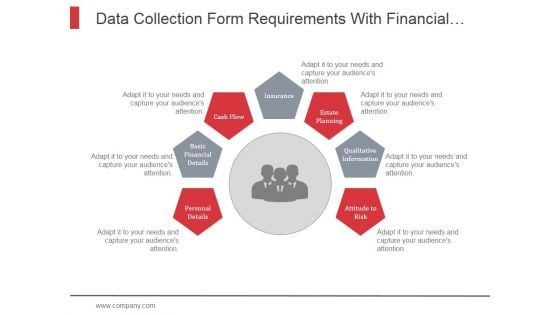
Data Collection Form Requirements With Financial Details Ppt PowerPoint Presentation Pictures
This is a data collection form requirements with financial details ppt powerpoint presentation pictures. This is a stage seven process. The stages in this process are form, financial form, data collection, financial details, data analysis.
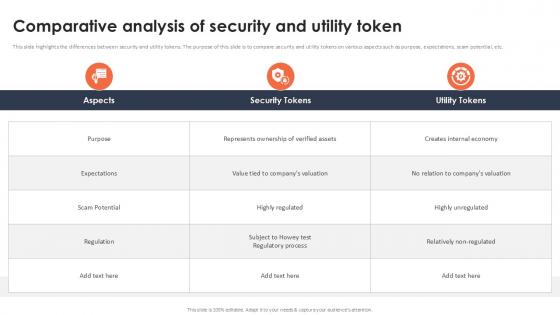
Comparative Analysis Of Security And Utility Token Securing Your Data Ppt Template
This slide highlights the differences between security and utility tokens. The purpose of this slide is to compare security and utility tokens on various aspects such as purpose, expectations, scam potential, etc. Whether you have daily or monthly meetings, a brilliant presentation is necessary. Comparative Analysis Of Security And Utility Token Securing Your Data Ppt Template can be your best option for delivering a presentation. Represent everything in detail using Comparative Analysis Of Security And Utility Token Securing Your Data Ppt Template and make yourself stand out in meetings. The template is versatile and follows a structure that will cater to your requirements. All the templates prepared by Slidegeeks are easy to download and edit. Our research experts have taken care of the corporate themes as well. So, give it a try and see the results. This slide highlights the differences between security and utility tokens. The purpose of this slide is to compare security and utility tokens on various aspects such as purpose, expectations, scam potential, etc.
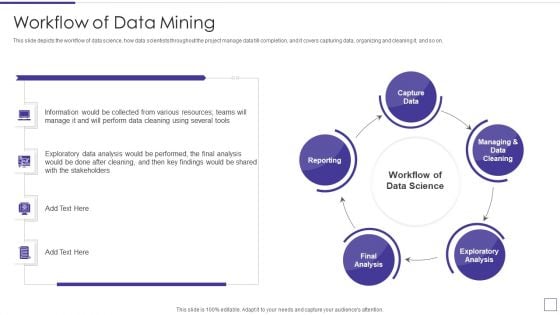
Data Mining Implementation Workflow Of Data Mining Microsoft PDF
This slide depicts the workflow of data science, how data scientists throughout the project manage data till completion, and it covers capturing data, organizing and cleaning it, and so on.This is a data mining implementation workflow of data mining microsoft pdf template with various stages. Focus and dispense information on five stages using this creative set, that comes with editable features. It contains large content boxes to add your information on topics like capture data, managing and data cleaning, exploratory analysis You can also showcase facts, figures, and other relevant content using this PPT layout. Grab it now.
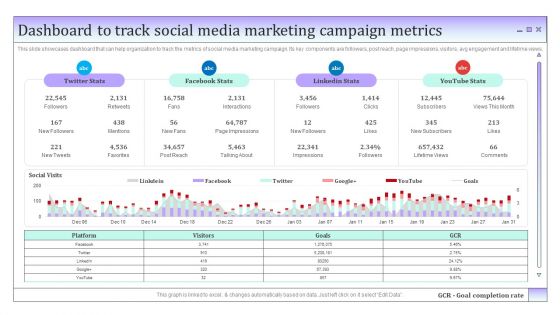
Business To Business Social Dashboard To Track Social Media Marketing Campaign Metrics Microsoft PDF
This slide showcases dashboard that can help organization to track the metrics of social media marketing campaign. Its key components are followers, post reach, page impressions, visitors, avg engagement and lifetime views. Here you can discover an assortment of the finest PowerPoint and Google Slides templates. With these templates, you can create presentations for a variety of purposes while simultaneously providing your audience with an eye-catching visual experience. Download Business To Business Social Dashboard To Track Social Media Marketing Campaign Metrics Microsoft PDF to deliver an impeccable presentation. These templates will make your job of preparing presentations much quicker, yet still, maintain a high level of quality. Slidegeeks has experienced researchers who prepare these templates and write high-quality content for you. Later on, you can personalize the content by editing the Business To Business Social Dashboard To Track Social Media Marketing Campaign Metrics Microsoft PDF.
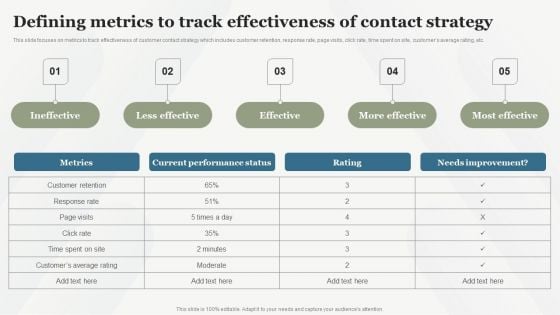
Boosting Customer Base Through Effective Defining Metrics To Track Effectiveness Of Contact Mockup PDF
This slide focuses on metrics to track effectiveness of customer contact strategy which includes customer retention, response rate, page visits, click rate, time spent on site, customers average rating, etc. Do you have to make sure that everyone on your team knows about any specific topic I yes, then you should give Boosting Customer Base Through Effective Defining Metrics To Track Effectiveness Of Contact Mockup PDF a try. Our experts have put a lot of knowledge and effort into creating this impeccable Boosting Customer Base Through Effective Defining Metrics To Track Effectiveness Of Contact Mockup PDF. You can use this template for your upcoming presentations, as the slides are perfect to represent even the tiniest detail. You can download these templates from the Slidegeeks website and these are easy to edit. So grab these today.
Consumer Lead Generation Process Lead Generation Dashboard For Tracking Conversion Rates Mockup PDF
This slide covers the KPI dashboard for tracking lead conversion rates. It includes metrics such as visitors, average session rate, per visit, bounce rate, page views, etc. Here you can discover an assortment of the finest PowerPoint and Google Slides templates. With these templates, you can create presentations for a variety of purposes while simultaneously providing your audience with an eye-catching visual experience. Download Consumer Lead Generation Process Lead Generation Dashboard For Tracking Conversion Rates Mockup PDF to deliver an impeccable presentation. These templates will make your job of preparing presentations much quicker, yet still, maintain a high level of quality. Slidegeeks has experienced researchers who prepare these templates and write high-quality content for you. Later on, you can personalize the content by editing the Consumer Lead Generation Process Lead Generation Dashboard For Tracking Conversion Rates Mockup PDF.
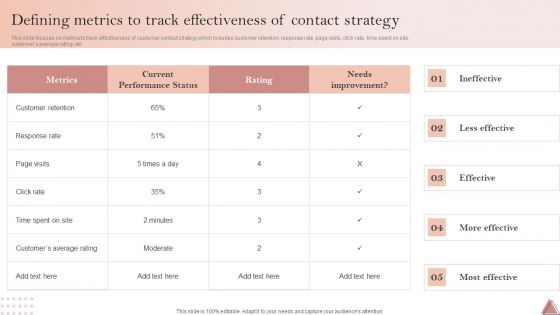
Enhancing Client Engagement Defining Metrics To Track Effectiveness Of Contact Strategy Rules PDF
This slide focuses on metrics to track effectiveness of customer contact strategy which includes customer retention, response rate, page visits, click rate, time spent on site, customers average rating, etc. Do you have to make sure that everyone on your team knows about any specific topic I yes, then you should give Enhancing Client Engagement Defining Metrics To Track Effectiveness Of Contact Strategy Rules PDF a try. Our experts have put a lot of knowledge and effort into creating this impeccable Enhancing Client Engagement Defining Metrics To Track Effectiveness Of Contact Strategy Rules PDF. You can use this template for your upcoming presentations, as the slides are perfect to represent even the tiniest detail. You can download these templates from the Slidegeeks website and these are easy to edit. So grab these today.
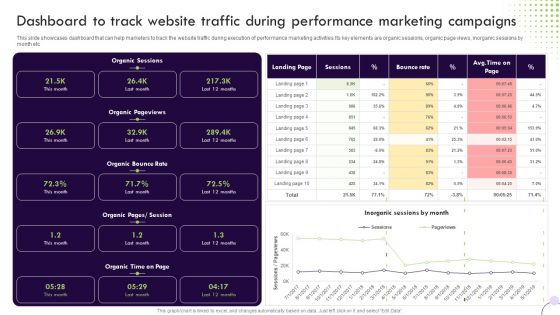
Performance Based Marketing Dashboard To Track Website Traffic During Performance Information PDF
This slide showcases dashboard that can help marketers to track the website traffic during execution of performance marketing activities.Its key elements are organic sessions, organic page views, inorganic sessions by month etc. Find highly impressive Performance Based Marketing Dashboard To Track Website Traffic During Performance Information PDF on Slidegeeks to deliver a meaningful presentation. You can save an ample amount of time using these presentation templates. No need to worry to prepare everything from scratch because Slidegeeks experts have already done a huge research and work for you. You need to download Performance Based Marketing Dashboard To Track Website Traffic During Performance Information PDF for your upcoming presentation. All the presentation templates are 100 percent editable and you can change the color and personalize the content accordingly. Download now.
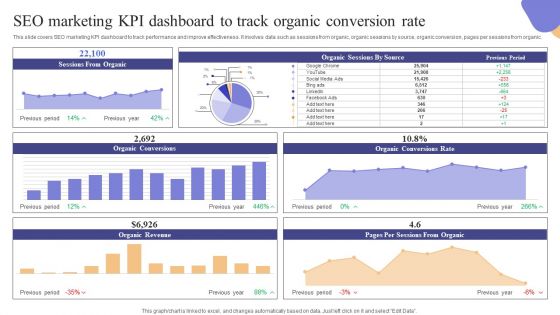
SEO Marketing KPI Dashboard To Track Organic Conversion Rate Microsoft PDF
This slide covers SEO marketing KPI dashboard to track performance and improve effectiveness. It involves data such as sessions from organic, organic sessions by source, organic conversion, pages per sessions from organic. Formulating a presentation can take up a lot of effort and time, so the content and message should always be the primary focus. The visuals of the PowerPoint can enhance the presenters message, so our SEO Marketing KPI Dashboard To Track Organic Conversion Rate Microsoft PDF was created to help save time. Instead of worrying about the design, the presenter can concentrate on the message while our designers work on creating the ideal templates for whatever situation is needed. Slidegeeks has experts for everything from amazing designs to valuable content, we have put everything into SEO Marketing KPI Dashboard To Track Organic Conversion Rate Microsoft PDF
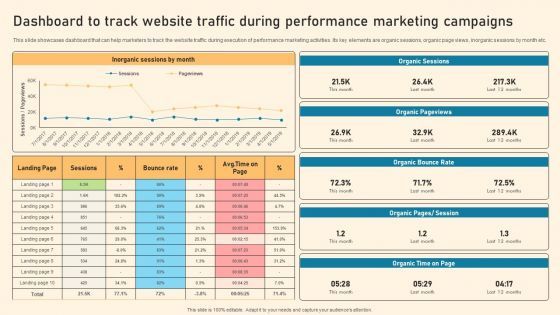
Dashboard To Track Website Traffic During Performance Marketing Campaigns Ppt PowerPoint Presentation File Slides PDF
This slide showcases dashboard that can help marketers to track the website traffic during execution of performance marketing activities. Its key elements are organic sessions, organic page views, inorganic sessions by month etc. Whether you have daily or monthly meetings, a brilliant presentation is necessary. Dashboard To Track Website Traffic During Performance Marketing Campaigns Ppt PowerPoint Presentation File Slides PDF can be your best option for delivering a presentation. Represent everything in detail using Dashboard To Track Website Traffic During Performance Marketing Campaigns Ppt PowerPoint Presentation File Slides PDF and make yourself stand out in meetings. The template is versatile and follows a structure that will cater to your requirements. All the templates prepared by Slidegeeks are easy to download and edit. Our research experts have taken care of the corporate themes as well. So, give it a try and see the results.
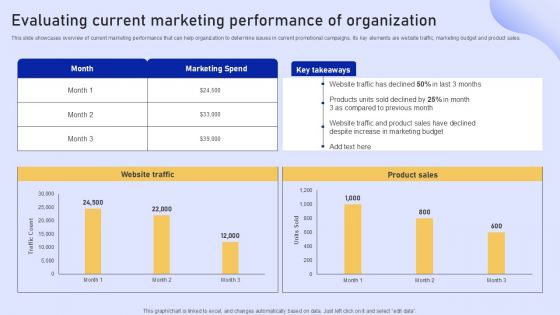
Online Marketing Strategy For Lead Generation Dashboard To Track Website Traffic During Performance Icons PDF
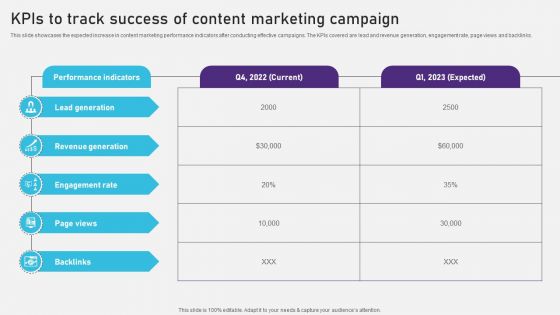
Advertising Campaign Optimization Process Kpis To Track Success Of Content Marketing Campaign Diagrams PDF
This slide showcases the expected increase in content marketing performance indicators after conducting effective campaigns. The KPIs covered are lead and revenue generation, engagement rate, page views and backlinks. Presenting this PowerPoint presentation, titled Advertising Campaign Optimization Process Kpis To Track Success Of Content Marketing Campaign Diagrams PDF, with topics curated by our researchers after extensive research. This editable presentation is available for immediate download and provides attractive features when used. Download now and captivate your audience. Presenting this Advertising Campaign Optimization Process Kpis To Track Success Of Content Marketing Campaign Diagrams PDF. Our researchers have carefully researched and created these slides with all aspects taken into consideration. This is a completely customizable Advertising Campaign Optimization Process Kpis To Track Success Of Content Marketing Campaign Diagrams PDF that is available for immediate downloading. Download now and make an impact on your audience. Highlight the attractive features available with our PPTs.
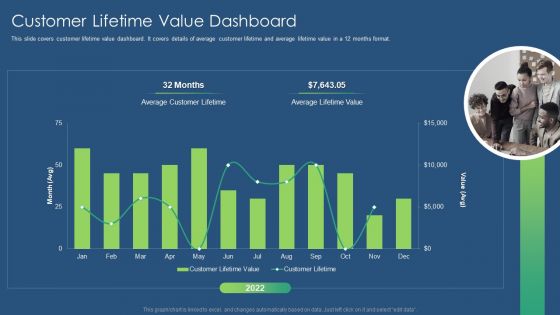
Sustainability Calculation With KPI Customer Lifetime Value Dashboard Formats PDF Professional PDF
Mentioned slide covers customer churn rate dashboard. It includes details of monthly customer churn rate, accounts opened, churned accounts demographics and churn heatmap. Deliver an awe inspiring pitch with this creative sustainability calculation with kpi customer churn rate dashboard mockup pdf bundle. Topics like customer churn rate dashboard can be discussed with this completely editable template. It is available for immediate download depending on the needs and requirements of the user.
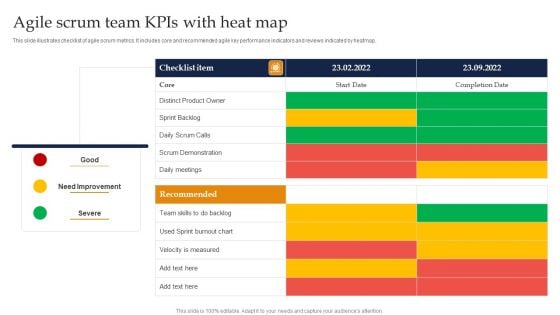
Agile Scrum Team Kpis With Heat Map Ppt Layouts Clipart Images PDF
This slide illustrates checklist of agile scrum metrics. It includes core and recommended agile key performance indicators and reviews indicated by heatmap. Pitch your topic with ease and precision using this Agile Scrum Team Kpis With Heat Map Ppt Layouts Clipart Images PDF. This layout presents information on Core, Distinct Product Owner, Scrum Demonstration. It is also available for immediate download and adjustment. So, changes can be made in the color, design, graphics or any other component to create a unique layout.
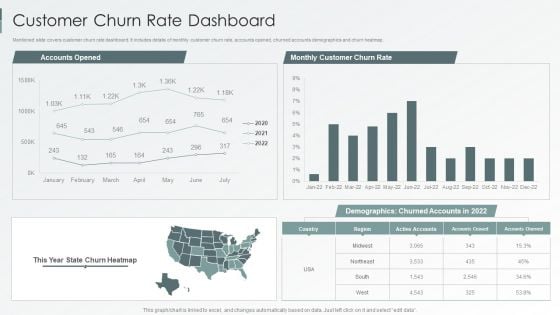
Enterprise Sustainability Performance Metrics Customer Churn Rate Dashboard Summary PDF
Mentioned slide covers customer churn rate dashboard. It includes details of monthly customer churn rate, accounts opened, churned accounts demographics and churn heatmap.Deliver an awe inspiring pitch with this creative Enterprise Sustainability Performance Metrics Customer Churn Rate Dashboard Summary PDF bundle. Topics like Accounts Opened, Demographics Churned, Monthly Customer can be discussed with this completely editable template. It is available for immediate download depending on the needs and requirements of the user.
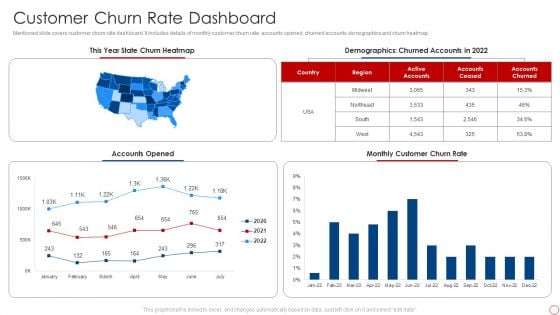
Kpis For Evaluating Business Sustainability Customer Churn Rate Dashboard Guidelines PDF
Mentioned slide covers customer churn rate dashboard. It includes details of monthly customer churn rate, accounts opened, churned accounts demographics and churn heatmap. Deliver an awe inspiring pitch with this creative Kpis For Evaluating Business Sustainability Customer Churn Rate Dashboard Guidelines PDF bundle. Topics like Accounts Opened, Monthly Customer, Churn Rate, Demographics can be discussed with this completely editable template. It is available for immediate download depending on the needs and requirements of the user.
Dashboard For Tracking Leadership Training And Development Program Progress Topics PDF
This slide illustrates dashboard for tracking leadership development program progress. It also contains information about performing leaders, competency heatmap, executive training, etc. Pitch your topic with ease and precision using this Dashboard For Tracking Leadership Training And Development Program Progress Topics PDF. This layout presents information on People Completed, Number Trainees, Leadership Training. It is also available for immediate download and adjustment. So, changes can be made in the color, design, graphics or any other component to create a unique layout.
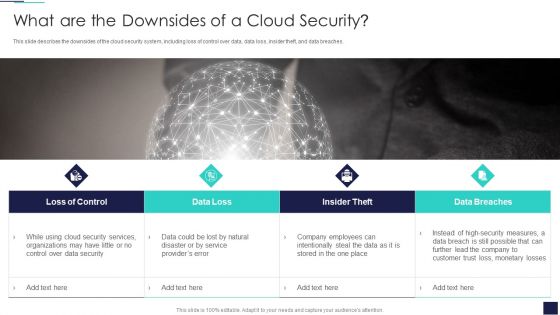
Cloud Information Security What Are The Downsides Of A Cloud Security Ppt Infographics Files PDF
This slide describes the downsides of the cloud security system, including loss of control over data, data loss, insider theft, and data breaches. Presenting Cloud Information Security What Are The Downsides Of A Cloud Security Ppt Infographics Files PDF to provide visual cues and insights. Share and navigate important information on four stages that need your due attention. This template can be used to pitch topics like Data Loss, Loss Control, Insider Theft, Data Breaches. In addtion, this PPT design contains high resolution images, graphics, etc, that are easily editable and available for immediate download.
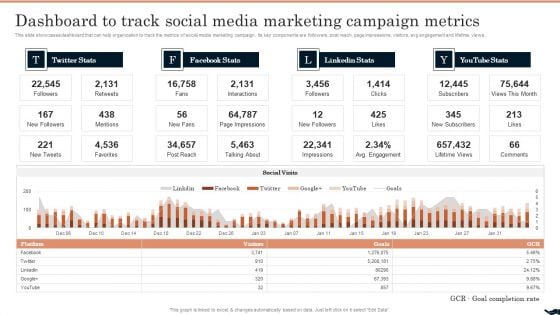
Generating Leads Through Dashboard To Track Social Media Marketing Campaign Metrics Pictures PDF
This slide showcases dashboard that can help organization to track the metrics of social media marketing campaign. Its key components are followers, post reach, page impressions, visitors, avg engagement and lifetime views. Present like a pro with Generating Leads Through Dashboard To Track Social Media Marketing Campaign Metrics Pictures PDF Create beautiful presentations together with your team, using our easy-to-use presentation slides. Share your ideas in real-time and make changes on the fly by downloading our templates. So whether youre in the office, on the go, or in a remote location, you can stay in sync with your team and present your ideas with confidence. With Slidegeeks presentation got a whole lot easier. Grab these presentations today.
Implementing Digital Marketing Group Of Metrics For Tracking Social Media Performance Graphics PDF
This slide highlights the key metrics for monitoring social media performance. Key metrics included here are page views, customer comments, likes, shares, backlinks, keyword ranking, cinversions etc. Do you have to make sure that everyone on your team knows about any specific topic I yes, then you should give Implementing Digital Marketing Group Of Metrics For Tracking Social Media Performance Graphics PDF a try. Our experts have put a lot of knowledge and effort into creating this impeccable Implementing Digital Marketing Group Of Metrics For Tracking Social Media Performance Graphics PDF. You can use this template for your upcoming presentations, as the slides are perfect to represent even the tiniest detail. You can download these templates from the Slidegeeks website and these are easy to edit. So grab these today.
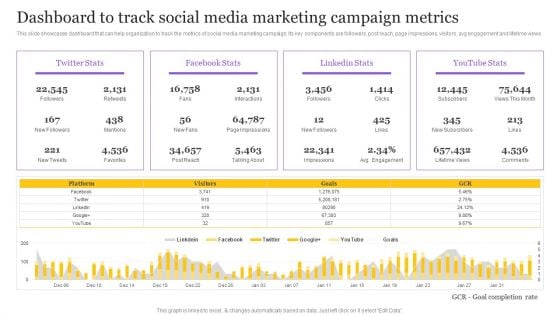
Digital Marketing Strategy Dashboard To Track Social Media Marketing Campaign Metrics Diagrams PDF
This slide showcases dashboard that can help organization to track the metrics of social media marketing campaign. Its key components are followers, post reach, page impressions, visitors, avg engagement and lifetime views. Retrieve professionally designed Digital Marketing Strategy Dashboard To Track Social Media Marketing Campaign Metrics Diagrams PDF to effectively convey your message and captivate your listeners. Save time by selecting pre-made slideshows that are appropriate for various topics, from business to educational purposes. These themes come in many different styles, from creative to corporate, and all of them are easily adjustable and can be edited quickly. Access them as PowerPoint templates or as Google Slides themes. You dont have to go on a hunt for the perfect presentation because Slidegeeks got you covered from everywhere.
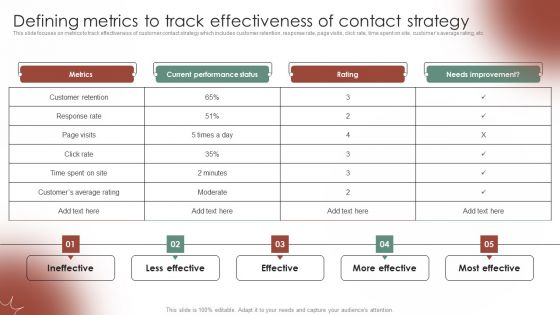
Tactical Communication Plan Defining Metrics To Track Effectiveness Of Contact Strategy Structure PDF
This slide focuses on metrics to track effectiveness of customer contact strategy which includes customer retention, response rate, page visits, click rate, time spent on site, customers average rating, etc. This modern and well-arranged Tactical Communication Plan Defining Metrics To Track Effectiveness Of Contact Strategy Structure PDF provides lots of creative possibilities. It is very simple to customize and edit with the Powerpoint Software. Just drag and drop your pictures into the shapes. All facets of this template can be edited with Powerpoint, no extra software is necessary. Add your own material, put your images in the places assigned for them, adjust the colors, and then you can show your slides to the world, with an animated slide included.
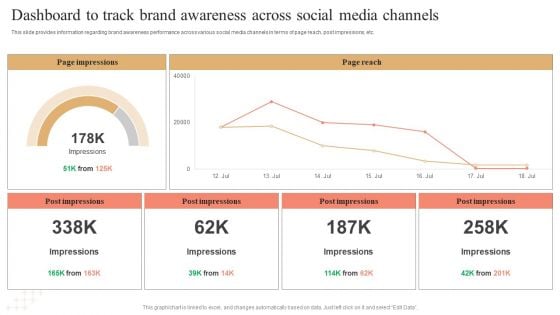
Dashboard To Track Brand Awareness Across Social Media Channels Brochure PDF
This slide provides information regarding brand awareness performance across various social media channels in terms of page reach, post impressions, etc. Explore a selection of the finest Dashboard To Track Brand Awareness Across Social Media Channels Brochure PDF here. With a plethora of professionally designed and pre-made slide templates, you can quickly and easily find the right one for your upcoming presentation. You can use our Dashboard To Track Brand Awareness Across Social Media Channels Brochure PDF to effectively convey your message to a wider audience. Slidegeeks has done a lot of research before preparing these presentation templates. The content can be personalized and the slides are highly editable. Grab templates today from Slidegeeks.
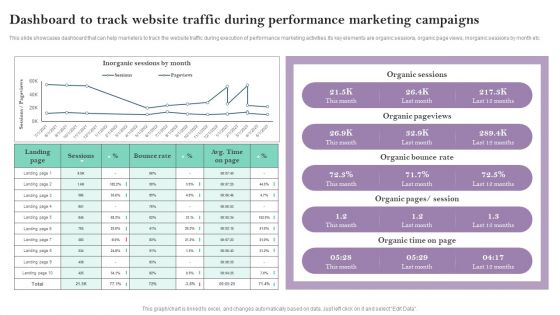
Dashboard To Track Website Traffic During Performance Marketing Campaigns Ppt PowerPoint Presentation File Example File PDF
This slide showcases dashboard that can help marketers to track the website traffic during execution of performance marketing activities.Its key elements are organic sessions, organic page views, inorganic sessions by month etc This modern and well arranged Dashboard To Track Website Traffic During Performance Marketing Campaigns Ppt PowerPoint Presentation File Example File PDF provides lots of creative possibilities. It is very simple to customize and edit with the Powerpoint Software. Just drag and drop your pictures into the shapes. All facets of this template can be edited with Powerpoint no extra software is necessary. Add your own material, put your images in the places assigned for them, adjust the colors, and then you can show your slides to the world, with an animated slide included.
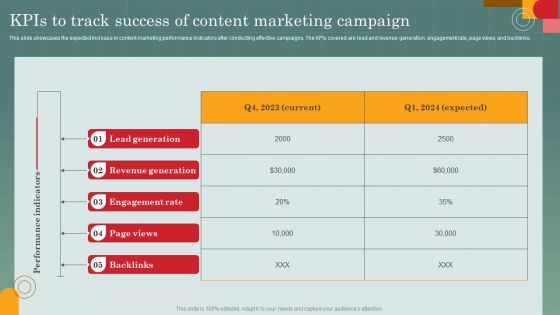
Advertising Programs Management Techniques Kpis To Track Success Of Content Marketing Campaign Mockup PDF
This slide showcases the expected increase in content marketing performance indicators after conducting effective campaigns. The KPIs covered are lead and revenue generation, engagement rate, page views and backlinks. Create an editable Advertising Programs Management Techniques Kpis To Track Success Of Content Marketing Campaign Mockup PDF that communicates your idea and engages your audience. Whether youre presenting a business or an educational presentation, pre designed presentation templates help save time. Advertising Programs Management Techniques Kpis To Track Success Of Content Marketing Campaign Mockup PDF is highly customizable and very easy to edit, covering many different styles from creative to business presentations. Slidegeeks has creative team members who have crafted amazing templates. So, go and get them without any delay.
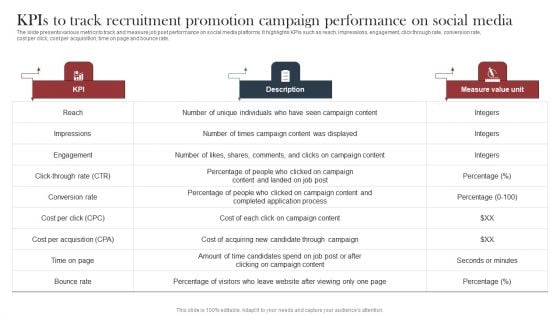
Recruitment Marketing Strategies For NPO Business Kpis Track Recruitment Promotion Campaign Performance Social Formats PDF
The slide presents various metrics to track and measure job post performance on social media platforms. It highlights KPIs such as reach, impressions, engagement, click through rate, conversion rate, cost per click, cost per acquisition, time on page and bounce rate. This Recruitment Marketing Strategies For NPO Business Kpis Track Recruitment Promotion Campaign Performance Social Formats PDF from Slidegeeks makes it easy to present information on your topic with precision. It provides customization options, so you can make changes to the colors, design, graphics, or any other component to create a unique layout. It is also available for immediate download, so you can begin using it right away. Slidegeeks has done good research to ensure that you have everything you need to make your presentation stand out. Make a name out there for a brilliant performance.
Lead Generation Dashboard For Tracking Conversion Rates Enhancing Client Lead Conversion Rates Inspiration PDF
This slide covers the KPI dashboard for tracking lead conversion rates. It includes metrics such as visitors, average session rate, per visit, bounce rate, page views, etc. Slidegeeks has constructed Lead Generation Dashboard For Tracking Conversion Rates Enhancing Client Lead Conversion Rates Inspiration PDF after conducting extensive research and examination. These presentation templates are constantly being generated and modified based on user preferences and critiques from editors. Here, you will find the most attractive templates for a range of purposes while taking into account ratings and remarks from users regarding the content. This is an excellent jumping off point to explore our content and will give new users an insight into our top notch PowerPoint Templates.
Lead Generation Dashboard For Tracking Conversion Rates Improving Lead Generation Process Background PDF
This slide covers the KPI dashboard for tracking lead conversion rates. It includes metrics such as visitors, average session rate, per visit, bounce rate, page views, etc. Slidegeeks has constructed Lead Generation Dashboard For Tracking Conversion Rates Improving Lead Generation Process Background PDF after conducting extensive research and examination. These presentation templates are constantly being generated and modified based on user preferences and critiques from editors. Here, you will find the most attractive templates for a range of purposes while taking into account ratings and remarks from users regarding the content. This is an excellent jumping off point to explore our content and will give new users an insight into our top notch PowerPoint Templates.
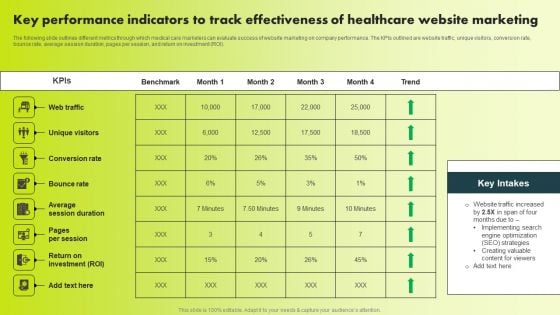
Key Performance Indicators To Track Effectiveness Of Healthcare Website Marketing Themes PDF
The following slide outlines different metrics through which medical care marketers can evaluate success of website marketing on company performance. The KPIs outlined are website traffic, unique visitors, conversion rate, bounce rate, average session duration, pages per session, and return on investment ROI. Whether you have daily or monthly meetings, a brilliant presentation is necessary. Key Performance Indicators To Track Effectiveness Of Healthcare Website Marketing Themes PDF can be your best option for delivering a presentation. Represent everything in detail using Key Performance Indicators To Track Effectiveness Of Healthcare Website Marketing Themes PDF and make yourself stand out in meetings. The template is versatile and follows a structure that will cater to your requirements. All the templates prepared by Slidegeeks are easy to download and edit. Our research experts have taken care of the corporate themes as well. So, give it a try and see the results.
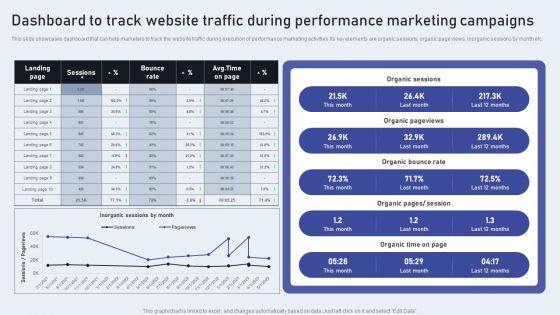
Dashboard To Track Website Traffic During Performance Marketing Campaigns Topics PDF
This slide showcases dashboard that can help marketers to track the website traffic during execution of performance marketing activities.Its key elements are organic sessions, organic page views, inorganic sessions by month etc. Slidegeeks has constructed Dashboard To Track Website Traffic During Performance Marketing Campaigns Topics PDF after conducting extensive research and examination. These presentation templates are constantly being generated and modified based on user preferences and critiques from editors. Here, you will find the most attractive templates for a range of purposes while taking into account ratings and remarks from users regarding the content. This is an excellent jumping-off point to explore our content and will give new users an insight into our top-notch PowerPoint Templates.
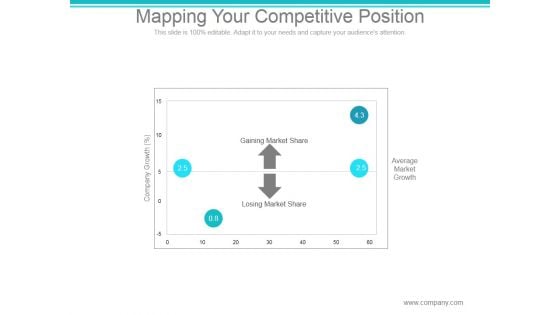
Mapping Your Competitive Position Ppt PowerPoint Presentation Files
This is a mapping your competitive position ppt powerpoint presentation files. This is a four stage process. The stages in this process are gaining market share, losing market share, company growth, average market growth.
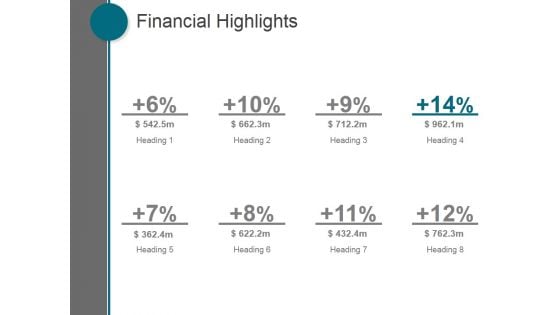
Financial Highlights Ppt PowerPoint Presentation Visual Aids
This is a financial highlights ppt powerpoint presentation visual aids. This is a eight stage process. The stages in this process are business, marketing, management, finance, strategy.
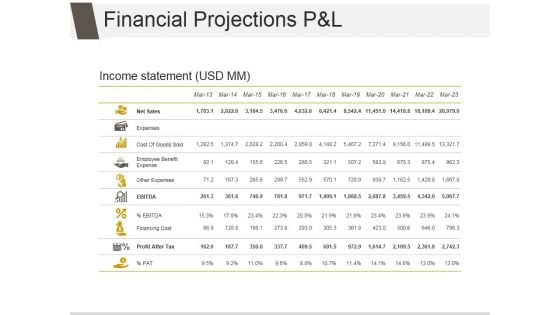
Financial Projections P And L Ppt PowerPoint Presentation Design Ideas
This is a financial projections p and l ppt powerpoint presentation design ideas. This is a eleven stage process. The stages in this process are net sales, expenses, cost of goods sold, employee benefit expense, other expenses, financing cost.
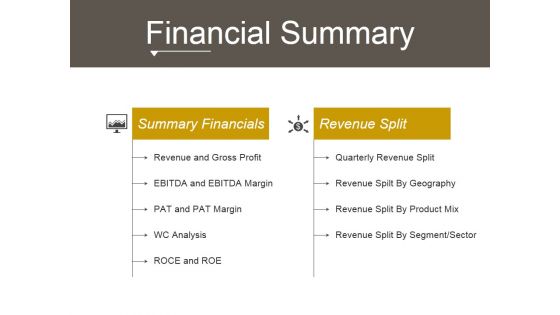
Financial Summary Ppt PowerPoint Presentation Information
This is a financial summary ppt powerpoint presentation information. This is a two stage process. The stages in this process are revenue and gross profit, quarterly revenue split, revenue spilt by geography, revenue split by product mix, revenue split by segment sector.
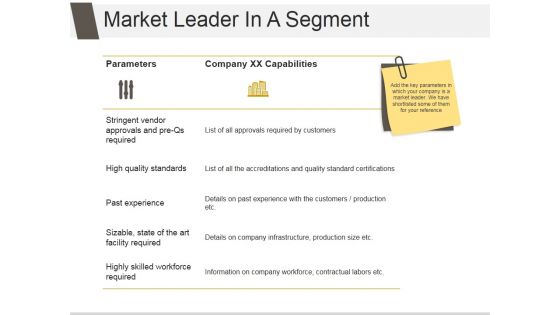
Market Leader In A Segment Ppt PowerPoint Presentation Model
This is a market leader in a segment ppt powerpoint presentation model. This is a one stage process. The stages in this process are stringent vendor approvals and pre qs required, high quality standards, past experience, sizable, state of the art facility required, highly skilled workforce required.
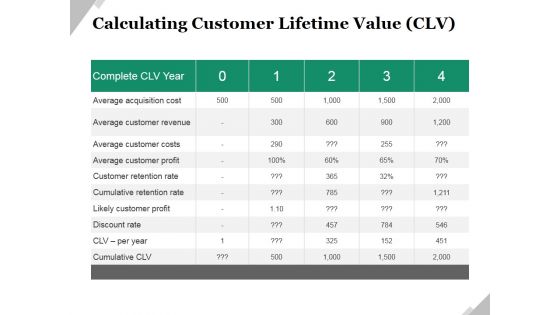
Calculating Customer Lifetime Value Clv Ppt PowerPoint Presentation Styles Good
This is a calculating customer lifetime value clv ppt powerpoint presentation styles good. This is a five stage process. The stages in this process are average acquisition cost, average customer revenue, average customer costs, average customer profit, customer retention rate, cumulative retention rate, likely customer profit.
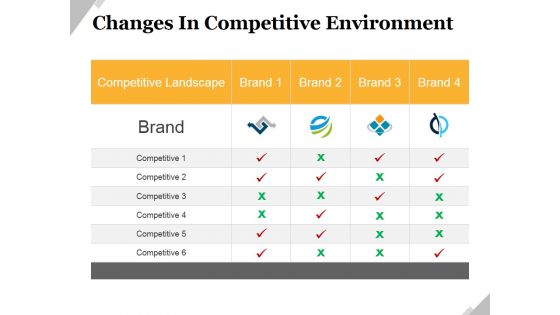
Changes In Competitive Environment Template 2 Ppt PowerPoint Presentation Professional Themes
This is a changes in competitive environment template 2 ppt powerpoint presentation professional themes. This is a four stage process. The stages in this process are brand, business, marketing, competitive landscape, growth.
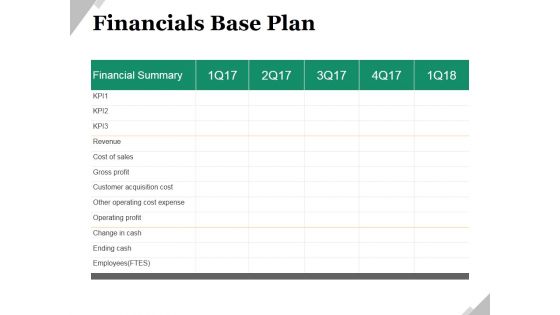
Financials Base Plan Ppt PowerPoint Presentation Model Shapes
This is a financials base plan ppt powerpoint presentation model shapes. This is a five stage process. The stages in this process are financial summary, business, marketing, revenue, cost of sales, gross profit.
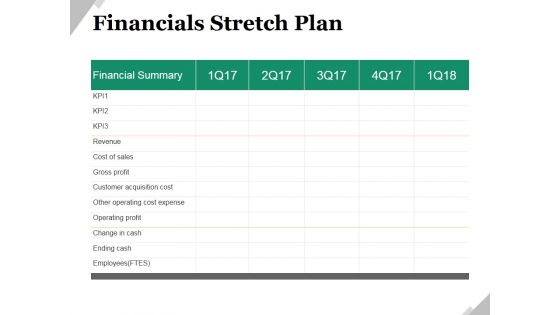
Financials Stretch Plan Ppt PowerPoint Presentation Ideas Shapes
This is a financials stretch plan ppt powerpoint presentation ideas shapes. This is a five stage process. The stages in this process are revenue, cost of sales, gross profit, customer acquisition cost, other operating cost expense, operating profit.
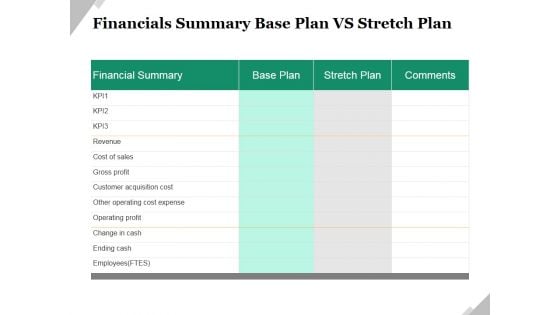
Financials Summary Base Plan Vs Stretch Plan Ppt PowerPoint Presentation Slides Information
This is a financials summary base plan vs stretch plan ppt powerpoint presentation slides information. This is a two stage process. The stages in this process are revenue, cost of sales, gross profit, customer acquisition cost, other operating cost expense, operating profit.
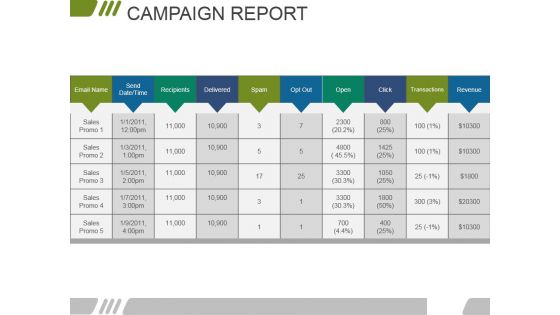
Campaign Report Ppt PowerPoint Presentation Slides Professional
This is a campaign report ppt powerpoint presentation slides professional. This is a five stage process. The stages in this process are email name, send date time, recipients, delivered, spam, opt out, open, click, transactions, revenue.

Calculating Customer Lifetime Value Clv Ppt PowerPoint Presentation Infographic Template Format
This is a calculating customer lifetime value clv ppt powerpoint presentation infographic template format. This is a five stage process. The stages in this process are average acquisition cost, average customer revenue, average customer costs, average customer profit, customer retention rate, cumulative retention rate.
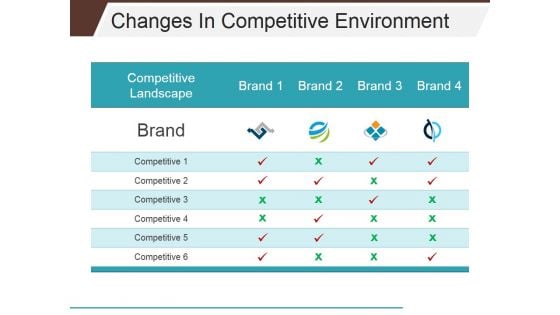
Changes In Competitive Environment Template 2 Ppt PowerPoint Presentation Outline Slideshow
This is a changes in competitive environment template 2 ppt powerpoint presentation outline slideshow. This is a four stage process. The stages in this process are business, comparison, marketing, brand, management.


 Continue with Email

 Home
Home


