data analytics
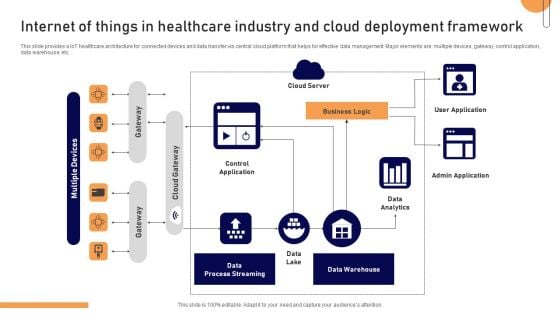
Internet Of Things In Healthcare Industry And Cloud Deployment Framework Topics PDF
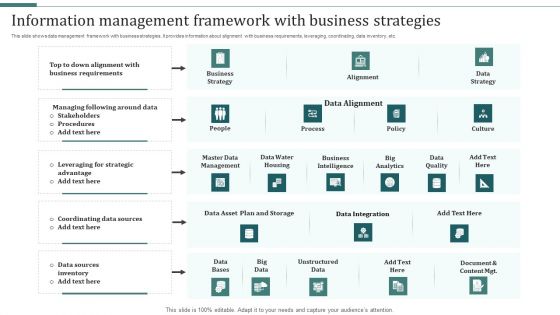
Information Management Framework With Business Strategies Infographics PDF
This slide shows data management framework with business strategies. It provides information about alignment with business requirements, leveraging, coordinating, data inventory, etc. Persuade your audience using this Information Management Framework With Business Strategies Infographics PDF. This PPT design covers five stages, thus making it a great tool to use. It also caters to a variety of topics including Master Data Management, Data Integration, Unstructured Data. Download this PPT design now to present a convincing pitch that not only emphasizes the topic but also showcases your presentation skills.
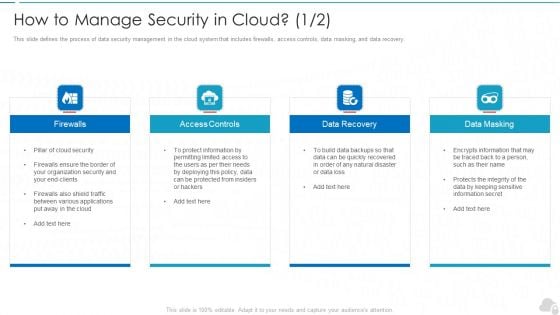
How To Manage Security In Cloud Cloud Computing Security IT Ppt Model Graphic Images PDF
This slide defines the process of data security management in the cloud system that includes firewalls, access controls, data masking, and data recovery. Presenting how to manage security in cloud cloud computing security it ppt model graphic images pdf to provide visual cues and insights. Share and navigate important information on four stages that need your due attention. This template can be used to pitch topics like firewalls, access controls, data recovery, data masking. In addtion, this PPT design contains high resolution images, graphics, etc, that are easily editable and available for immediate download.
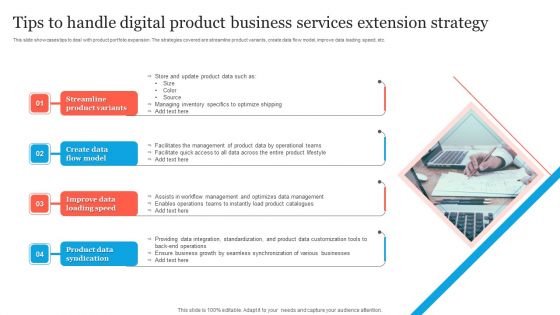
Tips To Handle Digital Product Business Services Extension Strategy Brochure PDF
This slide showcases tips to deal with product portfolio expansion. The strategies covered are streamline product variants, create data flow model, improve data loading speed, etc. Presenting Tips To Handle Digital Product Business Services Extension Strategy Brochure PDF to dispense important information. This template comprises four stages. It also presents valuable insights into the topics including Create Data Flow Model, Improve Data Loading Speed, Product Data Syndication. This is a completely customizable PowerPoint theme that can be put to use immediately. So, download it and address the topic impactfully.
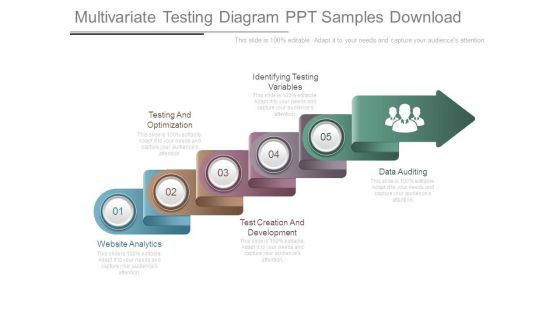
Multivariate Testing Diagram Ppt Samples Download
This is a multivariate testing diagram ppt samples download. This is a five stage process. The stages in this process are website analytics, testing and optimization, test creation and development, identifying testing variables, data auditing.
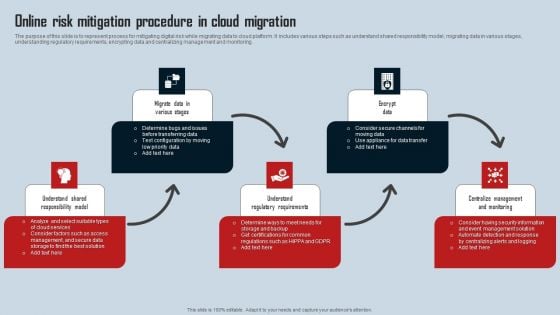
Online Risk Mitigation Procedure In Cloud Migration Mockup PDF
The purpose of this slide is to represent process for mitigating digital risk while migrating data to cloud platform. It includes various steps such as understand shared responsibility model, migrating data in various stages, understanding regulatory requirements, encrypting data and centralizing management and monitoring. Presenting Online Risk Mitigation Procedure In Cloud Migration Mockup PDF to dispense important information. This template comprises five stages. It also presents valuable insights into the topics including Migrate Data, Encrypt Data, Centralize Management Monitoring. This is a completely customizable PowerPoint theme that can be put to use immediately. So, download it and address the topic impactfully.
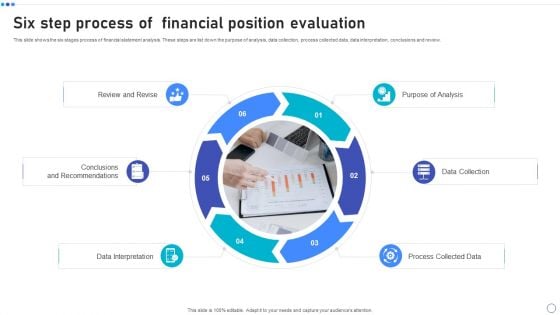
Six Step Process Of Financial Position Evaluation Ppt Infographic Template Influencers PDF
This slide shows the six stages process of financial statement analysis. These steps are list down the purpose of analysis, data collection, process collected data, data interpretation, conclusions and review. Presenting Six Step Process Of Financial Position Evaluation Ppt Infographic Template Influencers PDF to dispense important information. This template comprises six stages. It also presents valuable insights into the topics including Review And Revise, Purpose Analysis, Data Collection, Process Collected Data. This is a completely customizable PowerPoint theme that can be put to use immediately. So, download it and address the topic impactfully.
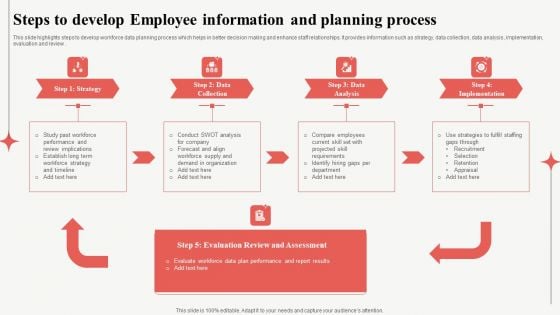
Steps To Develop Employee Information And Planning Process Professional PDF
This slide highlights steps to develop workforce data planning process which helps in better decision making and enhance staff relationships. It provides information such as strategy, data collection, data analysis, implementation, evaluation and review. Persuade your audience using this Steps To Develop Employee Information And Planning Process Professional PDF. This PPT design covers four stages, thus making it a great tool to use. It also caters to a variety of topics including Strategy, Data Collection, Data Analysis. Download this PPT design now to present a convincing pitch that not only emphasizes the topic but also showcases your presentation skills.
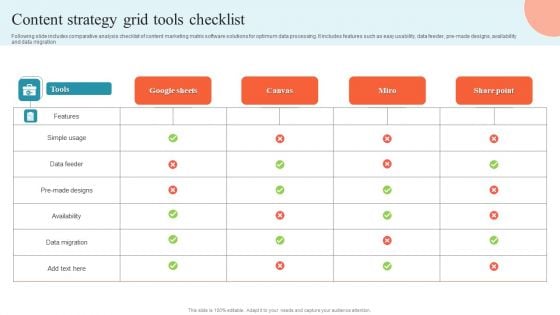
Content Strategy Grid Tools Checklist Portrait PDF
Following slide includes comparative analysis checklist of content marketing matrix software solutions for optimum data processing. It includes features such as easy usability, data feeder, pre-made designs, availability and data migration. Pitch your topic with ease and precision using this Content Strategy Grid Tools Checklist Portrait PDF. This layout presents information on Data Migration, Data Feeder, Availability . It is also available for immediate download and adjustment. So, changes can be made in the color, design, graphics or any other component to create a unique layout.
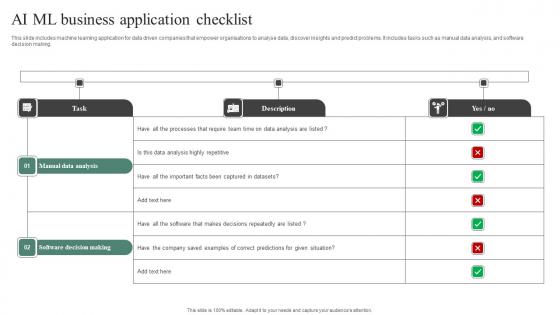
AI ML Business Application Checklist Download Pdf
This slide includes machine learning application for data driven companies that empower organisations to analyse data, discover insights and predict problems. It includes tasks such as manual data analysis, and software decision making. Showcasing this set of slides titled AI ML Business Application Checklist Download Pdf. The topics addressed in these templates are Manual Data Analysis, Software Decision Making. All the content presented in this PPT design is completely editable. Download it and make adjustments in color, background, font etc. as per your unique business setting. This slide includes machine learning application for data driven companies that empower organisations to analyse data, discover insights and predict problems. It includes tasks such as manual data analysis, and software decision making.

IOT Overview In Smart Waste Management System IOT Applications In Smart Waste IoT SS V
This slide showcases information about IoT-based smart waste management systems with a working block diagram. It includes steps such as collect smart bins data, transfer data, store data and analysis, etc. The IOT Overview In Smart Waste Management System IOT Applications In Smart Waste IoT SS V is a compilation of the most recent design trends as a series of slides. It is suitable for any subject or industry presentation, containing attractive visuals and photo spots for businesses to clearly express their messages. This template contains a variety of slides for the user to input data, such as structures to contrast two elements, bullet points, and slides for written information. Slidegeeks is prepared to create an impression. This slide showcases information about IoT-based smart waste management systems with a working block diagram. It includes steps such as collect smart bins data, transfer data, store data and analysis, etc.
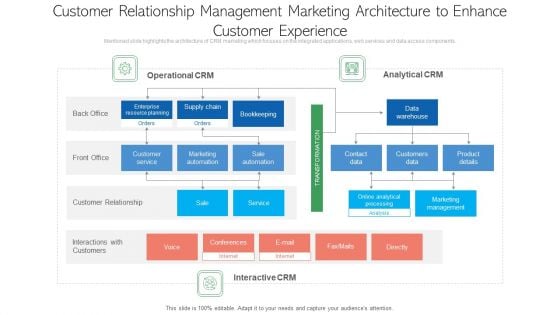
Customer Relationship Management Marketing Architecture To Enhance Customer Experience Inspiration PDF
Mentioned slide highlights the architecture of CRM marketing which focuses on the integrated applications, web services and data access components. Pitch your topic with ease and precision using this customer relationship management marketing architecture to enhance customer experience inspiration pdf. This layout presents information on operational crm, interactive crm, analytical crm. It is also available for immediate download and adjustment. So, changes can be made in the color, design, graphics or any other component to create a unique layout.
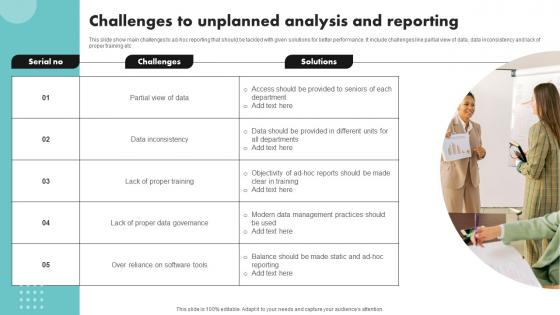
Challenges To Unplanned Analysis And Reporting Pictures Pdf
This slide show main challenges to ad-hoc reporting that should be tackled with given solutions for better performance. It include challenges like partial view of data, data inconsistency and lack of proper training etc Showcasing this set of slides titled Challenges To Unplanned Analysis And Reporting Pictures Pdf The topics addressed in these templates are Partial View Of Data, Data Inconsistency, Lack Of Proper Training All the content presented in this PPT design is completely editable. Download it and make adjustments in color, background, font etc. as per your unique business setting. This slide show main challenges to ad-hoc reporting that should be tackled with given solutions for better performance. It include challenges like partial view of data, data inconsistency and lack of proper training etc
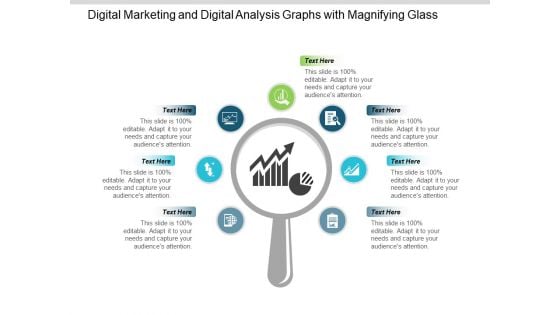
Digital Marketing And Digital Analysis Graphs With Magnifying Glass Ppt PowerPoint Presentation Portfolio Show
This is a digital marketing and digital analysis graphs with magnifying glass ppt powerpoint presentation portfolio show. This is a seven stage process. The stages in this process are digital analytics, digital dashboard, marketing.
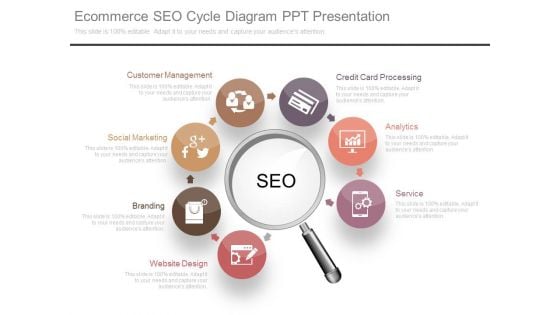
Ecommerce Seo Cycle Diagram Ppt Presentation
This is a ecommerce seo cycle diagram ppt presentation. This is a seven stage process. The stages in this process are service, analytics, credit card processing, customer management, social marketing, branding, website design.
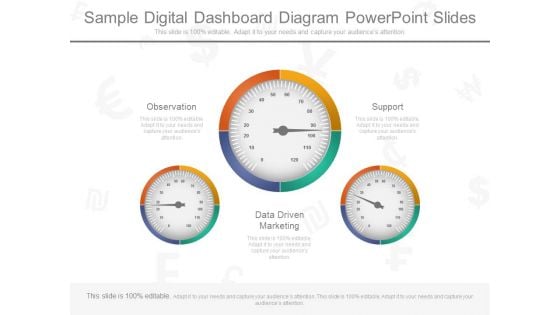
Sample Digital Dashboard Diagram Powerpoint Slides
This is a sample digital dashboard diagram powerpoint slides. This is a three stage process. The stages in this process are observation, support , data driven marketing.
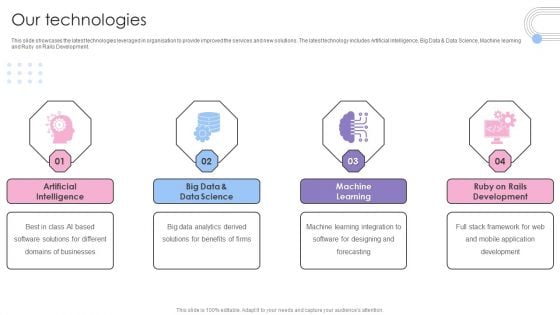
Software Products And Solutions Firm Details Our Technologies Inspiration PDF
This slide showcases the latest technologies leveraged in organisation to provide improved the services and new solutions. The latest technology includes Artificial Intelligence, Big Data and Data Science, Machine learning and Ruby on Rails Development. Presenting Software Products And Solutions Firm Details Our Technologies Inspiration PDF to provide visual cues and insights. Share and navigate important information on four stages that need your due attention. This template can be used to pitch topics like Artificial Intelligence, Big Data, Data Science, Machine Learning. In addtion, this PPT design contains high resolution images, graphics, etc, that are easily editable and available for immediate download.
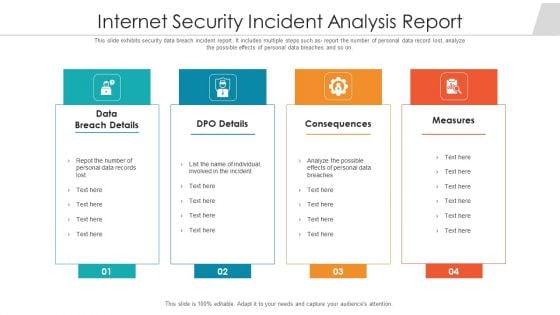
Internet Security Incident Analysis Report Template PDF
This slide exhibits security data breach incident report. It includes multiple steps such as- report the number of personal data record lost, analyze the possible effects of personal data breaches and so on. Showcasing this set of slides titled internet security incident analysis report template pdf. The topics addressed in these templates are data breach details, consequences, measures. All the content presented in this PPT design is completely editable. Download it and make adjustments in color, background, font etc. as per your unique business setting.
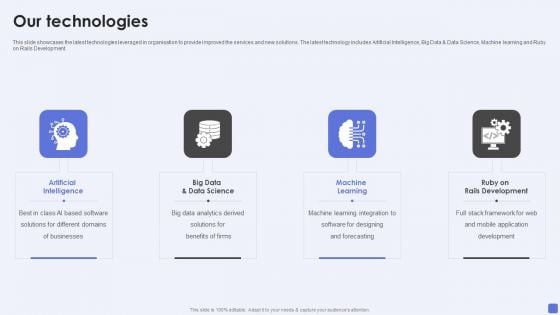
Software Services Business Profile Our Technologies Ppt PowerPoint Presentation Gallery Infographics PDF
This slide showcases the latest technologies leveraged in organisation to provide improved the services and new solutions. The latest technology includes Artificial Intelligence, Big Data and Data Science, Machine learning and Ruby on Rails Development. Presenting Software Services Business Profile Our Technologies Ppt PowerPoint Presentation Gallery Infographics PDF to provide visual cues and insights. Share and navigate important information on four stages that need your due attention. This template can be used to pitch topics like Artificial Intelligence, Big Data, Data Science, Machine Learning. In addtion, this PPT design contains high resolution images, graphics, etc, that are easily editable and available for immediate download.
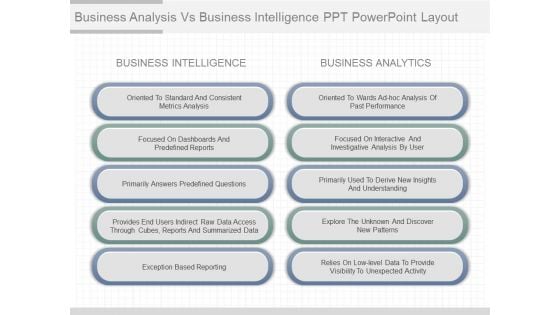
Business Analysis Vs Business Intelligence Ppt Powerpoint Layout
This is a business analysis vs business intelligence ppt powerpoint layout. This is a five stage process. The stages in this process are business intelligence, oriented to standard and consistent metrics analysis, focused on dashboards and predefined reports, primarily answers predefined questions, provides end users indirect raw data access through cubes, reports and summarized data, exception based reporting, oriented to wards ad hoc analysis of past performance, focused on interactive and investigative analysis by user, business analytics, primarily used to derive new insights and understanding, explore the unknown and discover new patterns, relies on low level data to provide visibility to unexpected activity.
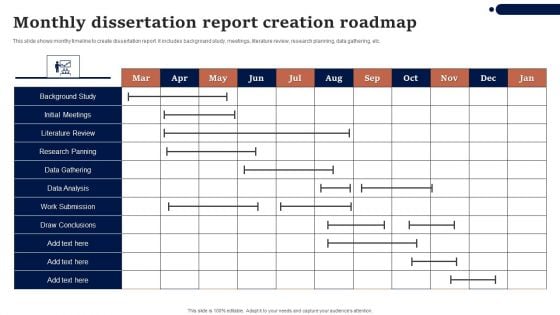
Monthly Dissertation Report Creation Roadmap Background PDF
This slide shows monthy timeline to create dissertation report. it includes background study, meetings, literature review, research planning, data gathering, etc. Pitch your topic with ease and precision using this Monthly Dissertation Report Creation Roadmap Background PDF. This layout presents information on Data Gathering, Data Analysis, Research Panning. It is also available for immediate download and adjustment. So, changes can be made in the color, design, graphics or any other component to create a unique layout.
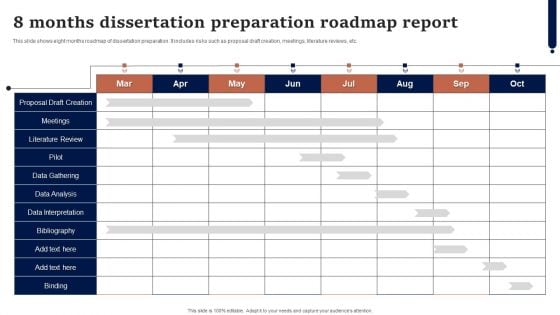
8 Months Dissertation Preparation Roadmap Report Introduction PDF
This slide shows 10 weeks dissertation report timeline. It includes various tasks such as training, database setup, data collection, data analysis, etc. Showcasing this set of slides titled 8 Months Dissertation Preparation Roadmap Report Introduction PDF. The topics addressed in these templates are Database Setup, Preparation Of Manuscript, Data Analysis. All the content presented in this PPT design is completely editable. Download it and make adjustments in color, background, font etc. as per your unique business setting.
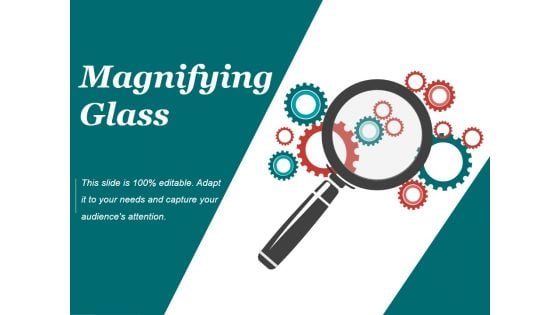
Magnifying Glass Ppt PowerPoint Presentation Information
This is a magnifying glass ppt powerpoint presentation information. This is a one stage process. The stages in this process are magnify, gears, search, big data, technology.
Monthly Sales Reporting And Projections Dashboard Icon Ppt Icon Clipart Images PDF
Persuade your audience using this Monthly Sales Reporting And Projections Dashboard Icon Ppt Icon Clipart Images PDF. This PPT design covers three stages, thus making it a great tool to use. It also caters to a variety of topics including Monthly Sale,s Reporting And Projections, Dashboard Icon. Download this PPT design now to present a convincing pitch that not only emphasizes the topic but also showcases your presentation skills.
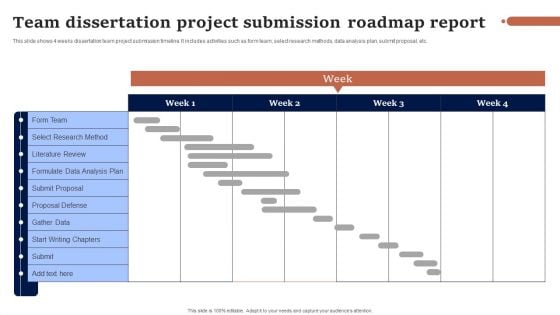
Team Dissertation Project Submission Roadmap Report Microsoft PDF
This slide shows 4 weeks dissertation team project submission timeline. It includes activities such as form team, select research methods, data analysis plan, submit proposal, etc. Pitch your topic with ease and precision using this Team Dissertation Project Submission Roadmap Report Microsoft PDF. This layout presents information on Team, Gather Data, Formulate Data Analysis Plan. It is also available for immediate download and adjustment. So, changes can be made in the color, design, graphics or any other component to create a unique layout.

Internet Security Threat Analysis Report Chart Introduction PDF
Following slide exhibits security and data breach report chart it includes major statistics such as- loss or theft of data, failure to redirect data and data posting to incorrect recipient. Pitch your topic with ease and precision using this internet security threat analysis report chart introduction pdf. This layout presents information on internet security threat analysis report chart. It is also available for immediate download and adjustment. So, changes can be made in the color, design, graphics or any other component to create a unique layout.
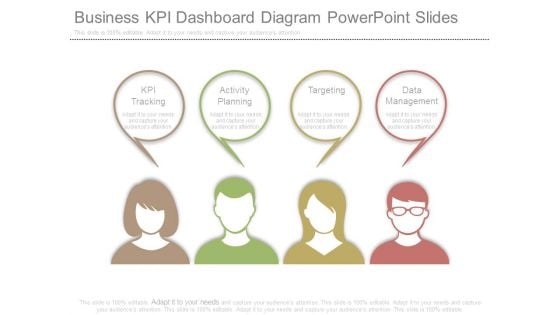
Business Kpi Dashboard Diagram Powerpoint Slides
This is a business kpi dashboard diagram powerpoint slides. This is a four stage process. The stages in this process are kpi tracking, activity planning, targeting, data management.
Business Intelligence Dashboard Icon To Analyze Industry Trends Topics PDF
Persuade your audience using this Business Intelligence Dashboard Icon To Analyze Industry Trends Topics PDF. This PPT design covers three stages, thus making it a great tool to use. It also caters to a variety of topics including Business Intelligence Dashboard Icon, Analyze Industry Trends. Download this PPT design now to present a convincing pitch that not only emphasizes the topic but also showcases your presentation skills.
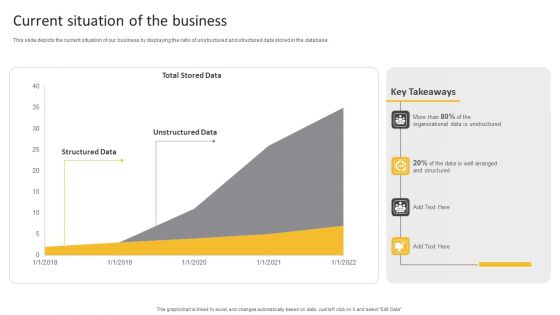
Information Science Current Situation Of The Business Ppt PowerPoint Presentation Ideas Tips PDF
This slide depicts the current situation of our business by displaying the ratio of unstructured and structured data stored in the database.Deliver an awe inspiring pitch with this creative Information Science Current Situation Of The Business Ppt PowerPoint Presentation Ideas Tips PDF bundle. Topics like Structured Data, Unstructured Data, Total Stored can be discussed with this completely editable template. It is available for immediate download depending on the needs and requirements of the user.
Consumer Partition Analysis And Reporting Icon Graphics PDF
Presenting Consumer Partition Analysis And Reporting Icon Graphics PDF to dispense important information. This template comprises four stages. It also presents valuable insights into the topics including Consumer Partition Analysis, Reporting Icon. This is a completely customizable PowerPoint theme that can be put to use immediately. So, download it and address the topic impactfully.
Analysis Of Performance Review Report Icon Sample PDF
Presenting Analysis Of Performance Review Report Icon Sample PDF to dispense important information. This template comprises four stages. It also presents valuable insights into the topics including Analysis Performance, Review Report Icon. This is a completely customizable PowerPoint theme that can be put to use immediately. So, download it and address the topic impactfully.
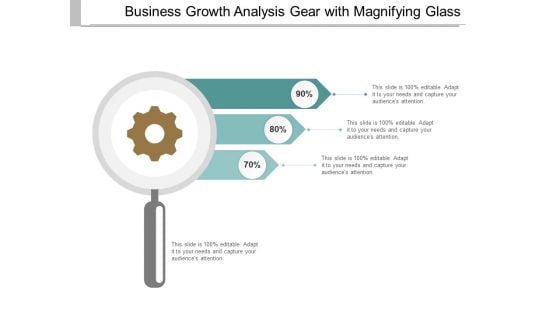
Business Growth Analysis Gear With Magnifying Glass Ppt PowerPoint Presentation Portfolio Graphics
This is a business growth analysis gear with magnifying glass ppt powerpoint presentation portfolio graphics. This is a three stage process. The stages in this process are progress report, growth report, improvement report.
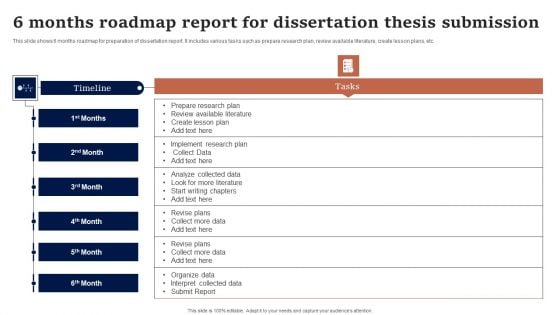
6 Months Roadmap Report For Dissertation Thesis Submission Infographics PDF
This slide shows eight months roadmap of dissertation preparation. It includes risks such as proposal draft creation, meetings, literature reviews, etc. Pitch your topic with ease and precision using this 6 Months Roadmap Report For Dissertation Thesis Submission Infographics PDF. This layout presents information on Data Gathering, Data Analysis, Data Interpretation. It is also available for immediate download and adjustment. So, changes can be made in the color, design, graphics or any other component to create a unique layout.

Corporate Intelligence Business Analysis BI Applications Ppt Gallery Background Designs PDF
Presenting corporate intelligence business analysis bi applications ppt gallery background designs pdf to provide visual cues and insights. Share and navigate important information on nine stages that need your due attention. This template can be used to pitch topics like digital dashboards, spreadsheets, data warehouse, data cleansing, data mining. In addition, this PPT design contains high-resolution images, graphics, etc, that are easily editable and available for immediate download.
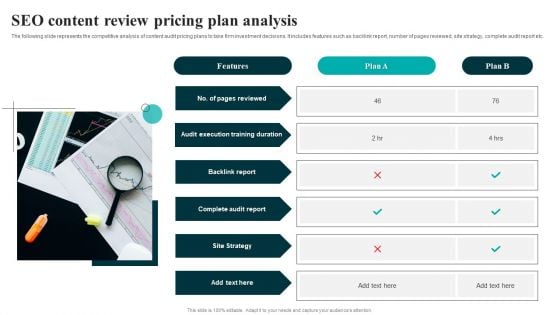
SEO Content Review Pricing Plan Analysis Slides PDF
The following slide represents the competitive analysis of content audit pricing plans to take firm investment decisions. It includes features such as backlink report, number of pages reviewed, site strategy, complete audit report etc. Presenting SEO Content Review Pricing Plan Analysis Slides PDF to dispense important information. This template comprises One stage. It also presents valuable insights into the topics including Backlink Report, Complete Audit Report, Site Strategy. This is a completely customizable PowerPoint theme that can be put to use immediately. So, download it and address the topic impactfully.
Employee Progress Reporting Procedure Icon Diagrams PDF
Persuade your audience using this Employee Progress Reporting Procedure Icon Diagrams PDF. This PPT design covers four stages, thus making it a great tool to use. It also caters to a variety of topics including Employee Progress, Reporting Procedure Icon. Download this PPT design now to present a convincing pitch that not only emphasizes the topic but also showcases your presentation skills.
Business Performance Analysis Report Vector Icon Ppt PowerPoint Presentation File Visuals PDF
Presenting business performance analysis report vector icon ppt powerpoint presentation file visuals pdf to dispense important information. This template comprises three stages. It also presents valuable insights into the topics including business performance analysis report vector icon. This is a completely customizable PowerPoint theme that can be put to use immediately. So, download it and address the topic impactfully.
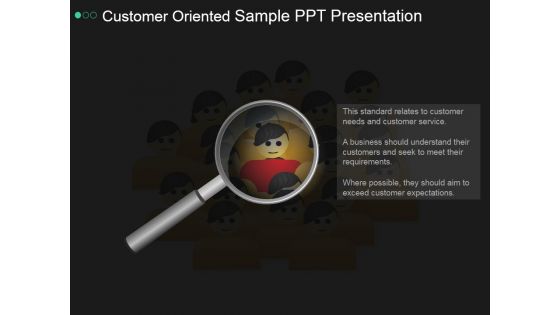
Customer Oriented Sample Ppt PowerPoint Presentation Graphics
This is a customer oriented sample ppt powerpoint presentation graphics. This is a two stage process. The stages in this process are business, marketing, big data, strategy, success, management.
Business Report Analysis Vector Icon Ppt PowerPoint Presentation Gallery Visual Aids PDF
Presenting business report analysis vector icon ppt powerpoint presentation gallery visual aids pdf to dispense important information. This template comprises three stages. It also presents valuable insights into the topics including business report analysis vector icon. This is a completely customizable PowerPoint theme that can be put to use immediately. So, download it and address the topic impactfully.
Business Reports Analysis Vector Icon Ppt PowerPoint Presentation Model Structure PDF
Persuade your audience using this business reports analysis vector icon ppt powerpoint presentation model structure pdf. This PPT design covers three stages, thus making it a great tool to use. It also caters to a variety of topics including business reports analysis vector icon. Download this PPT design now to present a convincing pitch that not only emphasizes the topic but also showcases your presentation skills.
Recruitment Report Sheet Analysis Icon To Identify Resource Gaps Clipart PDF
Persuade your audience using this Recruitment Report Sheet Analysis Icon To Identify Resource Gaps Clipart PDF. This PPT design covers Three stages, thus making it a great tool to use. It also caters to a variety of topics including Recruitment Report, Sheet Analysis, Identify Resource Gaps. Download this PPT design now to present a convincing pitch that not only emphasizes the topic but also showcases your presentation skills.
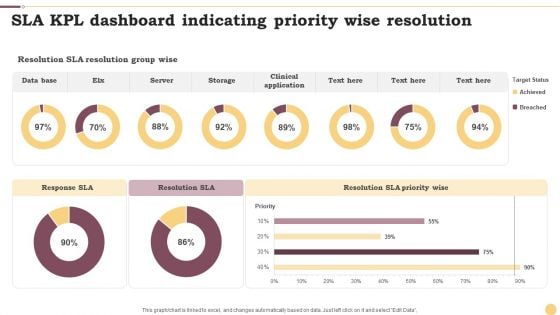
SLA KPL Dashboard Indicating Priority Wise Resolution Ppt Infographics Example File PDF
This graph or chart is linked to excel, and changes automatically based on data. Just left click on it and select Edit Data. Pitch your topic with ease and precision using this SLA KPL Dashboard Indicating Priority Wise Resolution Ppt Infographics Example File PDF. This layout presents information on Data Base, Server, Storage. It is also available for immediate download and adjustment. So, changes can be made in the color, design, graphics or any other component to create a unique layout.
Recruitment Hiring Analysis Report For New Employees Ppt PowerPoint Presentation Icon Infographics PDF
Presenting this set of slides with name recruitment hiring analysis report for new employees ppt powerpoint presentation icon infographics pdf. This is a three stage process. The stages in this process are recruitment hiring analysis report for new employees. This is a completely editable PowerPoint presentation and is available for immediate download. Download now and impress your audience.
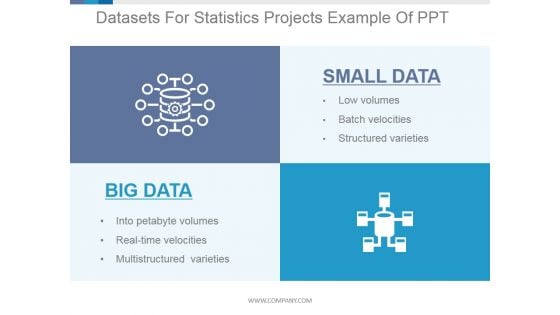
Datasets For Statistics Projects Ppt PowerPoint Presentation Tips
This is a datasets for statistics projects ppt powerpoint presentation tips. This is a two stage process. The stages in this process are small data, big data, low volumes, into petabyte volumes, batch velocities, real time velocities.
Project Status Report Icon With Magnifying Glass Infographics PDF
Persuade your audience using this Project Status Report Icon With Magnifying Glass Infographics PDF. This PPT design covers three stages, thus making it a great tool to use. It also caters to a variety of topics including Project Status, Report, Magnifying Glass. Download this PPT design now to present a convincing pitch that not only emphasizes the topic but also showcases your presentation skills.
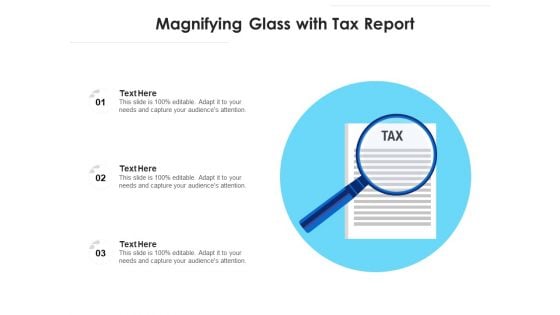
Magnifying Glass With Tax Report Ppt PowerPoint Presentation Gallery Design Templates PDF
Presenting magnifying glass with tax report ppt powerpoint presentation gallery design templates pdf to dispense important information. This template comprises three stages. It also presents valuable insights into the topics including magnifying glass with tax report. This is a completely customizable PowerPoint theme that can be put to use immediately. So, download it and address the topic impactfully.
Environmental Social And Governance Reporting Evaluation For IT Industry Icon Portrait PDF
Persuade your audience using this Environmental Social And Governance Reporting Evaluation For IT Industry Icon Portrait PDF. This PPT design covers four stages, thus making it a great tool to use. It also caters to a variety of topics including Environmental, Social, Governance Reporting Evaluation, IT Industry Icon. Download this PPT design now to present a convincing pitch that not only emphasizes the topic but also showcases your presentation skills.
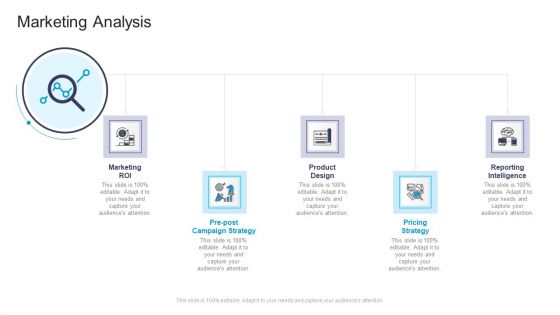
Marketing Analysis Commercial Marketing Guidelines And Tactics Infographics PDF
Presenting marketing analysis commercial marketing guidelines and tactics infographics pdf to provide visual cues and insights. Share and navigate important information on five stages that need your due attention. This template can be used to pitch topics like marketing roi, pre post campaign strategy, product design, pricing strategy, reporting intelligence. In addtion, this PPT design contains high resolution images, graphics, etc, that are easily editable and available for immediate download.
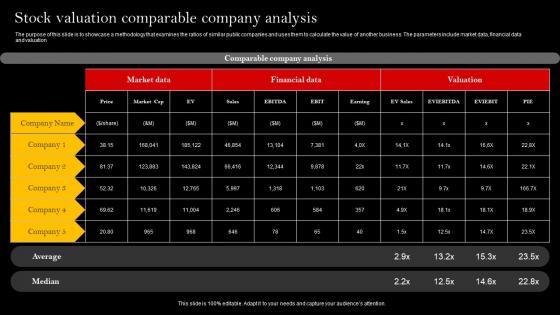
Stock Valuation Comparable Company Analysis Microsoft Pdf
The purpose of this slide is to showcase a methodology that examines the ratios of similar public companies and uses them to calculate the value of another business. The parameters include market data, financial data and valuation Pitch your topic with ease and precision using this Stock Valuation Comparable Company Analysis Microsoft Pdf This layout presents information on Market Data, Financial Data, Company Analysis It is also available for immediate download and adjustment. So, changes can be made in the color, design, graphics or any other component to create a unique layout. The purpose of this slide is to showcase a methodology that examines the ratios of similar public companies and uses them to calculate the value of another business. The parameters include market data, financial data and valuation
Statistical Analysis Procedure To Identify Problem Icon Guidelines PDF
Persuade your audience using this Statistical Analysis Procedure To Identify Problem Icon Guidelines PDF. This PPT design covers three stages, thus making it a great tool to use. It also caters to a variety of topics including Statistical Analysis Procedure, Identify Problem Icon. Download this PPT design now to present a convincing pitch that not only emphasizes the topic but also showcases your presentation skills.
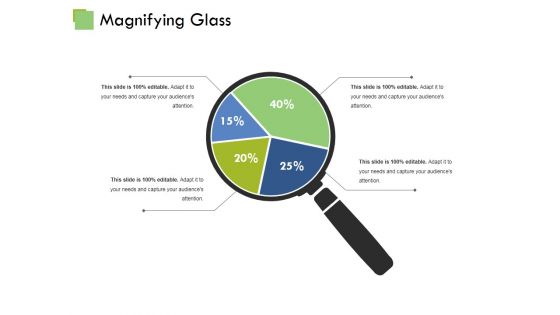
Magnifying Glass Ppt PowerPoint Presentation Inspiration Vector
This is a magnifying glass ppt powerpoint presentation inspiration vector. This is a four stage process. The stages in this process are business, marketing, strategy, technology, big data.
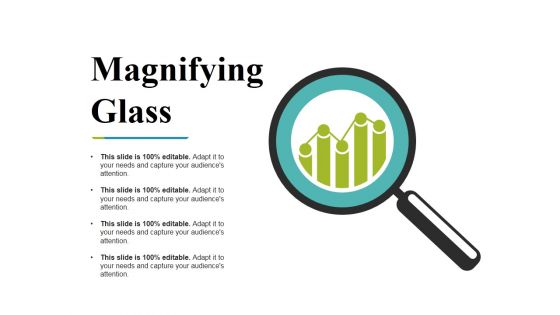
Magnifying Glass Ppt PowerPoint Presentation Gallery Display
This is a magnifying glass ppt powerpoint presentation gallery display. This is a two stage process. The stages in this process are business, marketing, strategy, technology, big data.
Project Management Dashboard Vector Icon Ppt PowerPoint Presentation Slides Files PDF
Presenting this set of slides with name project management dashboard vector icon ppt powerpoint presentation slides files pdf. This is a one stage process. The stage in this process is project management dashboard vector icon. This is a completely editable PowerPoint presentation and is available for immediate download. Download now and impress your audience.
Icon Of BI System To Enhance Processes For Statistical Analysis Ppt Ideas Elements PDF
Persuade your audience using this Icon Of BI System To Enhance Processes For Statistical Analysis Ppt Ideas Elements PDF. This PPT design covers four stages, thus making it a great tool to use. It also caters to a variety of topics including Icon, BI System, Enhance Processes, Statistical Analysis. Download this PPT design now to present a convincing pitch that not only emphasizes the topic but also showcases your presentation skills.
Consumer Statistics Analysis Vector Icon Ppt PowerPoint Presentation File Guidelines PDF
Presenting this set of slides with name consumer statistics analysis vector icon ppt powerpoint presentation file guidelines pdf. This is a three stage process. The stages in this process are consumer statistics analysis vector icon. This is a completely editable PowerPoint presentation and is available for immediate download. Download now and impress your audience.
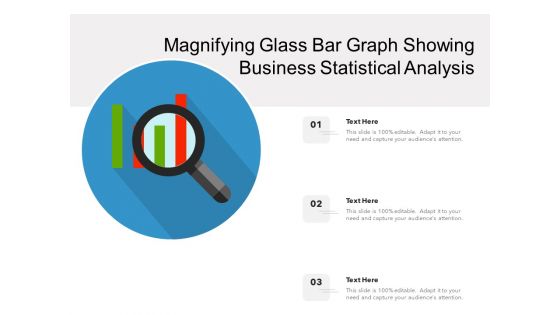
Magnifying Glass Bar Graph Showing Business Statistical Analysis Ppt PowerPoint Presentation File Sample PDF
Presenting this set of slides with name magnifying glass bar graph showing business statistical analysis ppt powerpoint presentation file sample pdf. This is a three stage process. The stages in this process are magnifying glass bar graph showing business statistical analysis. This is a completely editable PowerPoint presentation and is available for immediate download. Download now and impress your audience.
Statistical Analysis Icon With Magnifying Glass Ppt PowerPoint Presentation Gallery Clipart Images PDF
Persuade your audience using this statistical analysis icon with magnifying glass ppt powerpoint presentation gallery clipart images pdf. This PPT design covers three stages, thus making it a great tool to use. It also caters to a variety of topics including statistical analysis icon with magnifying glass. Download this PPT design now to present a convincing pitch that not only emphasizes the topic but also showcases your presentation skills.
Statistical Analysis Icon With Pie Chart Ppt PowerPoint Presentation Diagram Templates PDF
Persuade your audience using this statistical analysis icon with pie chart ppt powerpoint presentation diagram templates pdf. This PPT design covers three stages, thus making it a great tool to use. It also caters to a variety of topics including statistical analysis icon with pie chart. Download this PPT design now to present a convincing pitch that not only emphasizes the topic but also showcases your presentation skills.
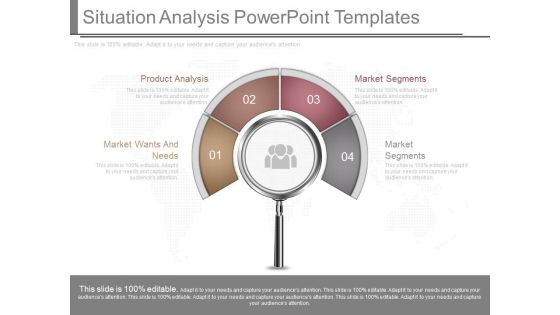
Situation Analysis Powerpoint Templates
This is a situation analysis powerpoint templates. This is a four stage process. The stages in this process are market wants and needs, product analysis, market segments.

Trend Line Technical Analysis Powerpoint Themes
This is a trend line technical analysis powerpoint themes. This is a five stage process. The stages in this process are complex systems, statistical modeling, uncertainty, lateral thinking, mathematical analysis.


 Continue with Email

 Home
Home


