data analytics

Analytics Based Metrics For Measurable Marketing Guidelines Pdf
This slide shows data driven metrics that can be used to measure productivity and results of implemented marketing strategy. It include metrics such as website traffic, return on investment and customer churn rate etc.Pitch your topic with ease and precision using this Analytics Based Metrics For Measurable Marketing Guidelines Pdf This layout presents information on Website Traffic, Return Investment, Customer Churn Rate It is also available for immediate download and adjustment. So, changes can be made in the color, design, graphics or any other component to create a unique layout. This slide shows data driven metrics that can be used to measure productivity and results of implemented marketing strategy. It include metrics such as website traffic, return on investment and customer churn rate etc.
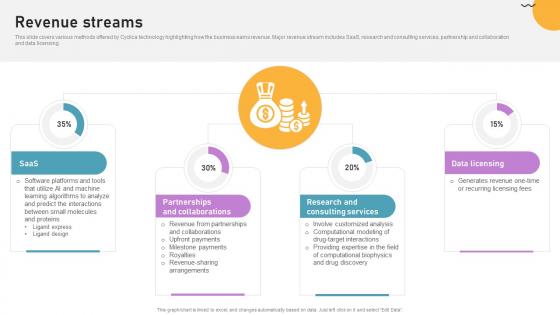
Revenue Streams Cloud Based Predictive Analytics Software Pitch Deck
This slide covers various methods offered by Cyclica technology highlighting how the business earns revenue. Major revenue stream includes SaaS, research and consulting services, partnership and collaboration and data licensing. Coming up with a presentation necessitates that the majority of the effort goes into the content and the message you intend to convey. The visuals of a PowerPoint presentation can only be effective if it supplements and supports the story that is being told. Keeping this in mind our experts created Revenue Streams Cloud Based Predictive Analytics Software Pitch Deck to reduce the time that goes into designing the presentation. This way, you can concentrate on the message while our designers take care of providing you with the right template for the situation. This slide covers various methods offered by Cyclica technology highlighting how the business earns revenue. Major revenue stream includes SaaS, research and consulting services, partnership and collaboration and data licensing.

Developing Business Analytics Framework Addressing Hyperconverged Infrastructure Graphics PDF
This slide covers details about hyperconverged infrastructure for data center management with multi cloud support, data protection and security, flexible scaling and agility and simplicity. Presenting Developing Business Analytics Framework Addressing Hyperconverged Infrastructure Graphics PDF to provide visual cues and insights. Share and navigate important information on four stages that need your due attention. This template can be used to pitch topics like Flexible Scaling, Resources Through, Resources Identifies In addtion, this PPT design contains high resolution images, graphics, etc, that are easily editable and available for immediate download.
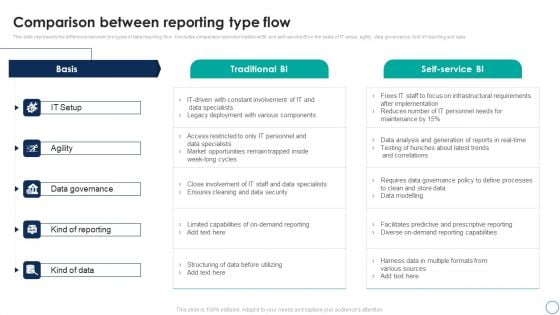
Business Analytics Application Comparison Between Reporting Type Flow Ideas PDF
This slide represents the difference between the types of data reporting flow. It includes comparison between traditional BI and self-service BI on the basis of IT setup, agility, data governance, kind of reporting and data. Are you in need of a template that can accommodate all of your creative concepts This one is crafted professionally and can be altered to fit any style. Use it with Google Slides or PowerPoint. Include striking photographs, symbols, depictions, and other visuals. Fill, move around, or remove text boxes as desired. Test out color palettes and font mixtures. Edit and save your work, or work with colleagues. Download Business Analytics Application Comparison Between Reporting Type Flow Ideas PDF and observe how to make your presentation outstanding. Give an impeccable presentation to your group and make your presentation unforgettable.
Types Of Analytics Information For Better Fleet Tracking Brochure PDF
This slide showcases categories of fleet data tracking system. This template focuses on risk assessment and increasing productivity while cutting costs. It includes information related to predictive analytics, prescriptive analytics, etc. Showcasing this set of slides titled Types Of Analytics Information For Better Fleet Tracking Brochure PDF. The topics addressed in these templates are Predictive Analytics, Descriptive Analytics, Diagnostics Analytics. All the content presented in this PPT design is completely editable. Download it and make adjustments in color, background, font etc. as per your unique business setting.
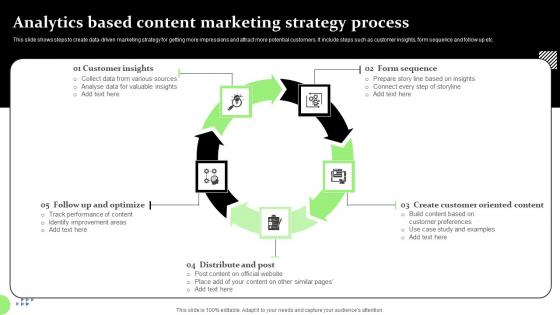
Analytics Based Content Marketing Strategy Process Professional Pdf
This slide shows steps to create data driven marketing strategy for getting more impressions and attract more potential customers. It include steps such as customer insights, form sequence and follow up etc this set of slides titled Analytics Based Content Marketing Strategy Process Professional Pdf The topics addressed in these templates are Customer Insights, Form Sequence, Customer Oriented Content All the content presented in this PPT design is completely editable. Download it and make adjustments in color, background, font etc. as per your unique business setting. This slide shows steps to create data driven marketing strategy for getting more impressions and attract more potential customers. It include steps such as customer insights, form sequence and follow up etc
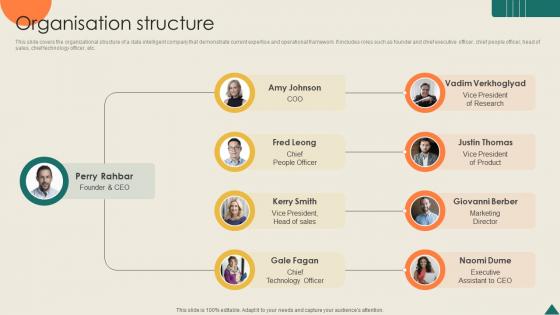
Organisation Structure Financial Analytics Platform Investor Elevator Pitch Deck
This slide covers the organizational structure of a data intelligent company that demonstrate current expertise and operational framework. It includes roles such as founder and chief executive officer, chief people officer, head of sales, chief technology officer, etc. From laying roadmaps to briefing everything in detail, our templates are perfect for you. You can set the stage with your presentation slides. All you have to do is download these easy-to-edit and customizable templates. Organisation Structure Financial Analytics Platform Investor Elevator Pitch Deck will help you deliver an outstanding performance that everyone would remember and praise you for. Do download this presentation today. This slide covers the organizational structure of a data intelligent company that demonstrate current expertise and operational framework. It includes roles such as founder and chief executive officer, chief people officer, head of sales, chief technology officer, etc.
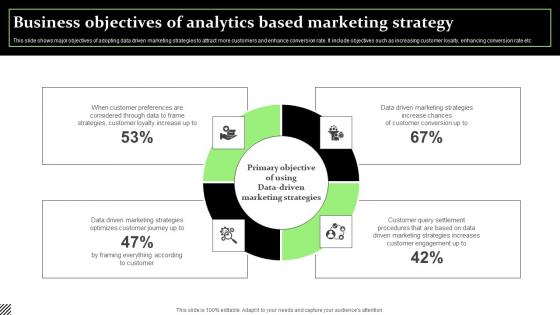
Business Objectives Of Analytics Based Marketing Strategy Formats Pdf
This slide shows major objectives of adopting data driven marketing strategies to attract more customers and enhance conversion rate. It include objectives such as increasing customer loyalty, enhancing conversion rate etc.Showcasing this set of slides titled Business Objectives Of Analytics Based Marketing Strategy Formats Pdf The topics addressed in these templates are Customer Preferences, Strategies Customer, Driven Marketing Strategies All the content presented in this PPT design is completely editable. Download it and make adjustments in color, background, font etc. as per your unique business setting. This slide shows major objectives of adopting data driven marketing strategies to attract more customers and enhance conversion rate. It include objectives such as increasing customer loyalty, enhancing conversion rate etc.
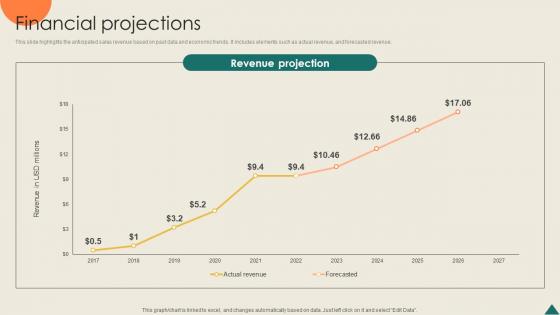
Financial Projections Financial Analytics Platform Investor Elevator Pitch Deck
This slide highlights the anticipated sales revenue based on past data and economic trends. It includes elements such as actual revenue, and forecasted revenue. Boost your pitch with our creative Financial Projections Financial Analytics Platform Investor Elevator Pitch Deck. Deliver an awe-inspiring pitch that will mesmerize everyone. Using these presentation templates you will surely catch everyones attention. You can browse the ppts collection on our website. We have researchers who are experts at creating the right content for the templates. So you do not have to invest time in any additional work. Just grab the template now and use them. This slide highlights the anticipated sales revenue based on past data and economic trends. It includes elements such as actual revenue, and forecasted revenue.
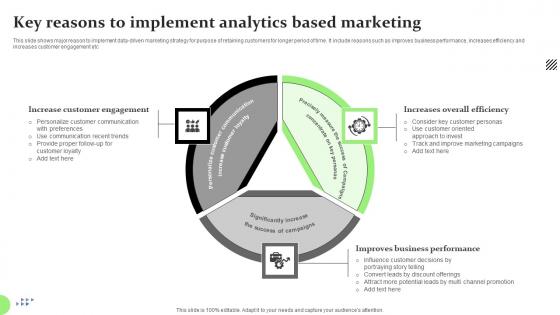
Key Reasons To Implement Analytics Based Marketing Diagrams Pdf
This slide shows major reason to implement data driven marketing strategy for purpose of retaining customers for longer period of time. It include reasons such as improves business performance, increases efficiency and increases customer engagement etc.Pitch your topic with ease and precision using this Key Reasons To Implement Analytics Based Marketing Diagrams Pdf This layout presents information on Increase Customer Engagement, Increases Overall Efficiency, Improves Business Performance It is also available for immediate download and adjustment. So, changes can be made in the color, design, graphics or any other component to create a unique layout. This slide shows major reason to implement data driven marketing strategy for purpose of retaining customers for longer period of time. It include reasons such as improves business performance, increases efficiency and increases customer engagement etc.
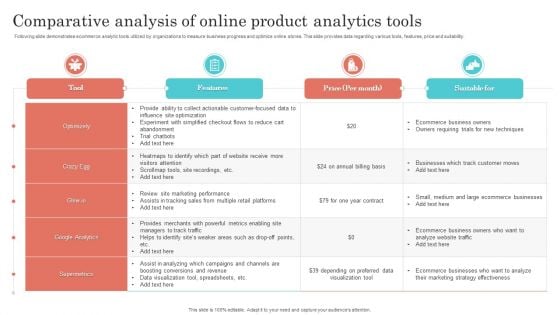
Comparative Analysis Of Online Product Analytics Tools Brochure PDF
Following slide demonstrates ecommerce analytic tools utilized by organizations to measure business progress and optimize online stores. This slide provides data regarding various tools, features, price and suitability. Showcasing this set of slides titled Comparative Analysis Of Online Product Analytics Tools Brochure PDF. The topics addressed in these templates are Optimizely, Google Analytics, Price. All the content presented in this PPT design is completely editable. Download it and make adjustments in color, background, font etc. as per your unique business setting.
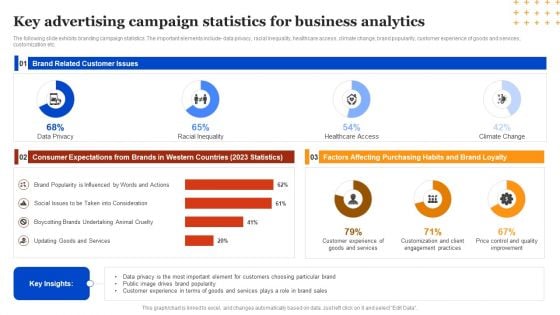
Key Advertising Campaign Statistics For Business Analytics Summary PDF
The following slide exhibits branding campaign statistics. The important elements include- data privacy, racial inequality, healthcare access, climate change, brand popularity, customer experience of goods and services, customization etc. Showcasing this set of slides titled Key Advertising Campaign Statistics For Business Analytics Summary PDF. The topics addressed in these templates are Key Insights, Analytics, Healthcare Access. All the content presented in this PPT design is completely editable. Download it and make adjustments in color, background, font etc. as per your unique business setting.
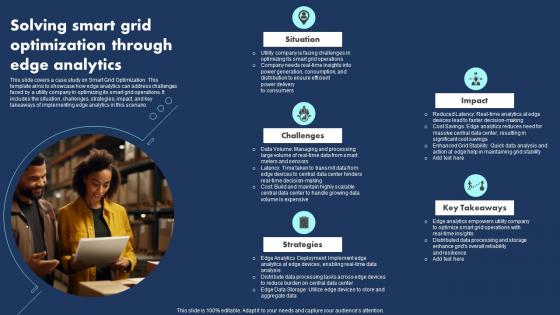
Solving Smart Grid Optimization Through Edge Analytics Pictures Pdf
This slide covers a case study on Smart Grid Optimization. This template aims to showcase how edge analytics can address challenges faced by a utility company in optimizing its smart grid operations. It includes the situation, challenges, strategies, impact, and key takeaways of implementing edge analytics in this scenario.Showcasing this set of slides titled Solving Smart Grid Optimization Through Edge Analytics Pictures Pdf The topics addressed in these templates are Deployment Implement, Distribute Data Processing, Key Takeaways All the content presented in this PPT design is completely editable. Download it and make adjustments in color, background, font etc. as per your unique business setting. This slide covers a case study on Smart Grid Optimization. This template aims to showcase how edge analytics can address challenges faced by a utility company in optimizing its smart grid operations. It includes the situation, challenges, strategies, impact, and key takeaways of implementing edge analytics in this scenario.
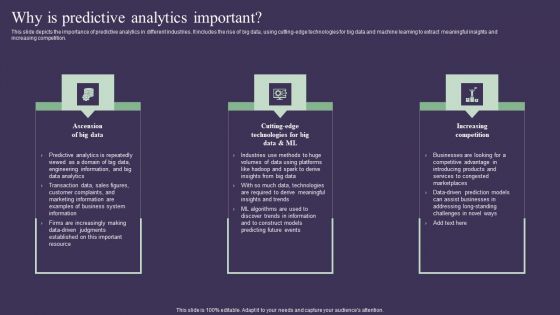
Projection Model Why Is Predictive Analytics Important Diagrams PDF
This slide depicts the importance of predictive analytics in different industries. It includes the rise of big data, using cutting-edge technologies for big data and machine learning to extract meaningful insights and increasing competition. Create an editable Projection Model Why Is Predictive Analytics Important Diagrams PDF that communicates your idea and engages your audience. Whether you are presenting a business or an educational presentation, pre-designed presentation templates help save time. Projection Model Why Is Predictive Analytics Important Diagrams PDF is highly customizable and very easy to edit, covering many different styles from creative to business presentations. Slidegeeks has creative team members who have crafted amazing templates. So, go and get them without any delay.
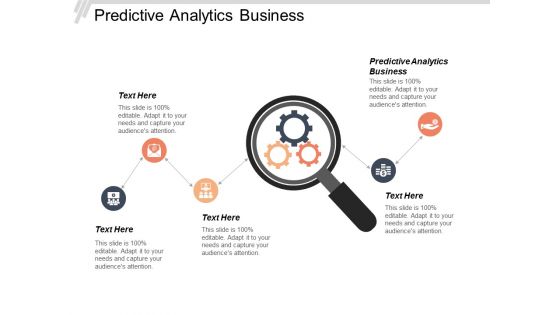
Predictive Analytics Business Ppt Powerpoint Presentation Gallery Shapes Cpb
This is a predictive analytics business ppt powerpoint presentation gallery shapes cpb. This is a five stage process. The stages in this process are predictive analytics business.
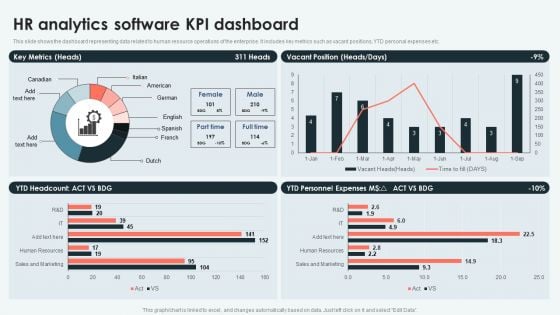
Analyzing And Deploying HR Analytics Software Kpi Dashboard Information PDF
This slide shows the dashboard representing data related to human resource operations of the enterprise. It includes key metrics such as vacant positions, YTD personal expenses etc. There are so many reasons you need a Analyzing And Deploying HR Analytics Software Kpi Dashboard Information PDF. The first reason is you cant spend time making everything from scratch, Thus, Slidegeeks has made presentation templates for you too. You can easily download these templates from our website easily.
Strategic Promotion Plan Implementation Analytics Dashboard Icons PDF
This slide illustrates graphical representation of implementation data of promotional strategy. It includes sales revenue, ad expenditure, profit etc. Showcasing this set of slides titled Strategic Promotion Plan Implementation Analytics Dashboard Icons PDF. The topics addressed in these templates are Profit, Sales Revenue, Expenditure. All the content presented in this PPT design is completely editable. Download it and make adjustments in color, background, font etc. as per your unique business setting.
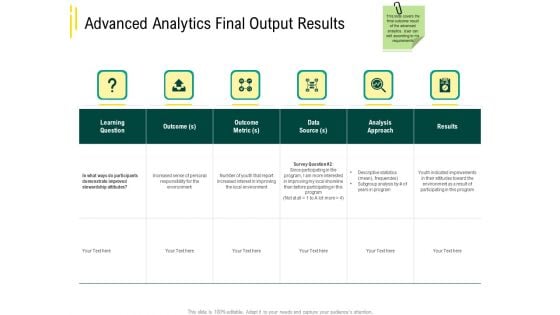
Expert Systems Advanced Analytics Final Output Results Analysis Ideas PDF
This is a expert systems advanced analytics final output results analysis ideas pdf template with various stages. Focus and dispense information on six stages using this creative set, that comes with editable features. It contains large content boxes to add your information on topics like learning question, data source, analysis approach. You can also showcase facts, figures, and other relevant content using this PPT layout. Grab it now.
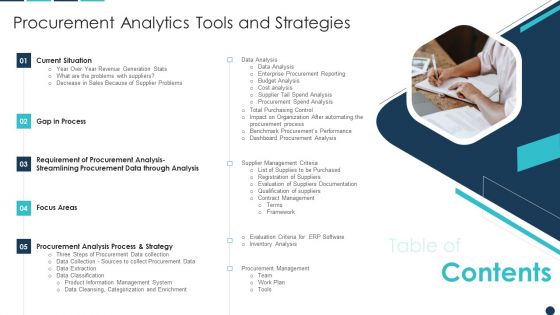
Table Of Contents Procurement Analytics Tools And Strategies Information PDF
Presenting Table Of Contents Procurement Analytics Tools And Strategies Information PDF to provide visual cues and insights. Share and navigate important information on one stage that need your due attention. This template can be used to pitch topics like Data Analysis, Enterprise Procurement, Budget Analysis. In addtion, this PPT design contains high resolution images, graphics, etc, that are easily editable and available for immediate download.
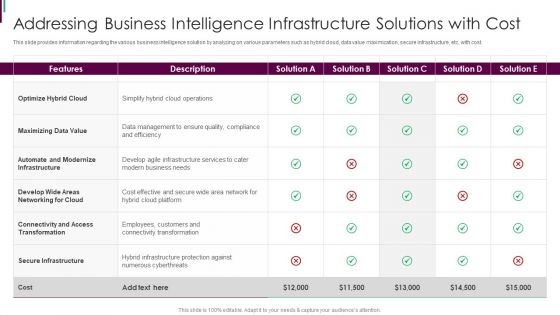
Developing Business Analytics Framework Addressing Business Intelligence Rules PDF
This slide provides information regarding the various business intelligence solution by analyzing on various parameters such as hybrid cloud, data value maximization, secure infrastructure, etc. with cost. Deliver an awe inspiring pitch with this creative Developing Business Analytics Framework Addressing Business Intelligence Rules PDF bundle. Topics like Effective Secure, Employees Customers, Connectivity Transformation can be discussed with this completely editable template. It is available for immediate download depending on the needs and requirements of the user.
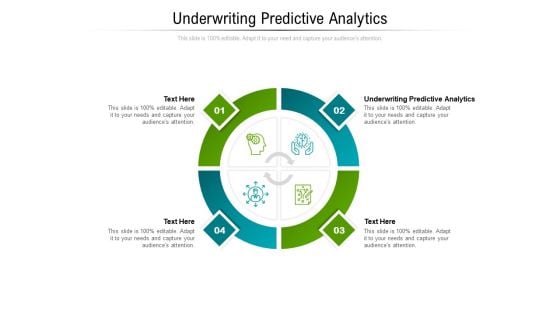
Underwriting Predictive Analytics Ppt PowerPoint Presentation File Structure Cpb Pdf
Presenting this set of slides with name underwriting predictive analytics ppt powerpoint presentation file structure cpb pdf. This is an editable Powerpoint four stages graphic that deals with topics like data wise improvement process to help convey your message better graphically. This product is a premium product available for immediate download and is 100 percent editable in Powerpoint. Download this now and use it in your presentations to impress your audience.
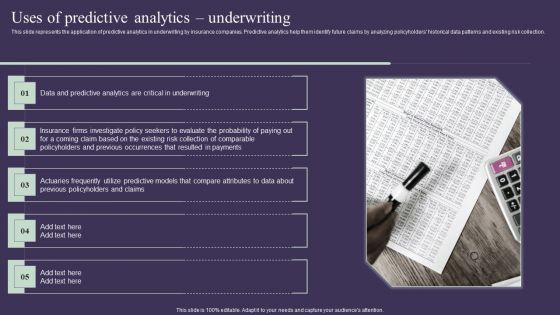
Projection Model Uses Of Predictive Analytics Underwriting Pictures PDF
This slide represents the application of predictive analytics in underwriting by insurance companies. Predictive analytics help them identify future claims by analyzing policyholders historical data patterns and existing risk collection. Boost your pitch with our creative Projection Model Uses Of Predictive Analytics Underwriting Pictures PDF. Deliver an awe-inspiring pitch that will mesmerize everyone. Using these presentation templates you will surely catch everyones attention. You can browse the ppts collection on our website. We have researchers who are experts at creating the right content for the templates. So you do not have to invest time in any additional work. Just grab the template now and use them.
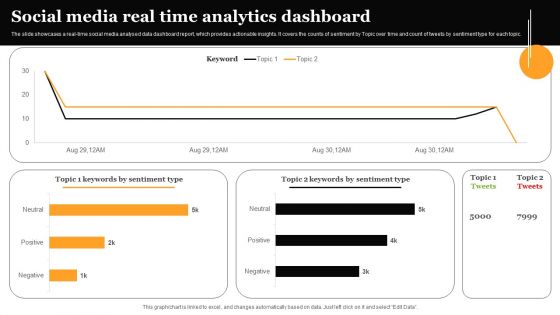
Social Media Real Time Analytics Dashboard Formats PDF
The slide showcases a real-time social media analysed data dashboard report, which provides actionable insights. It covers the counts of sentiment by Topic over time and count of tweets by sentiment type for each topic. Showcasing this set of slides titled Social Media Real Time Analytics Dashboard Formats PDF. The topics addressed in these templates are Social Media Real, Time Analytics, Dashboard. All the content presented in this PPT design is completely editable. Download it and make adjustments in color, background, font etc. as per your unique business setting.
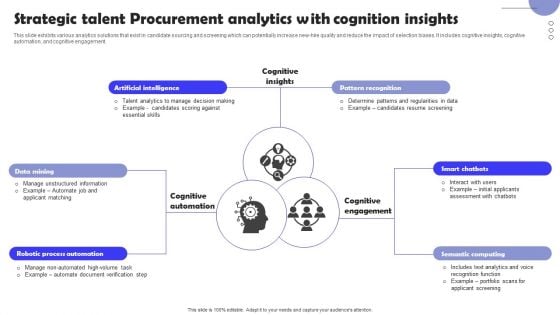
Strategic Talent Procurement Analytics With Cognition Insights Infographics PDF
This slide exhibits various analytics solutions that exist in candidate sourcing and screening which can potentially increase new-hire quality and reduce the impact of selection biases. It includes cognitive insights, cognitive automation, and cognitive engagement. Presenting Strategic Talent Procurement Analytics With Cognition Insights Infographics PDF to dispense important information. This template comprises six stages. It also presents valuable insights into the topics including Data Mining, Artificial Intelligence, Pattern Recognition, Smart Chatbots. This is a completely customizable PowerPoint theme that can be put to use immediately. So, download it and address the topic impactfully.
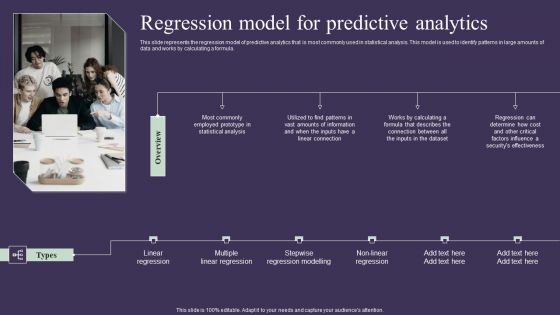
Projection Model Regression Model For Predictive Analytics Sample PDF
This slide represents the regression model of predictive analytics that is most commonly used in statistical analysis. This model is used to identify patterns in large amounts of data and works by calculating a formula. From laying roadmaps to briefing everything in detail, our templates are perfect for you. You can set the stage with your presentation slides. All you have to do is download these easy-to-edit and customizable templates. Projection Model Regression Model For Predictive Analytics Sample PDF will help you deliver an outstanding performance that everyone would remember and praise you for. Do download this presentation today.
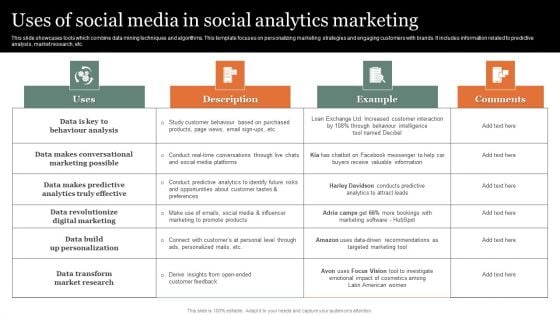
Uses Of Social Media In Social Analytics Marketing Sample PDF
This slide showcases tools which combine data mining techniques and algorithms. This template focuses on personalizing marketing strategies and engaging customers with brands. It includes information related to predictive analysis, market research, etc. Pitch your topic with ease and precision using this Uses Of Social Media In Social Analytics Marketing Sample PDF Slides. This layout presents information on Comments, Description, Analytics Marketing. It is also available for immediate download and adjustment. So, changes can be made in the color, design, graphics or any other component to create a unique layout.
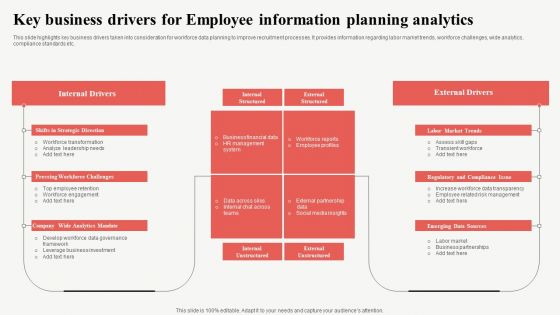
Key Business Drivers For Employee Information Planning Analytics Background PDF
This slide highlights key business drivers taken into consideration for workforce data planning to improve recruitment processes. It provides information regarding labor market trends, workforce challenges, wide analytics, compliance standards etc. Showcasing this set of slides titled Key Business Drivers For Employee Information Planning Analytics Background PDF. The topics addressed in these templates are Internal Drivers, External Drivers, Market Trends. All the content presented in this PPT design is completely editable. Download it and make adjustments in color, background, font etc. as per your unique business setting.
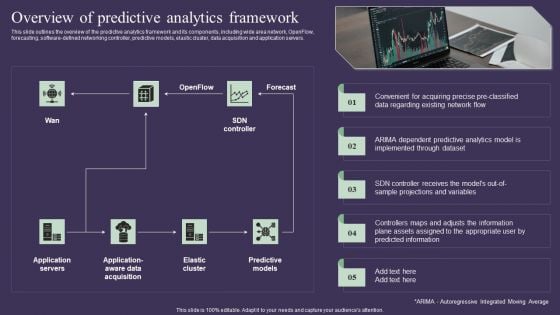
Projection Model Overview Of Predictive Analytics Framework Demonstration PDF
This slide outlines the overview of the predictive analytics framework and its components, including wide area network, OpenFlow, forecasting, software-defined networking controller, predictive models, elastic cluster, data acquisition and application servers. The best PPT templates are a great way to save time, energy, and resources. Slidegeeks have 100 percent editable powerpoint slides making them incredibly versatile. With these quality presentation templates, you can create a captivating and memorable presentation by combining visually appealing slides and effectively communicating your message. Download Projection Model Overview Of Predictive Analytics Framework Demonstration PDF from Slidegeeks and deliver a wonderful presentation.

Oracle Analytics Cloud Solutions Intelligent Insights Designs Mockup PDF
This slide describes the OAC solution with intelligent insights into business data and how it can benefit better decision making and other employees. Presenting oracle analytics cloud solutions intelligent insights designs mockup pdf to provide visual cues and insights. Share and navigate important information on five stages that need your due attention. This template can be used to pitch topics like analytics, discovery, accuracy, efficiency. In addtion, this PPT design contains high resolution images, graphics, etc, that are easily editable and available for immediate download.
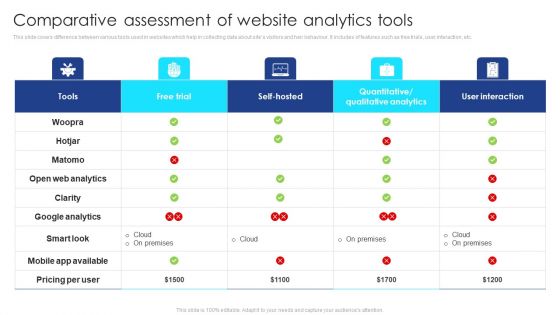
Comparative Assessment Of Website Analytics Tools Infographics PDF
This slide covers difference between various tools used in websites which help in collecting data about sites visitors and heir behaviour. It includes of features such as free trials, user interaction, etc. Pitch your topic with ease and precision using this Comparative Assessment Of Website Analytics Tools Infographics PDF. This layout presents information on Tools, Free Trial, Self-Hosted, Quantitative Or Qualitative Analytics, User Interaction. It is also available for immediate download and adjustment. So, changes can be made in the color, design, graphics or any other component to create a unique layout.
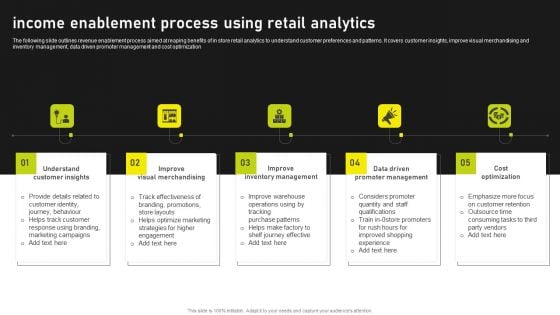
Income Enablement Process Using Retail Analytics Template PDF
The following slide outlines revenue enablement process aimed at reaping benefits of in store retail analytics to understand customer preferences and patterns. It covers customer insights, improve visual merchandising and inventory management, data driven promoter management and cost optimization. Presenting Income Enablement Process Using Retail Analytics Template PDF to dispense important information. This template comprises five stages. It also presents valuable insights into the topics including Improve Visual Merchandising, Understand Customer Insights, Improve Inventory Management. This is a completely customizable PowerPoint theme that can be put to use immediately. So, download it and address the topic impactfully.
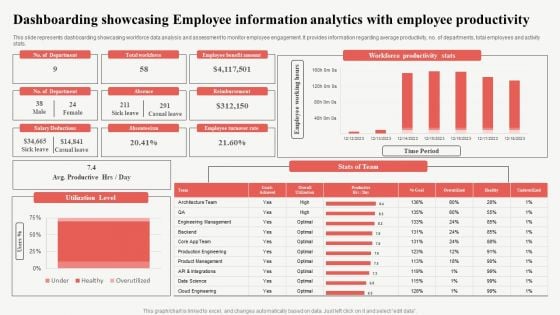
Dashboarding Showcasing Employee Information Analytics With Employee Productivity Slides PDF
This slide represents dashboarding showcasing workforce data analysis and assessment to monitor employee engagement. It provides information regarding average productivity, no. of departments, total employees and activity stats. Pitch your topic with ease and precision using this Dashboarding Showcasing Employee Information Analytics With Employee Productivity Slides PDF. This layout presents information on Reimbursement, Productive, Workforce Productivity Stats. It is also available for immediate download and adjustment. So, changes can be made in the color, design, graphics or any other component to create a unique layout.
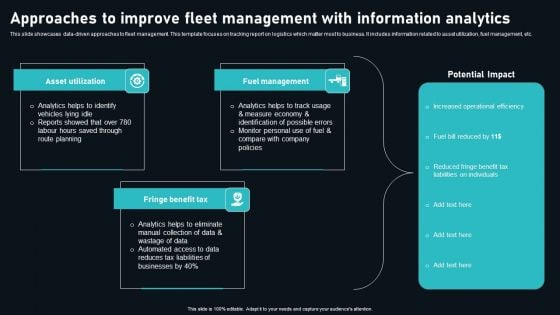
Approaches To Improve Fleet Management With Information Analytics Sample PDF
This slide showcases data driven approaches to fleet management. This template focuses on tracking report on logistics which matter most to business. It includes information related to asset utilization, fuel management, etc. Presenting Approaches To Improve Fleet Management With Information Analytics Sample PDF to dispense important information. This template comprises three stages. It also presents valuable insights into the topics including Asset Utilization, Fuel Management, Fringe Benefit Tax. This is a completely customizable PowerPoint theme that can be put to use immediately. So, download it and address the topic impactfully.
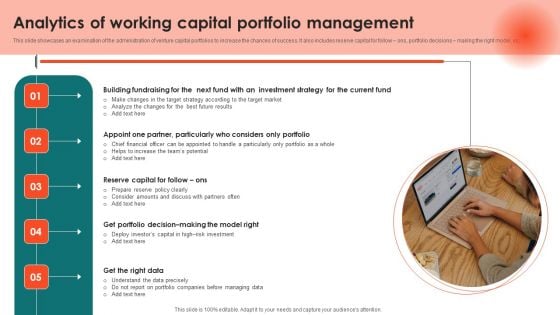
Analytics Of Working Capital Portfolio Management Rules PDF
This slide showcases an examination of the administration of venture capital portfolios to increase the chances of success. It also includes reserve capital for follow ons, portfolio decisions making the right model, etc. Presenting Analytics Of Working Capital Portfolio Management Rules PDF to dispense important information. This template comprises five stages. It also presents valuable insights into the topics including Building Fundraising, Partner, Particularly, Right Data This is a completely customizable PowerPoint theme that can be put to use immediately. So, download it and address the topic impactfully.
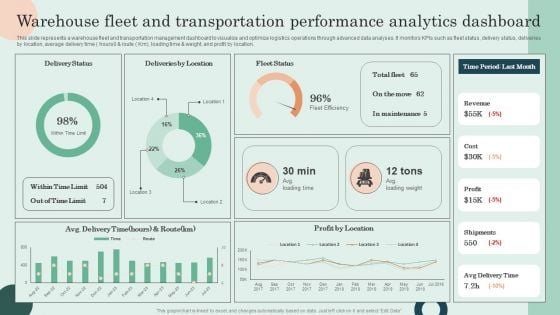
Warehouse Fleet And Transportation Performance Analytics Dashboard Pictures PDF
This slide represents a warehouse fleet and transportation management dashboard to visualize and optimize logistics operations through advanced data analyses. It monitors KPIs such as fleet status, delivery status, deliveries by location, average delivery time hours0 and route Km, loading time and weight, and profit by location. Do you have to make sure that everyone on your team knows about any specific topic I yes, then you should give Warehouse Fleet And Transportation Performance Analytics Dashboard Pictures PDF a try. Our experts have put a lot of knowledge and effort into creating this impeccable Warehouse Fleet And Transportation Performance Analytics Dashboard Pictures PDF. You can use this template for your upcoming presentations, as the slides are perfect to represent even the tiniest detail. You can download these templates from the Slidegeeks website and these are easy to edit. So grab these today
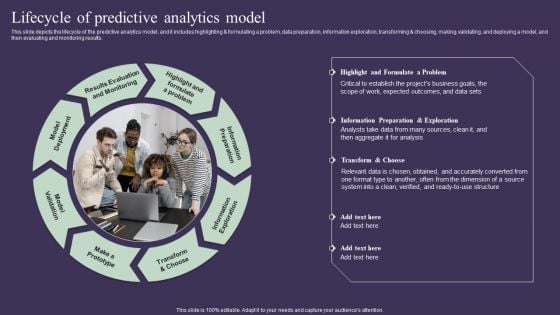
Projection Model Lifecycle Of Predictive Analytics Model Demonstration PDF
This slide depicts the lifecycle of the predictive analytics model, and it includes highlighting and formulating a problem, data preparation, information exploration, transforming and choosing, making, validating, and deploying a model, and then evaluating and monitoring results. Coming up with a presentation necessitates that the majority of the effort goes into the content and the message you intend to convey. The visuals of a PowerPoint presentation can only be effective if it supplements and supports the story that is being told. Keeping this in mind our experts created Projection Model Lifecycle Of Predictive Analytics Model Demonstration PDF to reduce the time that goes into designing the presentation. This way, you can concentrate on the message while our designers take care of providing you with the right template for the situation.

Projection Model Roadmap For Predictive Analytics Model Development Introduction PDF
This slide represents the roadmap for predictive analytics model development, including the steps to be performed in the process, such as highlighting and formulating a problem, data preparation, information exploration, transforming and choosing, making, validating, and so on. Present like a pro with Projection Model Roadmap For Predictive Analytics Model Development Introduction PDF Create beautiful presentations together with your team, using our easy-to-use presentation slides. Share your ideas in real-time and make changes on the fly by downloading our templates. So whether you are in the office, on the go, or in a remote location, you can stay in sync with your team and present your ideas with confidence. With Slidegeeks presentation got a whole lot easier. Grab these presentations today.
Analytics Company Investor Funding Elevator Pitch Deck Ppt Template
Projection Model Uses Of Predictive Analytics Credit Icons PDF
This slide describes the usage of predictive analytics in banking and other financial institutions for credit purposes. It is used to calculate the credit score of a person or organization and to ensure that borrower does not fail to return the loan. Crafting an eye-catching presentation has never been more straightforward. Let your presentation shine with this tasteful yet straightforward Projection Model Uses Of Predictive Analytics Credit Icons PDF template. It offers a minimalistic and classy look that is great for making a statement. The colors have been employed intelligently to add a bit of playfulness while still remaining professional. Construct the ideal Projection Model Uses Of Predictive Analytics Credit Icons PDF that effortlessly grabs the attention of your audience Begin now and be certain to wow your customers
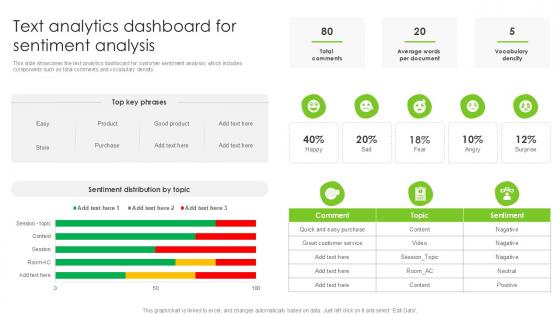
Text Analytics Dashboard For Sentiment Analysis PPT Template SS
This slide showcases the text analytics dashboard for customer sentiment analysis, which includes components such as total comments and vocabulary density. Here you can discover an assortment of the finest PowerPoint and Google Slides templates. With these templates, you can create presentations for a variety of purposes while simultaneously providing your audience with an eye-catching visual experience. Download Text Analytics Dashboard For Sentiment Analysis PPT Template SS to deliver an impeccable presentation. These templates will make your job of preparing presentations much quicker, yet still, maintain a high level of quality. Slidegeeks has experienced researchers who prepare these templates and write high-quality content for you. Later on, you can personalize the content by editing the Text Analytics Dashboard For Sentiment Analysis PPT Template SS. This slide showcases the text analytics dashboard for customer sentiment analysis, which includes components such as total comments and vocabulary density.
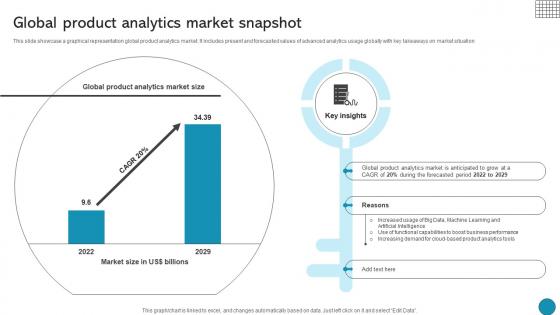
Global Product Analytics Market Snapshot Driving Business Success Integrating Product
This slide showcase a graphical representation global product analytics market. It includes present and forecasted values of advanced analytics usage globally with key takeaways on market situationThis modern and well-arranged Global Product Analytics Market Snapshot Driving Business Success Integrating Product provides lots of creative possibilities. It is very simple to customize and edit with the Powerpoint Software. Just drag and drop your pictures into the shapes. All facets of this template can be edited with Powerpoint, no extra software is necessary. Add your own material, put your images in the places assigned for them, adjust the colors, and then you can show your slides to the world, with an animated slide included. This slide showcase a graphical representation global product analytics market. It includes present and forecasted values of advanced analytics usage globally with key takeaways on market situation
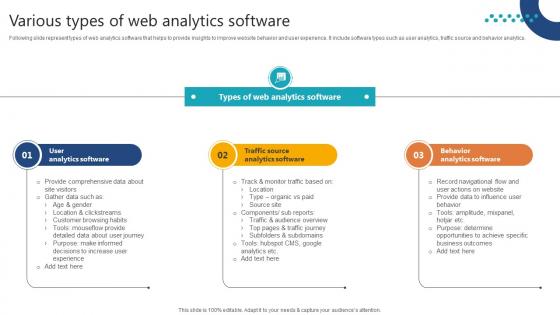
Complete Guide To Launch Various Types Of Web Analytics Software
Following slide represent types of web analytics software that helps to provide insights to improve website behavior and user experience. It include software types such as user analytics, traffic source and behavior analytics. Coming up with a presentation necessitates that the majority of the effort goes into the content and the message you intend to convey. The visuals of a PowerPoint presentation can only be effective if it supplements and supports the story that is being told. Keeping this in mind our experts created Complete Guide To Launch Various Types Of Web Analytics Software to reduce the time that goes into designing the presentation. This way, you can concentrate on the message while our designers take care of providing you with the right template for the situation. Following slide represent types of web analytics software that helps to provide insights to improve website behavior and user experience. It include software types such as user analytics, traffic source and behavior analytics.
Icon Showing Developing Statistical Capabilities Analytics Ppt Model Show PDF
Pitch your topic with ease and precision using this Icon Showing Developing Statistical Capabilities Analytics Ppt Model Show PDF. This layout presents information on Icon Showing, Developing Statistical, Capabilities Analytics. It is also available for immediate download and adjustment. So, changes can be made in the color, design, graphics or any other component to create a unique layout. Our Icon Showing Developing Statistical Capabilities Analytics Ppt Model Show PDF are topically designed to provide an attractive backdrop to any subject. Use them to look like a presentation pro.

Timeline For Effective Text Analytics Integration PPT Presentation SS
This slide outlines the timeline for integrating text analytics into business, covering project kickoff and planning, infrastructure setup, skill assessment and training, etc. Presenting this PowerPoint presentation, titled Timeline For Effective Text Analytics Integration PPT Presentation SS, with topics curated by our researchers after extensive research. This editable presentation is available for immediate download and provides attractive features when used. Download now and captivate your audience. Presenting this Timeline For Effective Text Analytics Integration PPT Presentation SS. Our researchers have carefully researched and created these slides with all aspects taken into consideration. This is a completely customizable Timeline For Effective Text Analytics Integration PPT Presentation SS that is available for immediate downloading. Download now and make an impact on your audience. Highlight the attractive features available with our PPTs. This slide outlines the timeline for integrating text analytics into business, covering project kickoff and planning, infrastructure setup, skill assessment and training, etc.
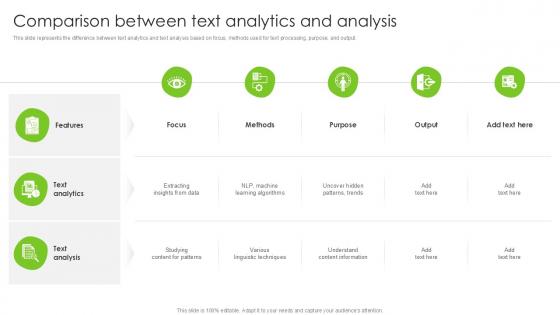
Comparison Between Text Analytics And Analysis PPT Presentation SS
This slide represents the difference between text analytics and text analysis based on focus, methods used for text processing, purpose, and output. Make sure to capture your audiences attention in your business displays with our gratis customizable Comparison Between Text Analytics And Analysis PPT Presentation SS. These are great for business strategies, office conferences, capital raising or task suggestions. If you desire to acquire more customers for your tech business and ensure they stay satisfied, create your own sales presentation with these plain slides. This slide represents the difference between text analytics and text analysis based on focus, methods used for text processing, purpose, and output.
Analytics Icon For New Product Launch Performance Themes Pdf
Showcasing this set of slides titled Analytics Icon For New Product Launch Performance Themes Pdf. The topics addressed in these templates are Analytics Icon, Product Launch Performance. All the content presented in this PPT design is completely editable. Download it and make adjustments in color, background, font etc. as per your unique business setting. Our Analytics Icon For New Product Launch Performance Themes Pdf are topically designed to provide an attractive backdrop to any subject. Use them to look like a presentation pro.
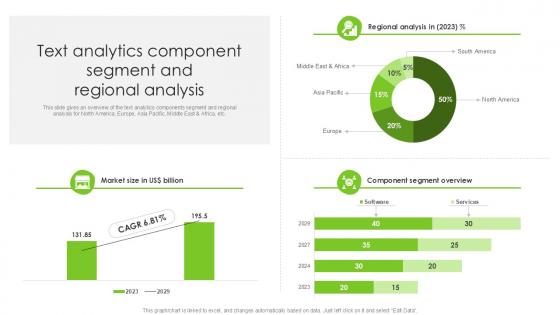
Text Analytics Component Segment And Regional Analysis PPT Template SS
This slide gives an overview of the text analytics components segment and regional analysis for North America, Europe, Asia Pacific, Middle East and Africa, etc. Presenting this PowerPoint presentation, titled Text Analytics Component Segment And Regional Analysis PPT Template SS, with topics curated by our researchers after extensive research. This editable presentation is available for immediate download and provides attractive features when used. Download now and captivate your audience. Presenting this Text Analytics Component Segment And Regional Analysis PPT Template SS. Our researchers have carefully researched and created these slides with all aspects taken into consideration. This is a completely customizable Text Analytics Component Segment And Regional Analysis PPT Template SS that is available for immediate downloading. Download now and make an impact on your audience. Highlight the attractive features available with our PPTs. This slide gives an overview of the text analytics components segment and regional analysis for North America, Europe, Asia Pacific, Middle East and Africa, etc.
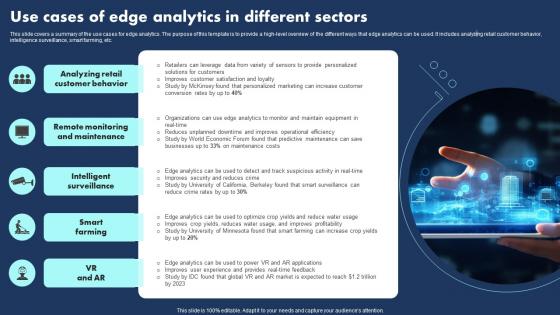
Use Cases Of Edge Analytics In Different Sectors Slides Pdf
This slide covers a summary of the use cases for edge analytics. The purpose of this template is to provide a high level overview of the different ways that edge analytics can be used. It includes analyzing retail customer behavior, intelligence surveillance, smart farming, etc.Pitch your topic with ease and precision using this Use Cases Of Edge Analytics In Different Sectors Slides Pdf This layout presents information on Intelligent Surveillance, Smart Farming, Remote Monitoring It is also available for immediate download and adjustment. So, changes can be made in the color, design, graphics or any other component to create a unique layout. This slide covers a summary of the use cases for edge analytics. The purpose of this template is to provide a high level overview of the different ways that edge analytics can be used. It includes analyzing retail customer behavior, intelligence surveillance, smart farming, etc.
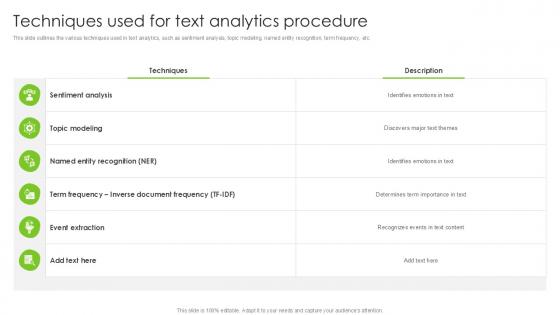
Techniques Used For Text Analytics Procedure PPT Presentation SS
This slide outlines the various techniques used in text analytics, such as sentiment analysis, topic modeling, named entity recognition, term frequency, etc. The Techniques Used For Text Analytics Procedure PPT Presentation SS is a compilation of the most recent design trends as a series of slides. It is suitable for any subject or industry presentation, containing attractive visuals and photo spots for businesses to clearly express their messages. This template contains a variety of slides for the user to input data, such as structures to contrast two elements, bullet points, and slides for written information. Slidegeeks is prepared to create an impression. This slide outlines the various techniques used in text analytics, such as sentiment analysis, topic modeling, named entity recognition, term frequency, etc.
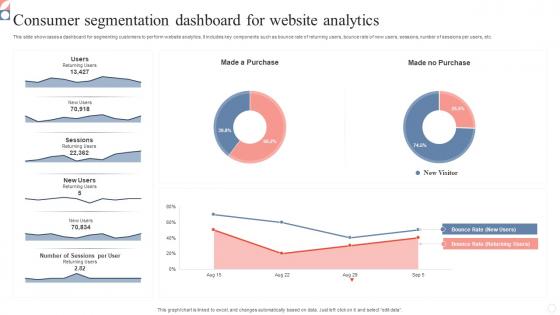
Consumer Segmentation Dashboard For Website Analytics Infographics Pdf
This slide showcases a dashboard for segmenting customers to perform website analytics. It includes key components such as bounce rate of returning users, bounce rate of new users, sessions, number of sessions per users, etc. Pitch your topic with ease and precision using this Consumer Segmentation Dashboard For Website Analytics Infographics Pdf. This layout presents information on Consumer Segmentation Dashboard, Website Analytics, Segmenting Customers. It is also available for immediate download and adjustment. So, changes can be made in the color, design, graphics or any other component to create a unique layout. This slide showcases a dashboard for segmenting customers to perform website analytics. It includes key components such as bounce rate of returning users, bounce rate of new users, sessions, number of sessions per users, etc.
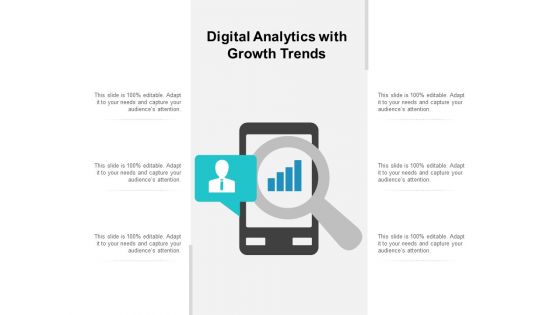
Digital Analytics With Growth Trends Ppt PowerPoint Presentation Inspiration Styles
This is a digital analytics with growth trends ppt powerpoint presentation inspiration styles. This is a six stage process. The stages in this process are mobile analytics, mobile tracking, mobile web analytics.
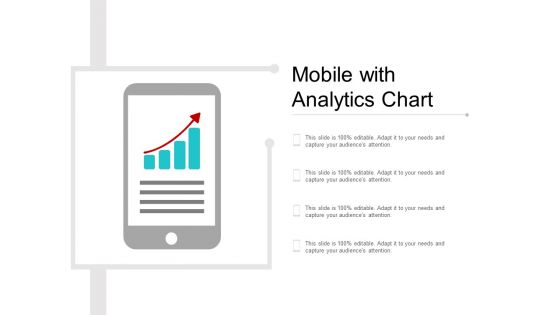
Mobile With Analytics Chart Ppt PowerPoint Presentation Layouts Graphics
This is a mobile with analytics chart ppt powerpoint presentation layouts graphics. This is a four stage process. The stages in this process are mobile analytics, mobile tracking, mobile web analytics.

Marketing Analytics Examples Ppt PowerPoint Presentation Show Guide
This is a marketing analytics examples ppt powerpoint presentation show guide. This is a ten stage process. The stages in this process are marketing analytics examples.
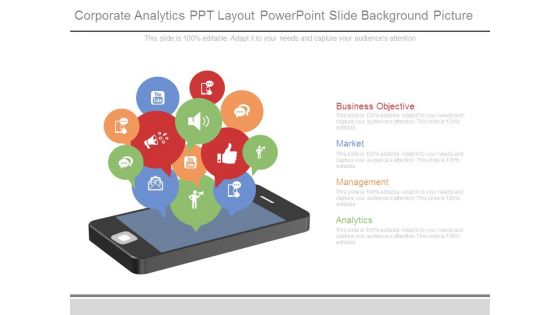
Corporate Analytics Ppt Layout Powerpoint Slide Background Picture
This is a corporate analytics ppt layout powerpoint slide background picture. This is a one stage process. The stages in this process are business objective, market, management, analytics.
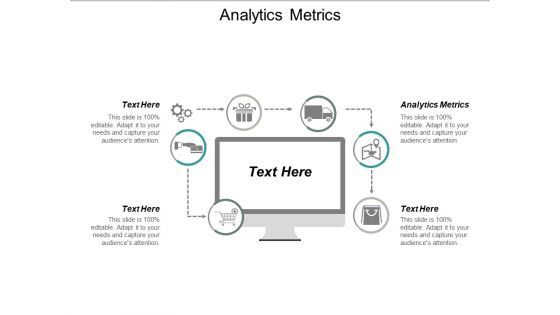
Analytics Metrics Ppt PowerPoint Presentation Pictures Templates Cpb
This is a analytics metrics ppt powerpoint presentation pictures templates cpb. This is a six stage process. The stages in this process are analytics metrics.
HR Analytics Metrics Evaluation Checklist Icon Microsoft Pdf
Showcasing this set of slides titled HR Analytics Metrics Evaluation Checklist Icon Microsoft Pdf The topics addressed in these templates are HR Analytics Metrics, Evaluation Checklist Icon All the content presented in this PPT design is completely editable. Download it and make adjustments in color, background, font etc. as per your unique business setting. Our HR Analytics Metrics Evaluation Checklist Icon Microsoft Pdf are topically designed to provide an attractive backdrop to any subject. Use them to look like a presentation pro.

Predictive Analytics Ppt PowerPoint Presentation Ideas Outline Cpb
This is a predictive analytics ppt powerpoint presentation ideas outline cpb. This is a four stage process. The stages in this process are predictive analytics.
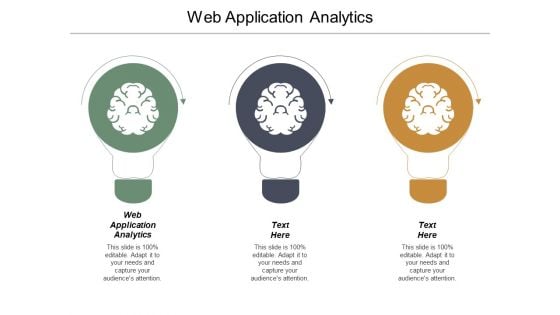
Web Application Analytics Ppt PowerPoint Presentation Professional Rules Cpb
This is a web application analytics ppt powerpoint presentation professional rules cpb. This is a three stage process. The stages in this process are web application analytics.
Cash Analytics Ppt PowerPoint Presentation Icon Demonstration Cpb
This is a cash analytics ppt powerpoint presentation icon demonstration cpb. This is a five stage process. The stages in this process are cash analytics.
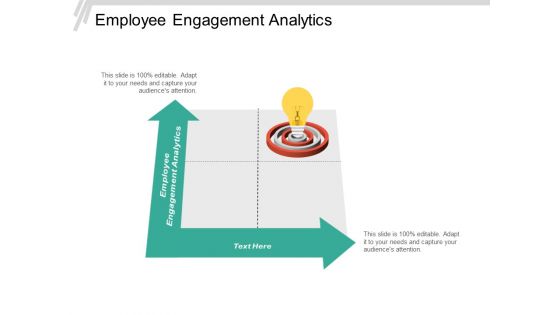
Employee Engagement Analytics Ppt PowerPoint Presentation Layouts Design Templates Cpb
This is a employee engagement analytics ppt powerpoint presentation layouts design templates cpb. This is a two stage process. The stages in this process are employee engagement analytics.


 Continue with Email

 Home
Home


