data analytics
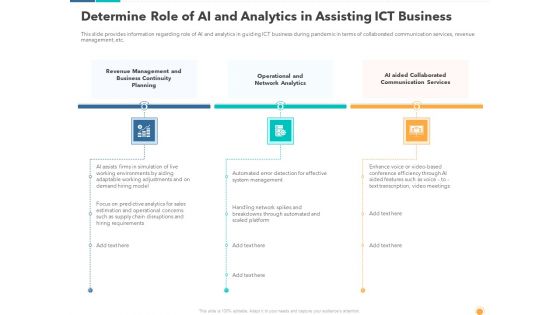
Determine Role Of AI And Analytics In Assisting ICT Business Rules PDF
This is a determine role of ai and analytics in assisting ict business rules pdf template with various stages. Focus and dispense information on three stages using this creative set, that comes with editable features. It contains large content boxes to add your information on topics like ai aided collaborated communication services, revenue management and, business continuity planning, operational and network analytics. You can also showcase facts, figures, and other relevant content using this PPT layout. Grab it now.
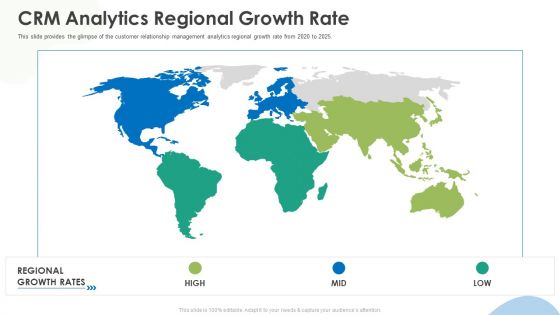
Crm Implementation Investor Funding Crm Analytics Regional Growth Rate Introduction PDF
This is a crm implementation investor funding crm analytics regional growth rate introduction pdf template with various stages. Focus and dispense information on three stages using this creative set, that comes with editable features. It contains large content boxes to add your information on topics like crm analytics regional growth rate. You can also showcase facts, figures, and other relevant content using this PPT layout. Grab it now.
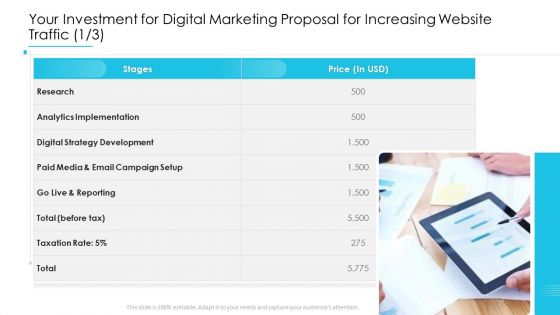
Your Investment For Digital Marketing Proposal For Increasing Website Traffic Analytics Introduction PDF
Presenting your investment for digital marketing proposal for increasing website traffic analytics introduction pdf to provide visual cues and insights. Share and navigate important information on one stages that need your due attention. This template can be used to pitch topics like research, analytics implementation, digital strategy development, paid media and email campaign setup, go live and reporting. In addtion, this PPT design contains high resolution images, graphics, etc, that are easily editable and available for immediate download.

Projection Model Difference Between Four Types Of Advanced Analytics Portrait PDF
This slide represents the difference between the main types of advanced analytics, and it includes diagnostic, descriptive, predictive, and prescriptive analytics. The four major categories of advanced analytics share certain commonalities but are distinguished mostly by their distinctions. Are you in need of a template that can accommodate all of your creative concepts This one is crafted professionally and can be altered to fit any style. Use it with Google Slides or PowerPoint. Include striking photographs, symbols, depictions, and other visuals. Fill, move around, or remove text boxes as desired. Test out color palettes and font mixtures. Edit and save your work, or work with colleagues. Download Projection Model Difference Between Four Types Of Advanced Analytics Portrait PDF and observe how to make your presentation outstanding. Give an impeccable presentation to your group and make your presentation unforgettable.
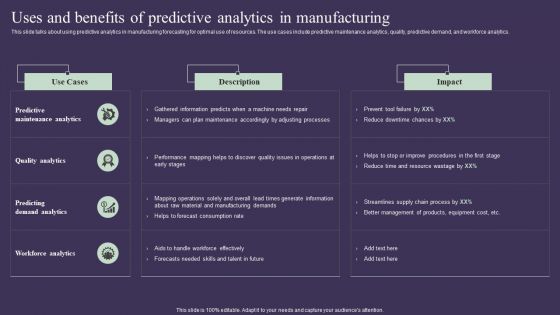
Projection Model Uses And Benefits Of Predictive Analytics In Manufacturing Topics PDF
This slide talks about using predictive analytics in manufacturing forecasting for optimal use of resources. The use cases include predictive maintenance analytics, quality, predictive demand, and workforce analytics. Are you in need of a template that can accommodate all of your creative concepts This one is crafted professionally and can be altered to fit any style. Use it with Google Slides or PowerPoint. Include striking photographs, symbols, depictions, and other visuals. Fill, move around, or remove text boxes as desired. Test out color palettes and font mixtures. Edit and save your work, or work with colleagues. Download Projection Model Uses And Benefits Of Predictive Analytics In Manufacturing Topics PDF and observe how to make your presentation outstanding. Give an impeccable presentation to your group and make your presentation unforgettable.

Advanced Cyber Threat Analytics Ppt PowerPoint Presentation Summary Example Cpb Pdf
Presenting this set of slides with name advanced cyber threat analytics ppt powerpoint presentation summary example cpb pdf. This is an editable Powerpoint one stages graphic that deals with topics like advanced cyber threat analytics to help convey your message better graphically. This product is a premium product available for immediate download and is 100 percent editable in Powerpoint. Download this now and use it in your presentations to impress your audience.
Private Equity Portfolio Analytics Ppt PowerPoint Presentation Outline Background Cpb Pdf
Presenting this set of slides with name private equity portfolio analytics ppt powerpoint presentation outline background cpb pdf. This is an editable Powerpoint three stages graphic that deals with topics like private equity portfolio analytics to help convey your message better graphically. This product is a premium product available for immediate download and is 100 percent editable in Powerpoint. Download this now and use it in your presentations to impress your audience.

Google Analytics For Website Performance Assessment Ppt PowerPoint Presentation File Background Images PDF
Persuade your audience using this google analytics for website performance assessment ppt powerpoint presentation file background images pdf. This PPT design covers three stages, thus making it a great tool to use. It also caters to a variety of topics including google analytics website performance assessment. Download this PPT design now to present a convincing pitch that not only emphasizes the topic but also showcases your presentation skills.
Customer Behavior For Web Marketing Analytics Icon Ppt Model Icon PDF
Persuade your audience using this Customer Behavior For Web Marketing Analytics Icon Ppt Model Icon PDF. This PPT design covers four stages, thus making it a great tool to use. It also caters to a variety of topics including Customer Behavior, Web Marketing, Analytics Icon. Download this PPT design now to present a convincing pitch that not only emphasizes the topic but also showcases your presentation skills.
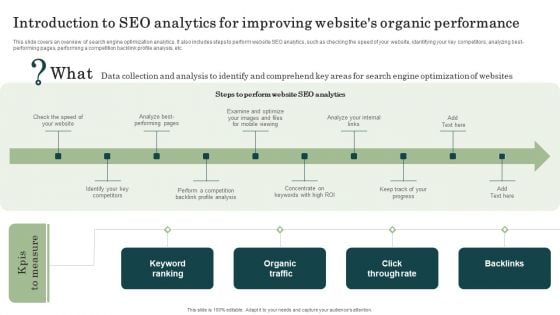
Marketing Success Metrics Introduction To SEO Analytics For Improving Websites Pictures PDF
This slide covers an overview of search engine optimization analytics. It also includes steps to perform website SEO analytics, such as checking the speed of your website, identifying your key competitors, analyzing best-performing pages, performing a competition backlink profile analysis, etc. Get a simple yet stunning designed Marketing Success Metrics Introduction To SEO Analytics For Improving Websites Pictures PDF. It is the best one to establish the tone in your meetings. It is an excellent way to make your presentations highly effective. So, download this PPT today from Slidegeeks and see the positive impacts. Our easy-to-edit Marketing Success Metrics Introduction To SEO Analytics For Improving Websites Pictures PDF can be your go-to option for all upcoming conferences and meetings. So, what are you waiting for Grab this template today.
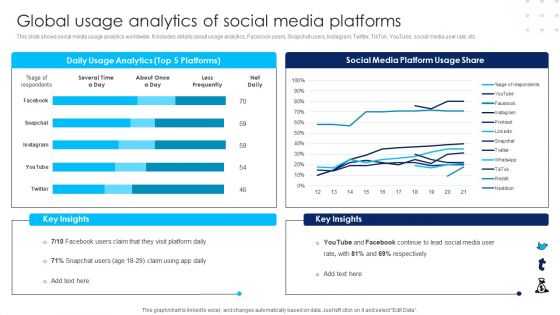
Using Social Media Platforms To Enhance Global Usage Analytics Of Social Media Platforms Rules PDF
This slide shows social media usage analytics worldwide. It includes details about usage analytics, Facebook users, Snapchat users, Instagram, Twitter, TikTok, YouTube, social media user rate, etc. Formulating a presentation can take up a lot of effort and time, so the content and message should always be the primary focus. The visuals of the PowerPoint can enhance the presenters message, so our Using Social Media Platforms To Enhance Global Usage Analytics Of Social Media Platforms Rules PDF was created to help save time. Instead of worrying about the design, the presenter can concentrate on the message while our designers work on creating the ideal templates for whatever situation is needed. Slidegeeks has experts for everything from amazing designs to valuable content, we have put everything into Using Social Media Platforms To Enhance Global Usage Analytics Of Social Media Platforms Rules PDF.
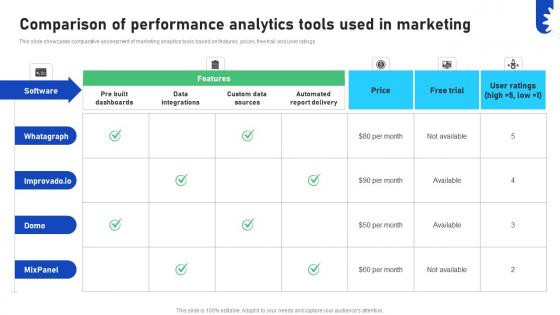
Improving Business Marketing Performance Comparison Of Performance Analytics Tools CRP DK SS V
This slide showcases comparative assessment of marketing analytics tools based on features, prices, free trail and user ratings. Find highly impressive Improving Business Marketing Performance Comparison Of Performance Analytics Tools CRP DK SS V on Slidegeeks to deliver a meaningful presentation. You can save an ample amount of time using these presentation templates. No need to worry to prepare everything from scratch because Slidegeeks experts have already done a huge research and work for you. You need to download Improving Business Marketing Performance Comparison Of Performance Analytics Tools CRP DK SS V for your upcoming presentation. All the presentation templates are 100 percent editable and you can change the color and personalize the content accordingly. Download now This slide showcases comparative assessment of marketing analytics tools based on features, prices, free trail and user ratings.
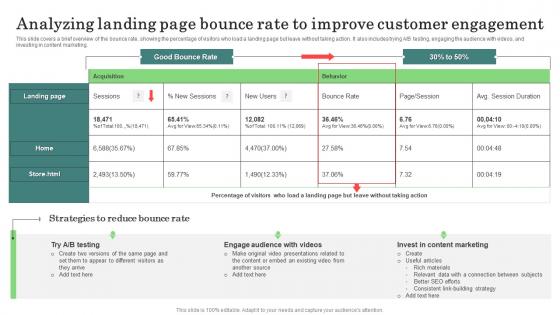
Analyzing Landing Page Bounce Major Promotional Analytics Future Trends Summary Pdf
This slide covers a brief overview of the bounce rate, showing the percentage of visitors who load a landing page but leave without taking action. It also includes trying A B testing, engaging the audience with videos, and investing in content marketing. There are so many reasons you need a Analyzing Landing Page Bounce Major Promotional Analytics Future Trends Summary Pdf. The first reason is you can not spend time making everything from scratch, Thus, Slidegeeks has made presentation templates for you too. You can easily download these templates from our website easily. This slide covers a brief overview of the bounce rate, showing the percentage of visitors who load a landing page but leave without taking action. It also includes trying A B testing, engaging the audience with videos, and investing in content marketing.

Market Entry Strategy Clubs Industry Analytics Dashboard For Gym Health And Fitness Clubs Summary PDF
This slide covers the Key performance indicators for analysing social media platforms, email campaigns and website performance. Presenting market entry strategy clubs industry analytics dashboard for gym health and fitness clubs summary pdf to provide visual cues and insights. Share and navigate important information on seven stages that need your due attention. This template can be used to pitch topics like Analytics Dashboard for Gym Health and Fitness Clubs. In addtion, this PPT design contains high-resolution images, graphics, etc, that are easily editable and available for immediate download.
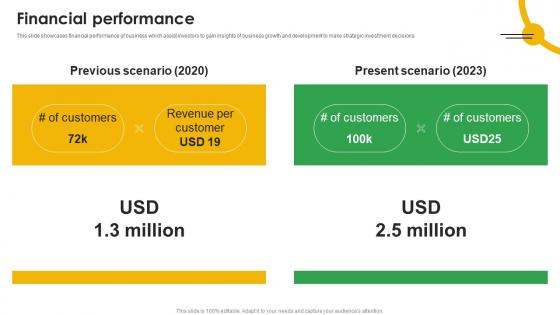
Financial Performance Mobile App Analytics Company Fund Raising Pitch Deck Slides Pdf
This slide showcases financial performance of business which assist investors to gain insights of business growth and development to make strategic investment decisions. Boost your pitch with our creative Financial Performance Mobile App Analytics Company Fund Raising Pitch Deck Slides Pdf. Deliver an awe inspiring pitch that will mesmerize everyone. Using these presentation templates you will surely catch everyones attention. You can browse the ppts collection on our website. We have researchers who are experts at creating the right content for the templates. So you do not have to invest time in any additional work. Just grab the template now and use them. This slide showcases financial performance of business which assist investors to gain insights of business growth and development to make strategic investment decisions.
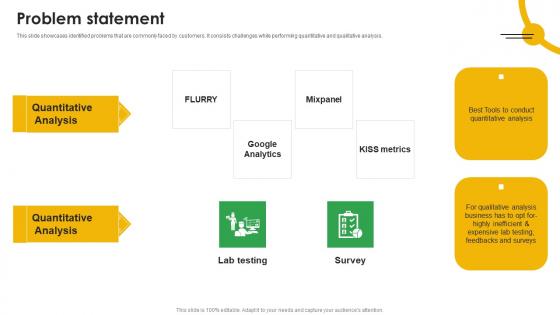
Problem Statement Mobile App Analytics Company Fund Raising Pitch Deck Professional Pdf
This slide showcases identified problems that are commonly faced by customers. It consists challenges while performing quantitative and qualitative analysis. Slidegeeks is here to make your presentations a breeze with Problem Statement Mobile App Analytics Company Fund Raising Pitch Deck Professional Pdf With our easy to use and customizable templates, you can focus on delivering your ideas rather than worrying about formatting. With a variety of designs to choose from, you are sure to find one that suits your needs. And with animations and unique photos, illustrations, and fonts, you can make your presentation pop. So whether you are giving a sales pitch or presenting to the board, make sure to check out Slidegeeks first This slide showcases identified problems that are commonly faced by customers. It consists challenges while performing quantitative and qualitative analysis.
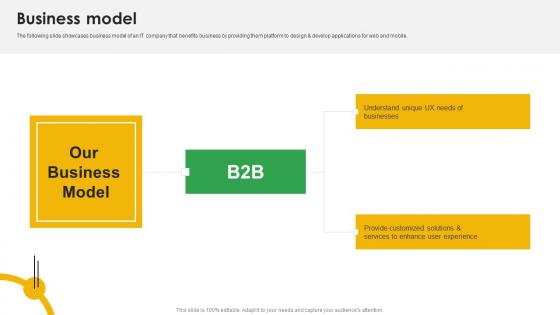
Business Model Mobile App Analytics Company Fund Raising Pitch Deck Formats Pdf
The following slide showcases business model of an IT company that benefits business by providing them platform to design and develop applications for web and mobile. Retrieve professionally designed Business Model Mobile App Analytics Company Fund Raising Pitch Deck Formats Pdf to effectively convey your message and captivate your listeners. Save time by selecting pre made slideshows that are appropriate for various topics, from business to educational purposes. These themes come in many different styles, from creative to corporate, and all of them are easily adjustable and can be edited quickly. Access them as PowerPoint templates or as Google Slides themes. You do not have to go on a hunt for the perfect presentation because Slidegeeks got you covered from everywhere. The following slide showcases business model of an IT company that benefits business by providing them platform to design and develop applications for web and mobile.
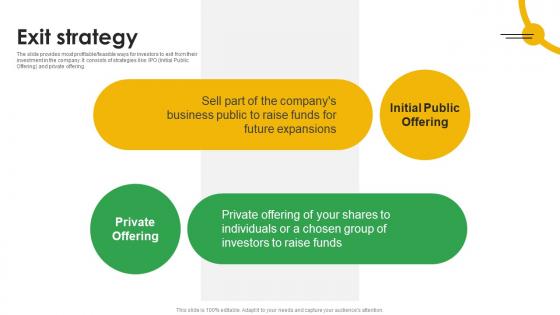
Exit Strategy Mobile App Analytics Company Fund Raising Pitch Deck Rules Pdf
The slide provides most profitablefeasible ways for investors to exit from their investment in the company. It consists of strategies like IPO Initial Public Offering and private offering. Find a pre designed and impeccable Exit Strategy Mobile App Analytics Company Fund Raising Pitch Deck Rules Pdf. The templates can ace your presentation without additional effort. You can download these easy to edit presentation templates to make your presentation stand out from others. So, what are you waiting for Download the template from Slidegeeks today and give a unique touch to your presentation. The slide provides most profitablefeasible ways for investors to exit from their investment in the company. It consists of strategies like IPO Initial Public Offering and private offering.
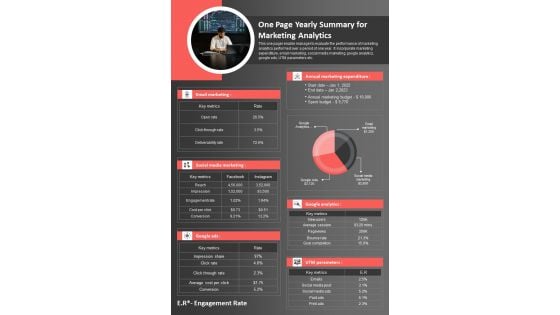
One Page Yearly Summary For Marketing Analytics PDF Document PPT Template
Heres a predesigned One Page Yearly Summary For Marketing Analytics PDF Document PPT Template for you. Built on extensive research and analysis, this one-pager template has all the centerpieces of your specific requirements. This temple exudes brilliance and professionalism. Being completely editable, you can make changes to suit your purpose. Get this One Page Yearly Summary For Marketing Analytics PDF Document PPT Template Download now.
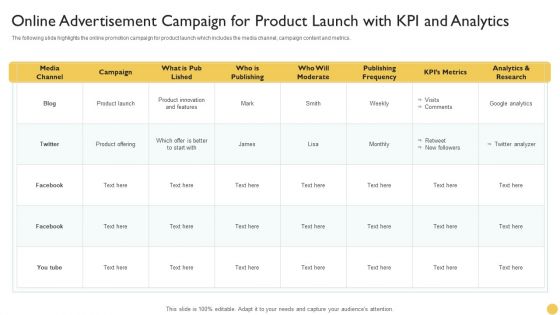
Online Advertisement Campaign For Product Launch With KPI And Analytics Diagrams PDF
The following slide highlights the online promotion campaign for product launch which includes the media channel, campaign content and metrics. Showcasing this set of slides titled Online Advertisement Campaign For Product Launch With KPI And Analytics Diagrams PDF. The topics addressed in these templates are Kpis Metrics, Google Analytics, Product Offering. All the content presented in this PPT design is completely editable. Download it and make adjustments in color, background, font etc. as per your unique business setting.
Social Network Playbook Social Media Kpi Analytics Measurement Ppt Icon Demonstration PDF
This template covers key performance indicator KPI to determine the performance against the company objectives. These Social media KPIs would be focusing on social engagements, content reach, purchase leads and conversions. Deliver an awe inspiring pitch with this creative social network playbook social media kpi analytics measurement ppt icon demonstration pdf bundle. Topics like social media kpi analytics measurement can be discussed with this completely editable template. It is available for immediate download depending on the needs and requirements of the user.
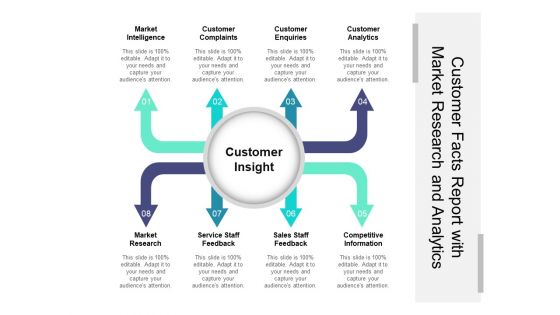
Customer Facts Report With Market Research And Analytics Ppt PowerPoint Presentation File Graphics PDF
Presenting this set of slides with name customer facts report with market research and analytics ppt powerpoint presentation file graphics pdf. This is a eight stage process. The stages in this process are market intelligence, customer complaints, customer enquiries, customer analytics, market research, service staff feedback, sales staff feedback, competitive information. This is a completely editable PowerPoint presentation and is available for immediate download. Download now and impress your audience.
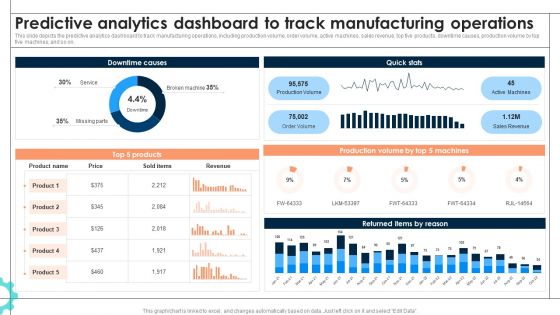
Intelligent Manufacturing Predictive Analytics Dashboard To Track Manufacturing Operations Information PDF
This slide depicts the predictive analytics dashboard to track manufacturing operations, including production volume, order volume, active machines, sales revenue, top five products, downtime causes, production volume by top five machines, and so on. If you are looking for a format to display your unique thoughts, then the professionally designed Intelligent Manufacturing Predictive Analytics Dashboard To Track Manufacturing Operations Information PDF is the one for you. You can use it as a Google Slides template or a PowerPoint template. Incorporate impressive visuals, symbols, images, and other charts. Modify or reorganize the text boxes as you desire. Experiment with shade schemes and font pairings. Alter, share or cooperate with other people on your work. Download Intelligent Manufacturing Predictive Analytics Dashboard To Track Manufacturing Operations Information PDF and find out how to give a successful presentation. Present a perfect display to your team and make your presentation unforgettable.
Predictive Analytics Model Performance Tracking Dashboard Forward Looking Analysis IT Introduction PDF
This slide represents the predictive analytics model performance tracking dashboard, and it covers the details of total visitors, total buyers, total products added to the cart, filters by date and category, visitors to clients conversion rate, and so on.The Predictive Analytics Model Performance Tracking Dashboard Forward Looking Analysis IT Introduction PDF is a compilation of the most recent design trends as a series of slides. It is suitable for any subject or industry presentation, containing attractive visuals and photo spots for businesses to clearly express their messages. This template contains a variety of slides for the user to input data, such as structures to contrast two elements, bullet points, and slides for written information. Slidegeeks is prepared to create an impression.
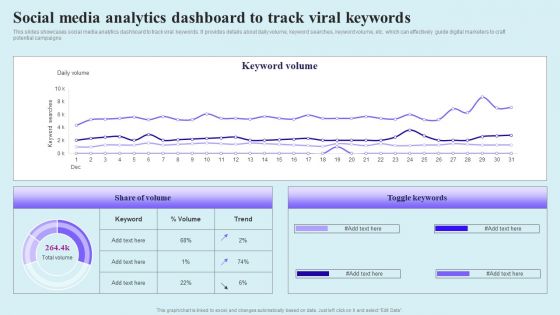
Go Viral Campaign Strategies To Increase Engagement Social Media Analytics Dashboard Track Viral Graphics PDF
This slides showcases social media analytics dashboard to track viral keywords. It provides details about daily volume, keyword searches, keyword volume, etc. which can effectively guide digital marketers to craft potential campaigns Are you searching for a Go Viral Campaign Strategies To Increase Engagement Social Media Analytics Dashboard Track Viral Graphics PDF that is uncluttered, straightforward, and original Its easy to edit, and you can change the colors to suit your personal or business branding. For a presentation that expresses how much effort you have put in, this template is ideal. With all of its features, including tables, diagrams, statistics, and lists, its perfect for a business plan presentation. Make your ideas more appealing with these professional slides. Download Go Viral Campaign Strategies To Increase Engagement Social Media Analytics Dashboard Track Viral Graphics PDF from Slidegeeks today.
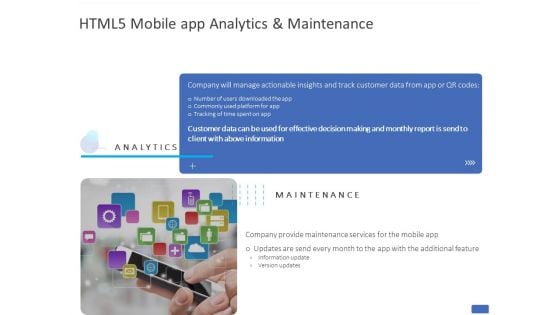
HTML5 Mobile App Analytics And Maintenance Ppt PowerPoint Presentation File Gallery PDF
Presenting html5 mobile app analytics and maintenance ppt powerpoint presentation file gallery pdf to provide visual cues and insights. Share and navigate important information on one stages that need your due attention. This template can be used to pitch topics like commonly used platform, tracking time spent, customer data, provide maintenance services, information. In addition, this PPT design contains high-resolution images, graphics, etc, that are easily editable and available for immediate download.
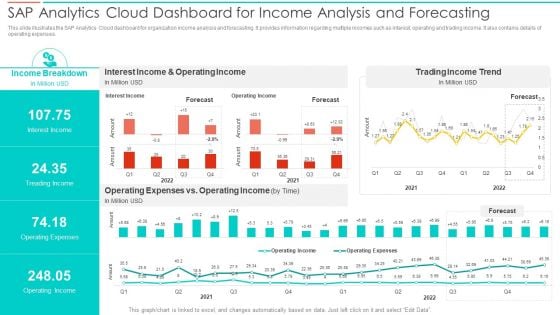
SAC Planning And Implementation SAP Analytics Cloud Dashboard For Income Analysis Summary PDF
This slide illustrates the SAP Analytics Cloud dashboard for organization income analysis and forecasting. It provides information regarding multiple incomes such as interest, operating and trading income. It also contains details of operating expenses. Deliver an awe inspiring pitch with this creative SAC Planning And Implementation SAP Analytics Cloud Dashboard For Income Analysis Summary PDF bundle. Topics like Income Breakdown, Interest Income, Operating Income, Trading Income Trend can be discussed with this completely editable template. It is available for immediate download depending on the needs and requirements of the user.
SAC Planning And Implementation SAP Analytics Cloud Dashboard For Product Sales Analysis Icons PDF
This slide illustrates the SAP Analytics Cloud dashboard to monitor product sales performance. It provides information regarding the gross margin and net revenue earned, product performance state wise and year wise. Deliver and pitch your topic in the best possible manner with this SAC Planning And Implementation SAP Analytics Cloud Dashboard For Product Sales Analysis Icons PDF. Use them to share invaluable insights on Gross Margin, Earned Quarter Wise, Gross Margin, Net Revenue and impress your audience. This template can be altered and modified as per your expectations. So, grab it now.
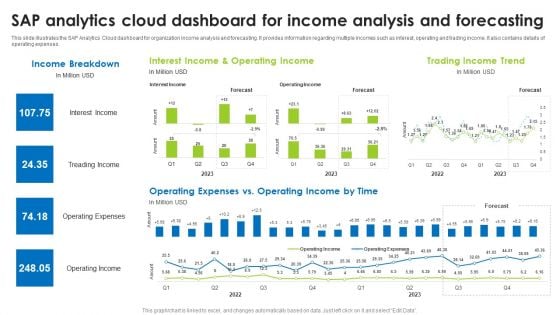
Sap Analytics Cloud Dashboard For Income Analysis And Forecasting Formats PDF
This slide illustrates the SAP Analytics Cloud dashboard for organization income analysis and forecasting. It provides information regarding multiple incomes such as interest, operating and trading income. It also contains details of operating expenses. The best PPT templates are a great way to save time, energy, and resources. Slidegeeks have 100 percent editable powerpoint slides making them incredibly versatile. With these quality presentation templates, you can create a captivating and memorable presentation by combining visually appealing slides and effectively communicating your message. Download Sap Analytics Cloud Dashboard To Asses Digital Marketing Campaigns Performance Ideas PDF from Slidegeeks and deliver a wonderful presentation.
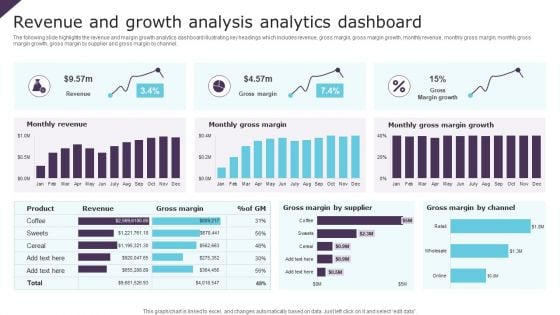
Revenue And Growth Analysis Analytics Dashboard Ppt Infographic Template Brochure PDF
The following slide highlights the revenue and margin growth analytics dashboard illustrating key headings which includes revenue, gross margin, gross margin growth, monthly revenue, monthly gross margin, monthly gross margin growth, gross margin by supplier and gross margin by channel. Pitch your topic with ease and precision using this Revenue And Growth Analysis Analytics Dashboard Ppt Infographic Template Brochure PDF. This layout presents information on Monthly Revenue, Monthly Gross Margin, Gross Margin Growth. It is also available for immediate download and adjustment. So, changes can be made in the color, design, graphics or any other component to create a unique layout.
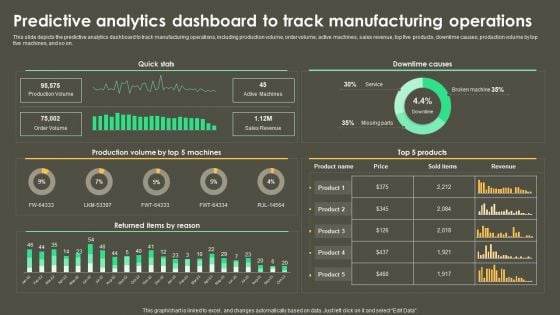
Iot Integration In Manufacturing Predictive Analytics Dashboard To Track Manufacturing Operations Background PDF
This slide depicts the predictive analytics dashboard to track manufacturing operations, including production volume, order volume, active machines, sales revenue, top five products, downtime causes, production volume by top five machines, and so on. If you are looking for a format to display your unique thoughts, then the professionally designed Iot Integration In Manufacturing Predictive Analytics Dashboard To Track Manufacturing Operations Background PDF is the one for you. You can use it as a Google Slides template or a PowerPoint template. Incorporate impressive visuals, symbols, images, and other charts. Modify or reorganize the text boxes as you desire. Experiment with shade schemes and font pairings. Alter, share or cooperate with other people on your work. Download Iot Integration In Manufacturing Predictive Analytics Dashboard To Track Manufacturing Operations Background PDF and find out how to give a successful presentation. Present a perfect display to your team and make your presentation unforgettable.
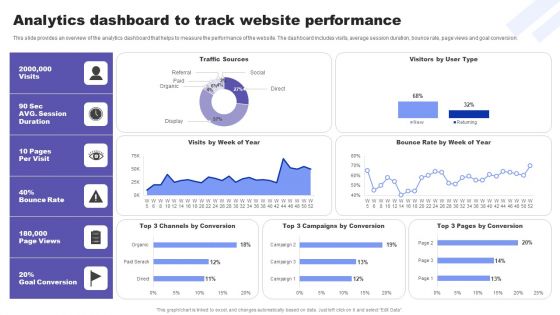
Direct Response Marketing Guide Ultimate Success Analytics Dashboard To Track Mockup PDF
This slide provides an overview of the analytics dashboard that helps to measure the performance of the website. The dashboard includes visits, average session duration, bounce rate, page views and goal conversion. Find highly impressive Direct Response Marketing Guide Ultimate Success Analytics Dashboard To Track Mockup PDF on Slidegeeks to deliver a meaningful presentation. You can save an ample amount of time using these presentation templates. No need to worry to prepare everything from scratch because Slidegeeks experts have already done a huge research and work for you. You need to download Direct Response Marketing Guide Ultimate Success Analytics Dashboard To Track Mockup PDF for your upcoming presentation. All the presentation templates are 100 percent editable and you can change the color and personalize the content accordingly. Download now
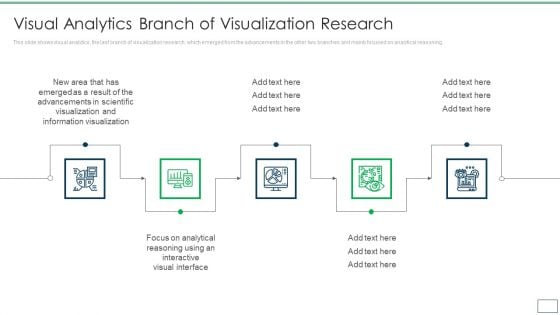
Departments Of Visualization Research Visual Analytics Branch Of Visualization Research Information PDF
This slide shows visual analytics, the last branch of visualization research, which emerged from the advancements in the other two branches and mainly focused on analytical reasoning.Presenting Departments Of Visualization Research Visual Analytics Branch Of Visualization Research Information PDF to provide visual cues and insights. Share and navigate important information on five stages that need your due attention. This template can be used to pitch topics like Information Visualization, Advancements In Scientific, Interactive Visual Interface In addtion, this PPT design contains high resolution images, graphics, etc, that are easily editable and available for immediate download.
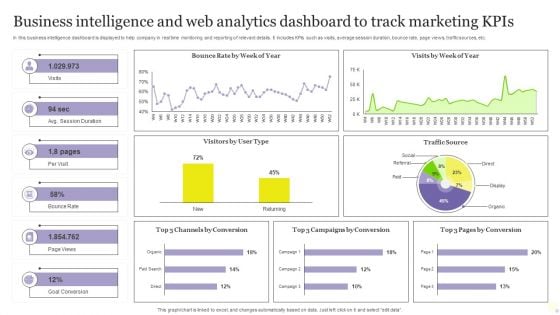
Business Intelligence And Web Analytics Dashboard To Track Marketing Kpis Inspiration PDF
In this business intelligence dashboard is displayed to help company in real time monitoring and reporting of relevant details. It includes KPIs such as visits, average session duration, bounce rate, page views, traffic sources, etc. Showcasing this set of slides titled Business Intelligence And Web Analytics Dashboard To Track Marketing Kpis Inspiration PDF. The topics addressed in these templates are Goal Conversion, Track Marketing Kpis, Web Analytics Dashboard. All the content presented in this PPT design is completely editable. Download it and make adjustments in color, background, font etc. as per your unique business setting.

KPI Analytics Dashboard With Sourcing Raw Material Cycle Time Inspiration PDF
Following slide shows the key performance indicator KPI dashboard which will assist corporates to effectively monitor procurement process. The metrics are number of suppliers, contract compliance, average procurement cycle time, etc. Showcasing this set of slides titled KPI Analytics Dashboard With Sourcing Raw Material Cycle Time Inspiration PDF. The topics addressed in these templates are Kpi Analytics Dashboard, Sourcing Raw Material, Cycle Time. All the content presented in this PPT design is completely editable. Download it and make adjustments in color, background, font etc. as per your unique business setting.
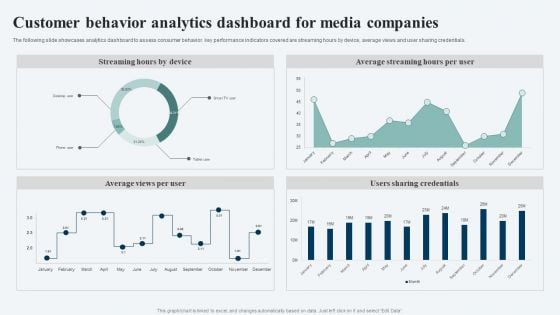
Customer Behavior Analytics Dashboard For Media Companies Ppt Ideas Visuals PDF
The following slide showcases analytics dashboard to assess consumer behavior. key performance indicators covered are streaming hours by device, average views and user sharing credentials. Showcasing this set of slides titled Customer Behavior Analytics Dashboard For Media Companies Ppt Ideas Visuals PDF. The topics addressed in these templates are Streaming Hours Device, Average Streaming Hours, Per User, Users Sharing Credentials. All the content presented in this PPT design is completely editable. Download it and make adjustments in color, background, font etc. as per your unique business setting.
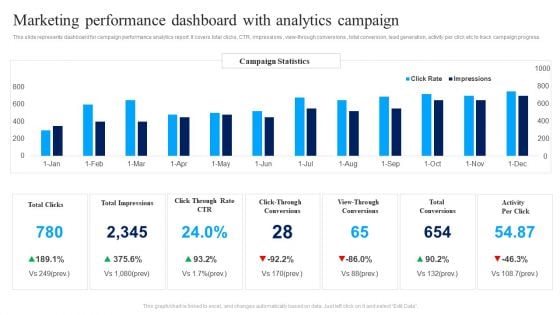
Marketing Performance Dashboard With Analytics Campaign Ppt Infographics Background Images PDF
This slide represents dashboard for campaign performance analytics report. It covers total clicks, CTR, impressions , view-through conversions , total conversion, lead generation, activity per click etc to track campaign progress. Showcasing this set of slides titled Marketing Performance Dashboard With Analytics Campaign Ppt Infographics Background Images PDF. The topics addressed in these templates are Total Clicks, Total Impressions, Total Conversions, Activity Per Click. All the content presented in this PPT design is completely editable. Download it and make adjustments in color, background, font etc. as per your unique business setting.
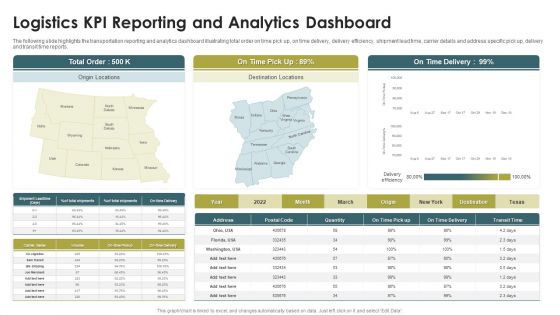
Logistics KPI Reporting And Analytics Dashboard Ppt Infographic Template Background PDF
The following slide highlights the transportation reporting and analytics dashboard illustrating total order on time pick up, on time delivery, delivery efficiency, shipment lead time, carrier details and address specific pick up, delivery and transit time reports. Presenting Logistics KPI Reporting And Analytics Dashboard Ppt Infographic Template Background PDF to dispense important information. This template comprises one stages. It also presents valuable insights into the topics including On Time Delivery, Total Order, Origin Locations. This is a completely customizable PowerPoint theme that can be put to use immediately. So, download it and address the topic impactfully.
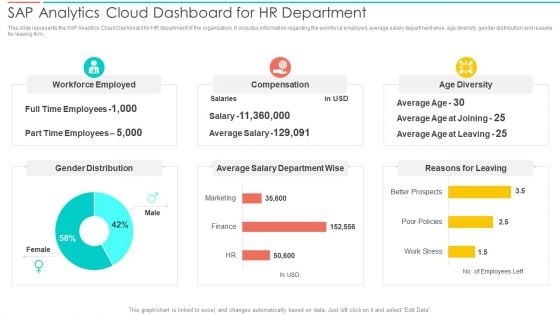
SAC Planning And Implementation SAP Analytics Cloud Dashboard For Hr Department Inspiration PDF
This slide represents the SAP Analytics Cloud Dashboard for HR department of the organization. It includes information regarding the workforce employed, average salary department wise, age diversity, gender distribution and reasons for leaving firm. Deliver and pitch your topic in the best possible manner with this SAC Planning And Implementation SAP Analytics Cloud Dashboard For Hr Department Inspiration PDF. Use them to share invaluable insights on Workforce Employed, Compensation, Age Diversity and impress your audience. This template can be altered and modified as per your expectations. So, grab it now.
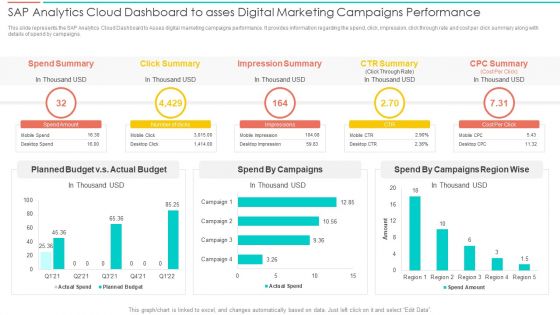
SAC Planning And Implementation SAP Analytics Cloud Dashboard To Asses Digital Marketing Pictures PDF
This slide represents the SAP Analytics Cloud Dashboard to Asses digital marketing campaigns performance. It provides information regarding the spend, click, impression, click through rate and cost per click summary along with details of spend by campaigns. Deliver an awe inspiring pitch with this creative SAC Planning And Implementation SAP Analytics Cloud Dashboard To Asses Digital Marketing Pictures PDF bundle. Topics like Spend Summary, Click Summary, Impression Summary, CTR Summary can be discussed with this completely editable template. It is available for immediate download depending on the needs and requirements of the user.
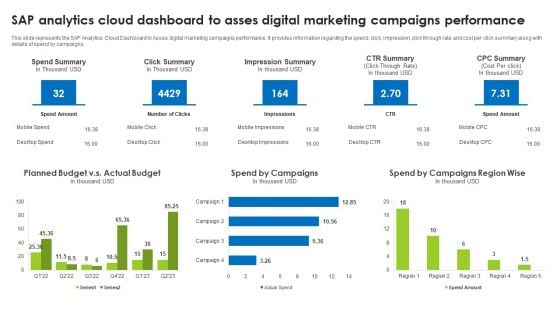
Sap Analytics Cloud Dashboard To Asses Digital Marketing Campaigns Performance Ideas PDF
This slide represents the SAP Analytics Cloud Dashboard to Asses digital marketing campaigns performance. It provides information regarding the spend, click, impression, click through rate and cost per click summary along with details of spend by campaigns. The best PPT templates are a great way to save time, energy, and resources. Slidegeeks have 100 percent editable powerpoint slides making them incredibly versatile. With these quality presentation templates, you can create a captivating and memorable presentation by combining visually appealing slides and effectively communicating your message. Download Sap Analytics Cloud Dashboard To Asses Digital Marketing Campaigns Performance Ideas PDF from Slidegeeks and deliver a wonderful presentation.
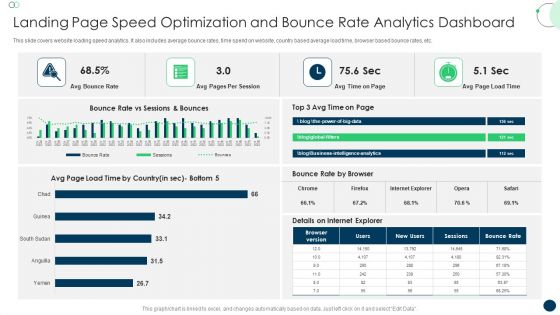
Landing Page Speed Optimization And Bounce Rate Analytics Dashboard Topics PDF
This slide covers website loading speed analytics. It also includes average bounce rates, time spend on website, country based average load time, browser based bounce rates, etc. Pitch your topic with ease and precision using this Landing Page Speed Optimization And Bounce Rate Analytics Dashboard Topics PDF. This layout presents information on Avg Bounce Rate, Avg Pages, Per Session. It is also available for immediate download and adjustment. So, changes can be made in the color, design, graphics or any other component to create a unique layout.
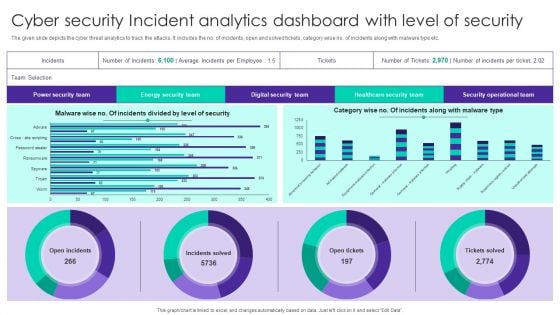
Cyber Security Incident Analytics Dashboard With Level Of Security Ppt Ideas Graphics Tutorials PDF
The given slide depicts the cyber threat analytics to track the attacks. It includes the no. of incidents, open and solved tickets, category wise no. of incidents along with malware type etc. Pitch your topic with ease and precision using this Cyber Security Incident Analytics Dashboard With Level Of Security Ppt Ideas Graphics Tutorials PDF. This layout presents information on Power Security Team, Open Incidents, Incidents Solved, Open Tickets. It is also available for immediate download and adjustment. So, changes can be made in the color, design, graphics or any other component to create a unique layout.
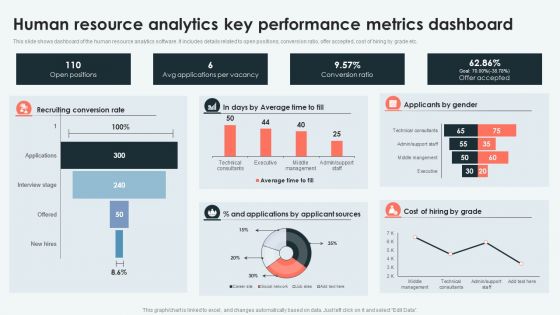
Analyzing And Deploying Human Resource Analytics Key Performance Metrics Dashboard Themes PDF
This slide shows dashboard of the human resource analytics software. It includes details related to open positions, conversion ratio, offer accepted, cost of hiring by grade etc. Do you have to make sure that everyone on your team knows about any specific topic I yes, then you should give Analyzing And Deploying Human Resource Analytics Key Performance Metrics Dashboard Themes PDF a try. Our experts have put a lot of knowledge and effort into creating this impeccable Analyzing And Deploying Human Resource Analytics Key Performance Metrics Dashboard Themes PDF. You can use this template for your upcoming presentations, as the slides are perfect to represent even the tiniest detail. You can download these templates from the Slidegeeks website and these are easy to edit. So grab these today.
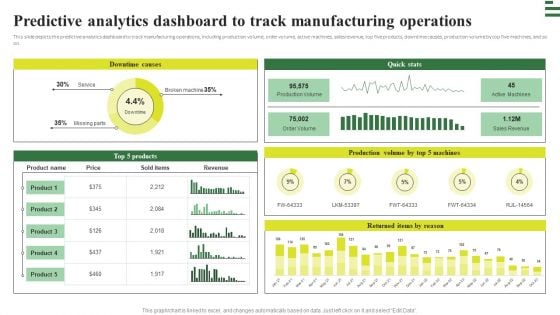
Transforming Manufacturing With Automation Predictive Analytics Dashboard To Track Diagrams PDF
This slide depicts the predictive analytics dashboard to track manufacturing operations, including production volume, order volume, active machines, sales revenue, top five products, downtime causes, production volume by top five machines, and so on. Get a simple yet stunning designed Transforming Manufacturing With Automation Predictive Analytics Dashboard To Track Diagrams PDF. It is the best one to establish the tone in your meetings. It is an excellent way to make your presentations highly effective. So, download this PPT today from Slidegeeks and see the positive impacts. Our easy to edit Transforming Manufacturing With Automation Predictive Analytics Dashboard To Track Diagrams PDF can be your go to option for all upcoming conferences and meetings. So, what are you waiting for Grab this template today.
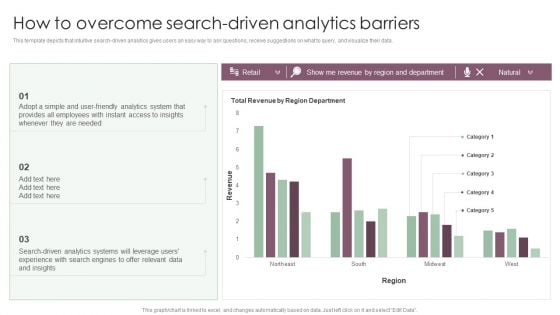
Information Analysis And BI Playbook How To Overcome Search Driven Analytics Barriers Formats PDF
This template depicts that intuitive search driven analytics gives users an easy way to ask questions, receive suggestions on what to query, and visualize their data. Coming up with a presentation necessitates that the majority of the effort goes into the content and the message you intend to convey. The visuals of a PowerPoint presentation can only be effective if it supplements and supports the story that is being told. Keeping this in mind our experts created Information Analysis And BI Playbook How To Overcome Search Driven Analytics Barriers Formats PDF to reduce the time that goes into designing the presentation. This way, you can concentrate on the message while our designers take care of providing you with the right template for the situation.
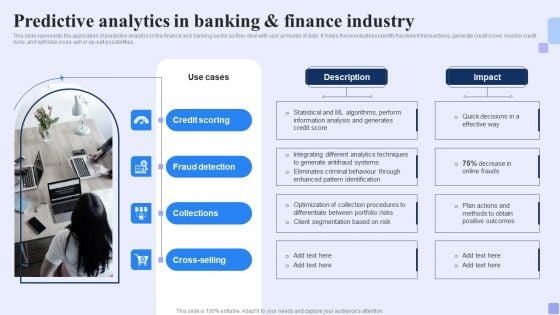
Predictive Analytics In Banking And Finance Industry Forward Looking Analysis IT Diagrams PDF
This slide represents the application of predictive analytics in the finance and banking sector as they deal with vast amounts of data. It helps these industries identify fraudulent transactions, generate credit score, monitor credit risks, and optimize cross-sell or up-sell possibilities.Coming up with a presentation necessitates that the majority of the effort goes into the content and the message you intend to convey. The visuals of a PowerPoint presentation can only be effective if it supplements and supports the story that is being told. Keeping this in mind our experts created Predictive Analytics In Banking And Finance Industry Forward Looking Analysis IT Diagrams PDF to reduce the time that goes into designing the presentation. This way, you can concentrate on the message while our designers take care of providing you with the right template for the situation.
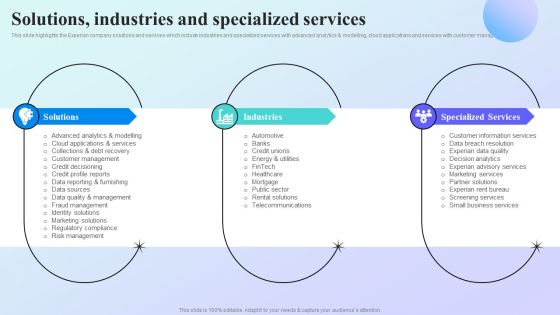
Information Analytics Company Outline Solutions Industries And Specialized Services Portrait PDF
This slide highlights the Experian company solutions and services which include industries and specialized services with advanced analytics and modelling, cloud applications and services with customer management. Are you searching for a Information Analytics Company Outline Solutions Industries And Specialized Services Portrait PDF that is uncluttered, straightforward, and original Its easy to edit, and you can change the colors to suit your personal or business branding. For a presentation that expresses how much effort you have put in, this template is ideal. With all of its features, including tables, diagrams, statistics, and lists, its perfect for a business plan presentation. Make your ideas more appealing with these professional slides. Download Information Analytics Company Outline Solutions Industries And Specialized Services Portrait PDF from Slidegeeks today.
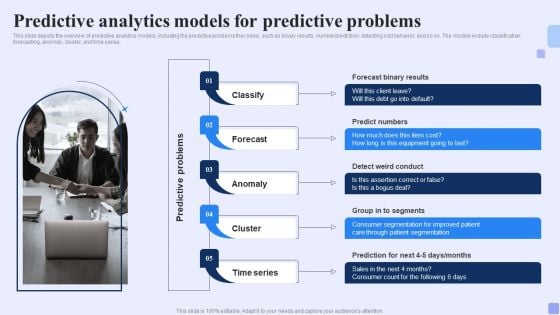
Predictive Analytics Models For Predictive Problems Forward Looking Analysis IT Clipart PDF
This slide depicts the overview of predictive analytics models, including the predictive problems they solve, such as binary results, number prediction, detecting odd behavior, and so on. The models include classification, forecasting, anomaly, cluster, and time series. Are you searching for a Predictive Analytics Models For Predictive Problems Forward Looking Analysis IT Clipart PDF that is uncluttered, straightforward, and original Its easy to edit, and you can change the colors to suit your personal or business branding. For a presentation that expresses how much effort you ve put in, this template is ideal With all of its features, including tables, diagrams, statistics, and lists, its perfect for a business plan presentation. Make your ideas more appealing with these professional slides. Download Predictive Analytics Models For Predictive Problems Forward Looking Analysis IT Clipart PDF from Slidegeeks today.
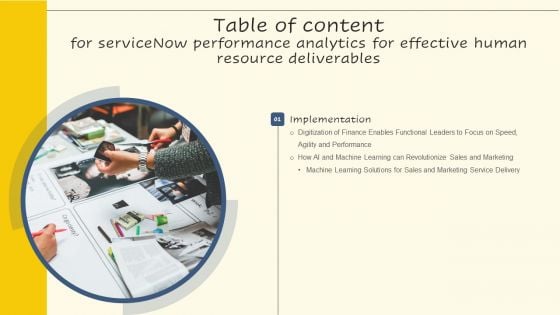
Servicenow Performance Analytics For Effective Human Resource Deliverables Table Of Content Clipart PDF
Are you searching for a Servicenow Performance Analytics For Effective Human Resource Deliverables Table Of Content Clipart PDF that is uncluttered, straightforward, and original Its easy to edit, and you can change the colors to suit your personal or business branding. For a presentation that expresses how much effort you have put in, this template is ideal. With all of its features, including tables, diagrams, statistics, and lists, its perfect for a business plan presentation. Make your ideas more appealing with these professional slides. Download Servicenow Performance Analytics For Effective Human Resource Deliverables Table Of Content Clipart PDF from Slidegeeks today.
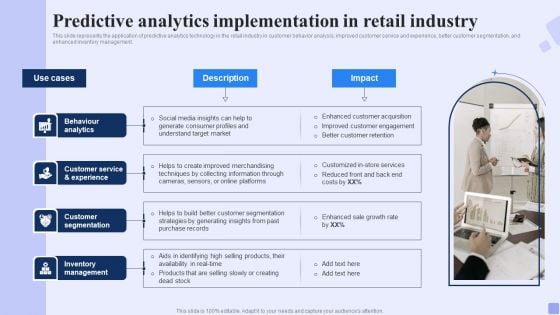
Predictive Analytics Implementation In Retail Industry Forward Looking Analysis IT Diagrams PDF
This slide represents the application of predictive analytics technology in the retail industry in customer behavior analysis, improved customer service and experience, better customer segmentation, and enhanced inventory management.Formulating a presentation can take up a lot of effort and time, so the content and message should always be the primary focus. The visuals of the PowerPoint can enhance the presenters message, so our Predictive Analytics Implementation In Retail Industry Forward Looking Analysis IT Diagrams PDF was created to help save time. Instead of worrying about the design, the presenter can concentrate on the message while our designers work on creating the ideal templates for whatever situation is needed. Slidegeeks has experts for everything from amazing designs to valuable content, we have put everything into Predictive Analytics Implementation In Retail Industry Forward Looking Analysis IT Diagrams PDF.
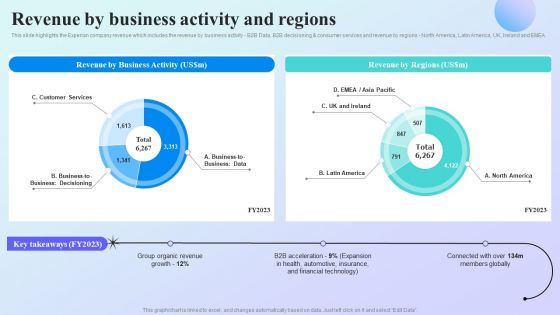
Information Analytics Company Outline Revenue By Business Activity And Regions Clipart PDF
This slide highlights the Experian company revenue which includes the revenue by business activity B2B Data, B2B decisioning and consumer services and revenue by regions North America, Latin America, UK, Ireland and EMEA. Here you can discover an assortment of the finest PowerPoint and Google Slides templates. With these templates, you can create presentations for a variety of purposes while simultaneously providing your audience with an eye catching visual experience. Download Information Analytics Company Outline Revenue By Business Activity And Regions Clipart PDF to deliver an impeccable presentation. These templates will make your job of preparing presentations much quicker, yet still, maintain a high level of quality. Slidegeeks has experienced researchers who prepare these templates and write high quality content for you. Later on, you can personalize the content by editing the Information Analytics Company Outline Revenue By Business Activity And Regions Clipart PDF.
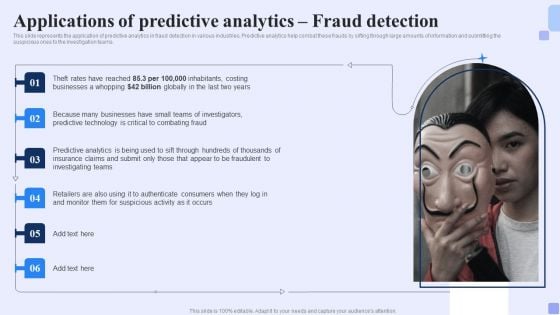
Applications Of Predictive Analytics Fraud Detection Forward Looking Analysis IT Ideas PDF
This slide represents the application of predictive analytics in fraud detection in various industries. Predictive analytics help combat these frauds by sifting through large amounts of information and submitting the suspicious ones to the investigation teams. Boost your pitch with our creative Applications Of Predictive Analytics Fraud Detection Forward Looking Analysis IT Ideas PDF. Deliver an awe-inspiring pitch that will mesmerize everyone. Using these presentation templates you will surely catch everyones attention. You can browse the ppts collection on our website. We have researchers who are experts at creating the right content for the templates. So you do not have to invest time in any additional work. Just grab the template now and use them.
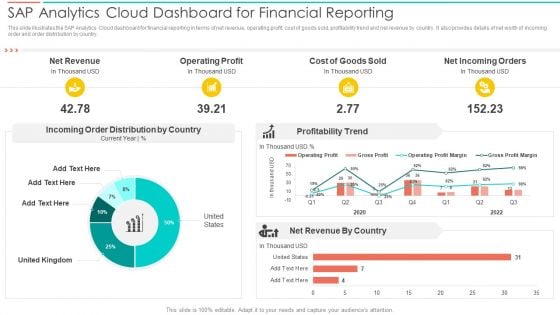
SAC Planning And Implementation SAP Analytics Cloud Dashboard For Financial Reporting Introduction PDF
This slide illustrates the SAP Analytics Cloud dashboard for financial reporting in terms of net revenue, operating profit, cost of goods sold, profitability trend and net revenue by country. It also provides details of net worth of incoming order and order distribution by country. Deliver an awe inspiring pitch with this creative SAC Planning And Implementation SAP Analytics Cloud Dashboard For Financial Reporting Introduction PDF bundle. Topics like Net Revenue, Operating Profit, Cost Goods Sold can be discussed with this completely editable template. It is available for immediate download depending on the needs and requirements of the user.
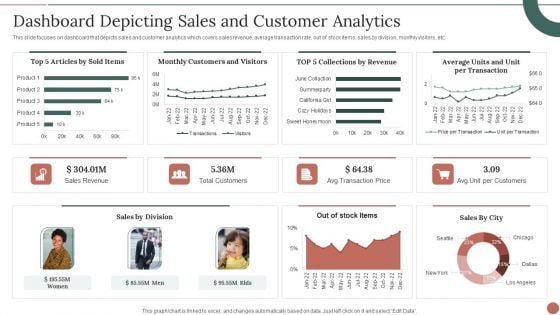
Retail Business Product Planning Procedure Dashboard Depicting Sales And Customer Analytics Themes PDF
This slide focuses on dashboard that depicts sales and customer analytics which covers sales revenue, average transaction rate, out of stock items, sales by division, monthly visitors, etc. Deliver and pitch your topic in the best possible manner with this Retail Business Product Planning Procedure Dashboard Depicting Sales And Customer Analytics Themes PDF. Use them to share invaluable insights on Sales Revenue, Total Customers, Sales By Division and impress your audience. This template can be altered and modified as per your expectations. So, grab it now.
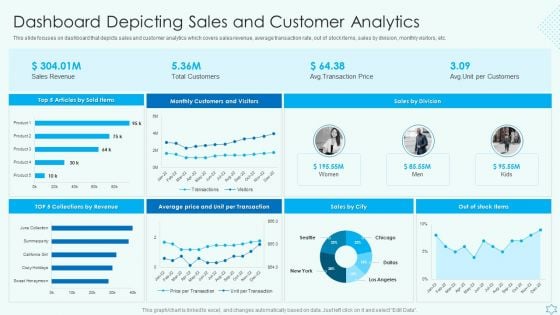
Deploy Merchandise Program To Enhance Sales Dashboard Depicting Sales And Customer Analytics Sample PDF
This slide focuses on dashboard that depicts sales and customer analytics which covers sales revenue, average transaction rate, out of stock items, sales by division, monthly visitors, etc. Make sure to capture your audiences attention in your business displays with our gratis customizable Deploy Merchandise Program To Enhance Sales Dashboard Depicting Sales And Customer Analytics Sample PDF. These are great for business strategies, office conferences, capital raising or task suggestions. If you desire to acquire more customers for your tech business and ensure they stay satisfied, create your own sales presentation with these plain slides.
Implementing CRM To Optimize Dashboard Depicting Customer Retention Analytics Icons PDF
This slide shows the dashboard that depicts customer retention analytics which includes net promoter score, customer loyalty rate, customer lifetime value, customer and revenue churn, monthly recurring revenue growth, etc. Slidegeeks is one of the best resources for PowerPoint templates. You can download easily and regulate Implementing CRM To Optimize Dashboard Depicting Customer Retention Analytics Icons PDF for your personal presentations from our wonderful collection. A few clicks is all it takes to discover and get the most relevant and appropriate templates. Use our Templates to add a unique zing and appeal to your presentation and meetings. All the slides are easy to edit and you can use them even for advertisement purposes.
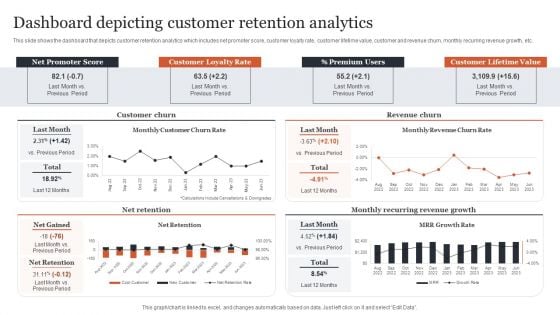
CRM Administration To Reduce Churn Rate Dashboard Depicting Customer Retention Analytics Themes PDF
This slide shows the dashboard that depicts customer retention analytics which includes net promoter score, customer loyalty rate, customer lifetime value, customer and revenue churn, monthly recurring revenue growth, etc. Make sure to capture your audiences attention in your business displays with our gratis customizable CRM Administration To Reduce Churn Rate Dashboard Depicting Customer Retention Analytics Themes PDF. These are great for business strategies, office conferences, capital raising or task suggestions. If you desire to acquire more customers for your tech business and ensure they stay satisfied, create your own sales presentation with these plain slides.
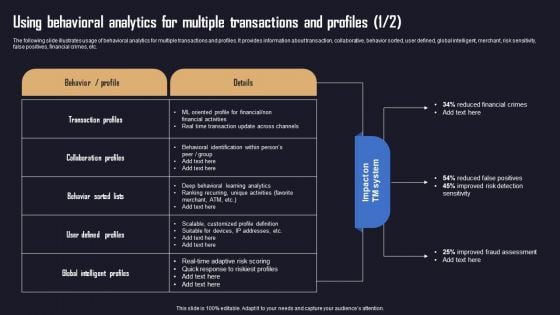
Ensuring Organizational Safety Using AML Transaction Using Behavioral Analytics Microsoft PDF
The following slide illustrates usage of behavioral analytics for multiple transactions and profiles. It provides information about transaction, collaborative, behavior sorted, user defined, global intelligent, merchant, risk sensitivity, false positives, financial crimes, etc. The Ensuring Organizational Safety Using AML Transaction Using Behavioral Analytics Microsoft PDF is a compilation of the most recent design trends as a series of slides. It is suitable for any subject or industry presentation, containing attractive visuals and photo spots for businesses to clearly express their messages. This template contains a variety of slides for the user to input data, such as structures to contrast two elements, bullet points, and slides for written information. Slidegeeks is prepared to create an impression.

Predictive Analytics Methods Random Forest Technique For Classification Model Inspiration PDF
This slide represents the random forest technique to implement a classification model that simultaneously works on individual subsets of sample data. It also includes its working and benefits, including multiple input handling, overfitting resistance, and so on. Create an editable Predictive Analytics Methods Random Forest Technique For Classification Model Inspiration PDF that communicates your idea and engages your audience. Whether you are presenting a business or an educational presentation, pre designed presentation templates help save time. Predictive Analytics Methods Random Forest Technique For Classification Model Inspiration PDF is highly customizable and very easy to edit, covering many different styles from creative to business presentations. Slidegeeks has creative team members who have crafted amazing templates. So, go and get them without any delay.


 Continue with Email

 Home
Home


