data analytics
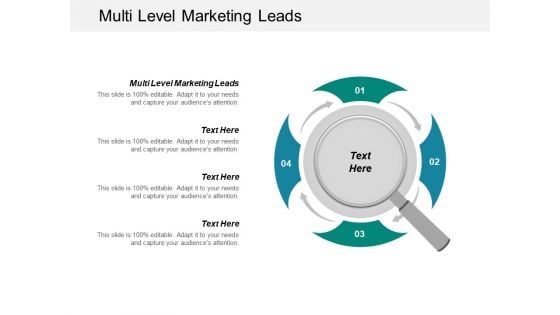
Multi Level Marketing Leads Ppt PowerPoint Presentation File Brochure Cpb
This is a multi level marketing leads ppt powerpoint presentation file brochure cpb. This is a four stage process. The stages in this process are multi level marketing leads.
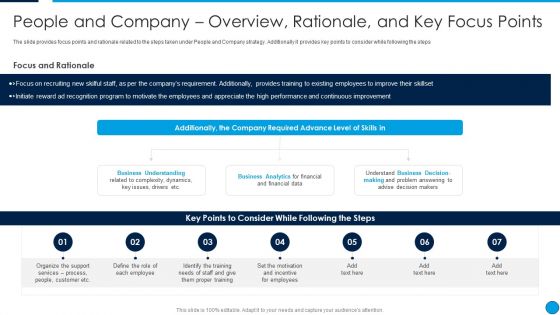
Summary Financial People And Company Overview Rationale And Key Focus Points Elements PDF
The slide provides focus points and rationale related to the steps taken under People and Company strategy. Additionally it provides key points to consider while following the steps. Deliver an awe inspiring pitch with this creative Summary Financial People And Company Overview Rationale And Key Focus Points Elements PDF bundle. Topics like Business Understanding, Business Analytics, Business Decision Making, Financial Data can be discussed with this completely editable template. It is available for immediate download depending on the needs and requirements of the user.
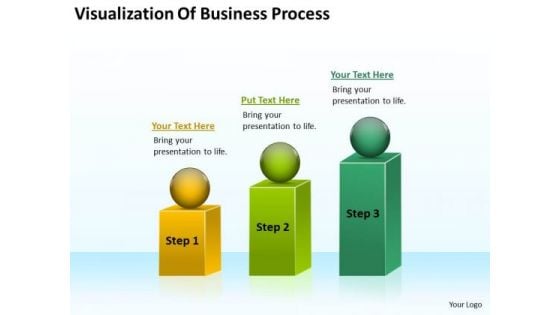
Visualization Of Business Process Ppt Plan PowerPoint Templates
We present our visualization of business process ppt plan PowerPoint templates.Present our Process and Flows PowerPoint Templates because Our PowerPoint Templates and Slides will Embellish your thoughts. They will help you illustrate the brilliance of your ideas. Download and present our Spheres PowerPoint Templates because It will Raise the bar of your Thoughts. They are programmed to take you to the next level. Use our Flow Charts PowerPoint Templates because Our PowerPoint Templates and Slides are conceived by a dedicated team. Use them and give form to your wondrous ideas. Use our Shapes PowerPoint Templates because Our PowerPoint Templates and Slides has conjured up a web of all you need with the help of our great team. Use them to string together your glistening ideas. Download and present our Marketing PowerPoint Templates because Our PowerPoint Templates and Slides will let you Leave a lasting impression to your audiences. They possess an inherent longstanding recall factor.Use these PowerPoint slides for presentations relating to Diagram, chart, market, statistics, square, grow, infograph, bar, corporate, business, vector, success, presentation, growing, circle, finance,analyst, goal, report, marketing, different, accounting, management, graph, illustration, geometric, sphere, design, growth, infographic, progress, profit,information, increase, aim, analyze, financial, rising, measure, block. The prominent colors used in the PowerPoint template are Green, Green lime, Yellow. Make an exhibition characteristic of you. Display your effectiveness on our Visualization Of Business Process Ppt Plan PowerPoint Templates.
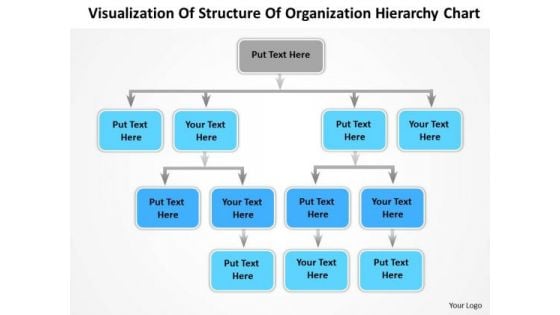
Timeline Visualization Of Structure Of Organization Hierarchy Chart
Timeline crunches are a fact of life. Meet all deadlines using our Timeline Visualization Of Structure Of Organization Hierarchy Chart. Connect the dots using our Timeline Visualization Of Structure Of Organization Hierarchy Chart. Fan expectations as the whole picture emerges.
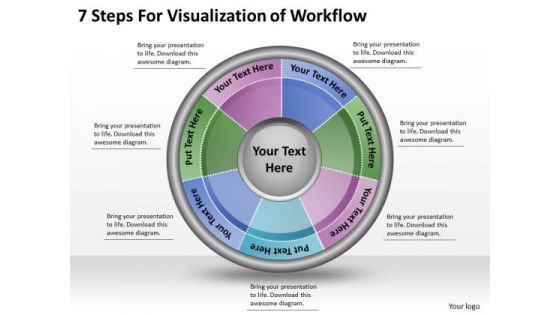
Timeline Ppt Template 7 Steps For Visualization Of Workflow
Get The Domestics Right With Our Timeline Ppt Template 7 Steps For Visualization Of Workflow Powerpoint Templates. Create The Base For Thoughts To Grow.
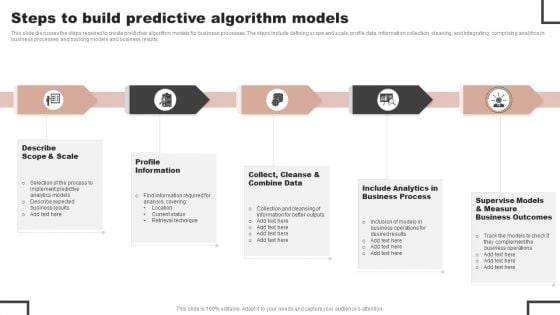
Forecast Analysis Technique IT Steps To Build Predictive Algorithm Models Mockup PDF
This slide discusses the steps required to create predictive algorithm models for business processes. The steps include defining scope and scale, profile data, information collection, cleaning, and integrating, comprising analytics in business processes, and tracking models and business results. Do you have an important presentation coming up Are you looking for something that will make your presentation stand out from the rest Look no further than Forecast Analysis Technique IT Steps To Build Predictive Algorithm Models Mockup PDF. With our professional designs, you can trust that your presentation will pop and make delivering it a smooth process. And with Slidegeeks, you can trust that your presentation will be unique and memorable. So why wait Grab Forecast Analysis Technique IT Steps To Build Predictive Algorithm Models Mockup PDF today and make your presentation stand out from the rest.
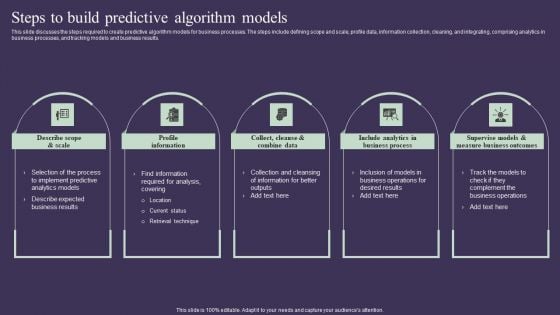
Projection Model Steps To Build Predictive Algorithm Models Graphics PDF
This slide discusses the steps required to create predictive algorithm models for business processes. The steps include defining scope and scale, profile data, information collection, cleaning, and integrating, comprising analytics in business processes, and tracking models and business results. Do you have an important presentation coming up Are you looking for something that will make your presentation stand out from the rest Look no further than Projection Model Steps To Build Predictive Algorithm Models Graphics PDF. With our professional designs, you can trust that your presentation will pop and make delivering it a smooth process. And with Slidegeeks, you can trust that your presentation will be unique and memorable. So why wait Grab Projection Model Steps To Build Predictive Algorithm Models Graphics PDF today and make your presentation stand out from the rest
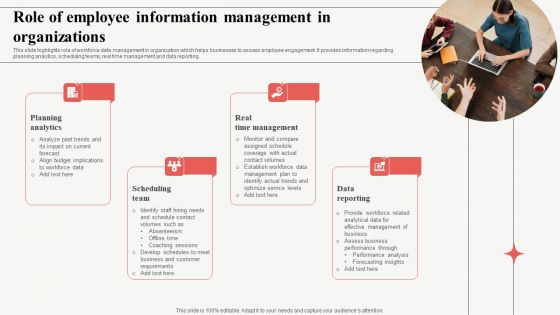
Role Of Employee Information Management In Organizations Themes PDF
This slide highlights role of workforce data management in organization which helps businesses to assess employee engagement. It provides information regarding planning analytics, scheduling teams, real time management and data reporting. Persuade your audience using this Role Of Employee Information Management In Organizations Themes PDF. This PPT design covers four stages, thus making it a great tool to use. It also caters to a variety of topics including Planning Analytics, Scheduling Team, Real Time Management. Download this PPT design now to present a convincing pitch that not only emphasizes the topic but also showcases your presentation skills.
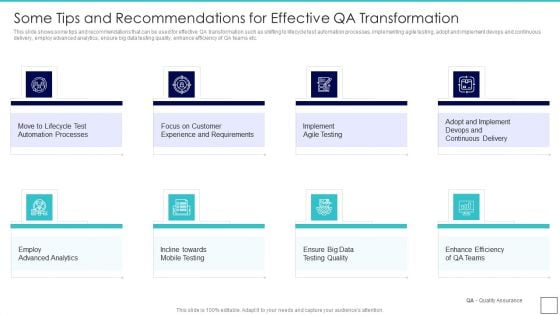
Deploying Quality Assurance QA Transformation Some Tips And Recommendations For Effective Slides PDF
This slide shows some tips and recommendations that can be used for effective QA transformation such as shifting to lifecycle test automation processes, implementing agile testing, adopt and implement devops and continuous delivery, employ advanced analytics, ensure big data testing quality, enhance efficiency of QA teams etc. This is a Deploying Quality Assurance QA Transformation Some Tips And Recommendations For Effective Slides PDF template with various stages. Focus and dispense information on eight stages using this creative set, that comes with editable features. It contains large content boxes to add your information on topics like Automation Processes, Experience And Requirements, Implement Agile Testing You can also showcase facts, figures, and other relevant content using this PPT layout. Grab it now.
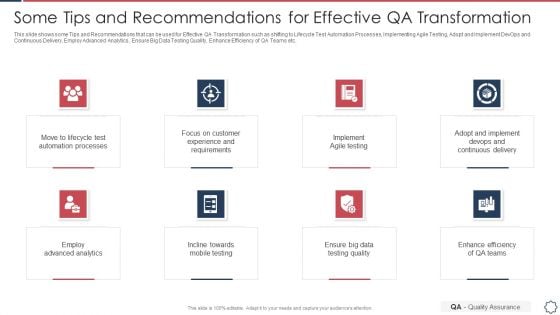
Quality Assurance Transformation Strategies To Improve Business Performance Efficiency Some Tips And Recommendations Formats PDF
This slide shows some Tips and Recommendations that can be used for Effective QA Transformation such as shifting to Lifecycle Test Automation Processes, Implementing Agile Testing, Adopt and Implement DevOps and Continuous Delivery, Employ Advanced Analytics, Ensure Big Data Testing Quality, Enhance Efficiency of QA Teams etc. Presenting quality assurance transformation strategies to improve business performance efficiency some tips and recommendations formats pdf to provide visual cues and insights. Share and navigate important information on eight stages that need your due attention. This template can be used to pitch topics like automation processes, experience and requirements, implement agile testing, continuous delivery, mobile testing. In addtion, this PPT design contains high resolution images, graphics, etc, that are easily editable and available for immediate download.
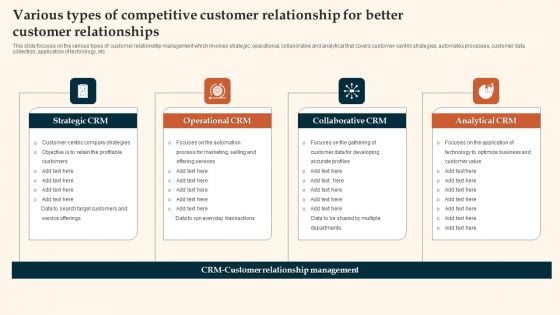
Various Types Of Competitive Customer Relationship For Better Customer Relationships Slides PDF
This slide focuses on the various types of customer relationship management which involves strategic, operational, collaborative and analytical that covers customer centric strategies, automates processes, customer data collection, application of technology, etc. Persuade your audience using this Various Types Of Competitive Customer Relationship For Better Customer Relationships Slides PDF. This PPT design covers four stages, thus making it a great tool to use. It also caters to a variety of topics including Operational CRM, Collaborative CRM, Analytical CRM, Strategic CRM. Download this PPT design now to present a convincing pitch that not only emphasizes the topic but also showcases your presentation skills.
Statistics Dashboard Vector Icon Ppt PowerPoint Presentation Pictures Visual Aids
Presenting this set of slides with name statistics dashboard vector icon ppt powerpoint presentation pictures visual aids. This is a one stage process. The stages in this process are data visualization icon, research analysis, business focus. This is a completely editable PowerPoint presentation and is available for immediate download. Download now and impress your audience.
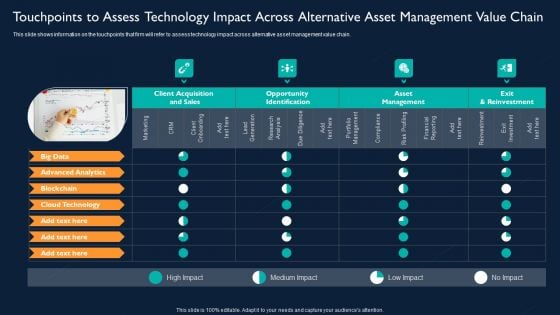
Touchpoints To Assess Technology Impact Across Alternative Asset Management Value Chain Mockup PDF
This slide shows information on the touchpoints that firm will refer to assess technology impact across alternative asset management value chain. Presenting Touchpoints To Assess Technology Impact Across Alternative Asset Management Value Chain Mockup PDF to provide visual cues and insights. Share and navigate important information on four stages that need your due attention. This template can be used to pitch topics like Advanced Analytics, Cloud Technology, Blockchain, Big Data. In addtion, this PPT design contains high resolution images, graphics, etc, that are easily editable and available for immediate download.
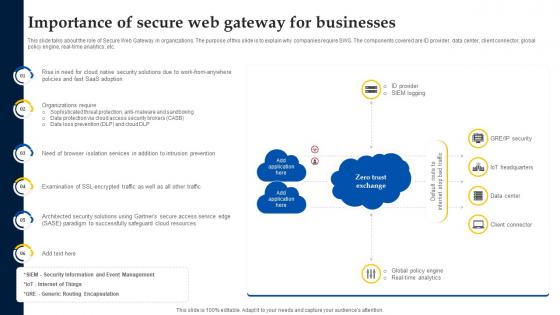
Web Access Control Solution Importance Of Secure Web Gateway For Businesses
This slide talks about the role of Secure Web Gateway in organizations. The purpose of this slide is to explain why companies require SWG. The components covered are ID provider, data center, client connector, global policy engine, real-time analytics, etc. Explore a selection of the finest Web Access Control Solution Importance Of Secure Web Gateway For Businesses here. With a plethora of professionally designed and pre-made slide templates, you can quickly and easily find the right one for your upcoming presentation. You can use our Web Access Control Solution Importance Of Secure Web Gateway For Businesses to effectively convey your message to a wider audience. Slidegeeks has done a lot of research before preparing these presentation templates. The content can be personalized and the slides are highly editable. Grab templates today from Slidegeeks. This slide talks about the role of Secure Web Gateway in organizations. The purpose of this slide is to explain why companies require SWG. The components covered are ID provider, data center, client connector, global policy engine, real-time analytics, etc.

Incorporating HIS To Enhance Healthcare Services Comparative Analysis Of Health Management Information System Tools Summary PDF
This slide covers comparative assessment of health management information tool to select suitable one. It involves features such as clinical database, data compliance, enhanced security and healthcare analytics. Do you have to make sure that everyone on your team knows about any specific topic I yes, then you should give Incorporating HIS To Enhance Healthcare Services Comparative Analysis Of Health Management Information System Tools Summary PDF a try. Our experts have put a lot of knowledge and effort into creating this impeccable Incorporating HIS To Enhance Healthcare Services Comparative Analysis Of Health Management Information System Tools Summary PDF. You can use this template for your upcoming presentations, as the slides are perfect to represent even the tiniest detail. You can download these templates from the Slidegeeks website and these are easy to edit. So grab these today.
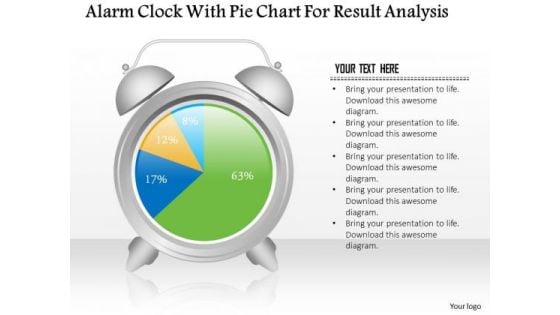
Business Diagram Alarm Clock With Pie Chart For Result Analysis PowerPoint Slide
This business slide displays alarm clock with pie chart. This diagram is a data visualization tool that gives you a simple way to present statistical information. This slide helps your audience examine and interpret the data you present.

Human Resources Planning Development Methods Ppt PowerPoint Presentation Complete Deck With Slides
This is a human resources planning development methods ppt powerpoint presentation complete deck with slides. This is a one stage process. The stages in this process are finance, data analysis, graph representation, planning, process.
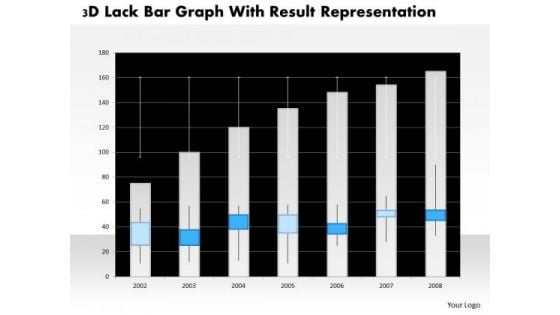
Business Diagram 3d Lack Bar Graph With Result Representation PowerPoint Slide
This business diagram has graphic of 3d lack bar graph. This diagram is a data visualization tool that gives you a simple way to present statistical information. This slide helps your audience examine and interpret the data you present.
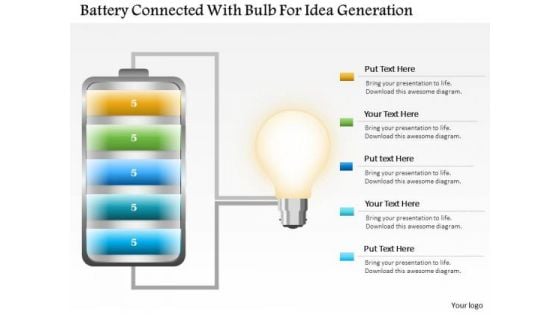
Business Diagram Battery Connected With Bulb For Idea Generation PowerPoint Slide
This business slide displays battery icon connected with bulb. This diagram is a data visualization tool that gives you a simple way to present statistical information. This slide helps your audience examine and interpret the data you present.
Bar Graph Icon For Research Analysis Ppt PowerPoint Presentation Summary Portfolio
Presenting this set of slides with name bar graph icon for research analysis ppt powerpoint presentation summary portfolio. This is a three stage process. The stages in this process are data visualization icon, research analysis, business focus. This is a completely editable PowerPoint presentation and is available for immediate download. Download now and impress your audience.
Information Visualization Vector Icon Ppt PowerPoint Presentation Ideas Microsoft
Presenting this set of slides with name information visualization vector icon ppt powerpoint presentation ideas microsoft. This is a three stage process. The stages in this process are data visualization icon, research analysis, business focus. This is a completely editable PowerPoint presentation and is available for immediate download. Download now and impress your audience.
Business Performance Graph On Screen Icon Ppt PowerPoint Presentation Show Layouts
Presenting this set of slides with name business performance graph on screen icon ppt powerpoint presentation show layouts. This is a three stage process. The stages in this process are data visualization icon, research analysis, business focus. This is a completely editable PowerPoint presentation and is available for immediate download. Download now and impress your audience.
Business Performance Mapping Vector Icon Ppt PowerPoint Presentation Outline Show
Presenting this set of slides with name business performance mapping vector icon ppt powerpoint presentation outline show. This is a three stage process. The stages in this process are data visualization icon, research analysis, business focus. This is a completely editable PowerPoint presentation and is available for immediate download. Download now and impress your audience.
Computer Screen With Cloud Icon Ppt PowerPoint Presentation Outline Designs
Presenting this set of slides with name computer screen with cloud icon ppt powerpoint presentation outline designs. This is a three stage process. The stages in this process are data visualization icon, research analysis, business focus. This is a completely editable PowerPoint presentation and is available for immediate download. Download now and impress your audience.
Illustration Of Business Trends Icon Ppt PowerPoint Presentation Gallery Example
Presenting this set of slides with name illustration of business trends icon ppt powerpoint presentation gallery example. This is a two stage process. The stages in this process are data visualization icon, research analysis, business focus. This is a completely editable PowerPoint presentation and is available for immediate download. Download now and impress your audience.
Business Focus Vector Icon Ppt PowerPoint Presentation Portfolio Background Image
Presenting this set of slides with name business focus vector icon ppt powerpoint presentation portfolio background image. This is a one stage process. The stages in this process are data visualization icon, research analysis, business focus. This is a completely editable PowerPoint presentation and is available for immediate download. Download now and impress your audience.
Human Eye Observation And Monitoring Icon Ppt PowerPoint Presentation Layouts Graphics
Presenting this set of slides with name human eye observation and monitoring icon ppt powerpoint presentation layouts graphics. This is a three stage process. The stages in this process are data visualization icon, research analysis, business focus. This is a completely editable PowerPoint presentation and is available for immediate download. Download now and impress your audience.
Upward Profit Growth Arrow Graph Vector Icon Ppt PowerPoint Presentation Styles Templates
Presenting this set of slides with name upward profit growth arrow graph vector icon ppt powerpoint presentation styles templates. This is a one stage process. The stages in this process are data visualization icon, research analysis, business focus. This is a completely editable PowerPoint presentation and is available for immediate download. Download now and impress your audience.
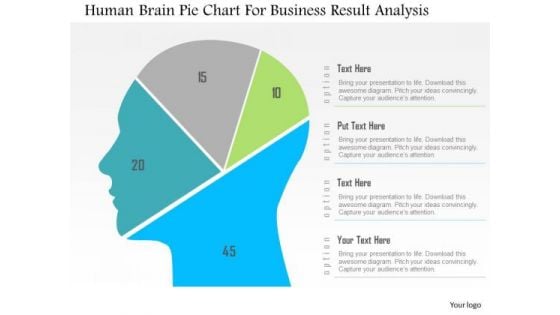
Business Diagram Human Brain Pie Chart For Business Result Analysis PowerPoint Slide
This diagram displays human face graphic divided into sections. This section can be used for data display. Use this diagram to build professional presentations for your viewers.
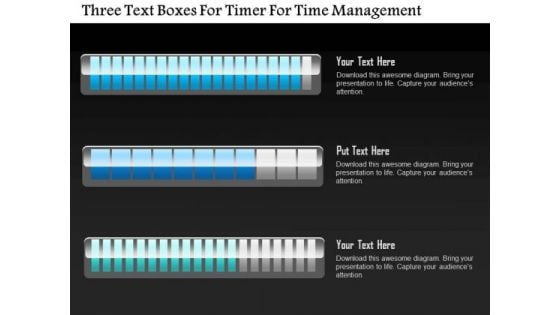
Business Diagram Three Text Boxes For Timer For Time Management PowerPoint Slide
This business diagram displays three text boxes. This diagram contains text boxes for data representation. Use this diagram to display business process workflows in any presentations.
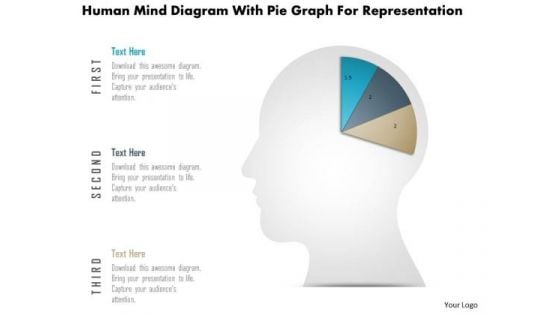
Business Diagram Human Mind Diagram With Pie Graph For Representation PowerPoint Slide
This diagram displays human face graphic divided into sections. This section can be used for data display. Use this diagram to build professional presentations for your viewers.
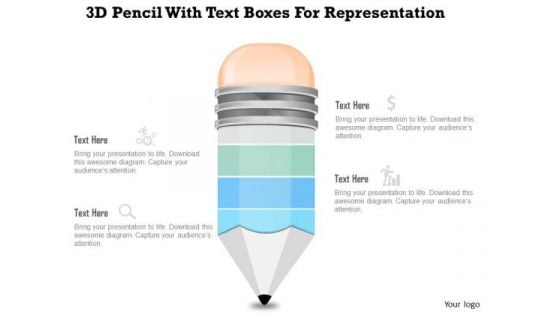
Business Diagram 3d Pencil With Text Boxes For Representation PowerPoint Slide
This Power Point diagram displays graphic of pencil with icons and text spaces. It contains diagram of colorful pencil for data display. Use this diagram to build professional presentations for your viewers.
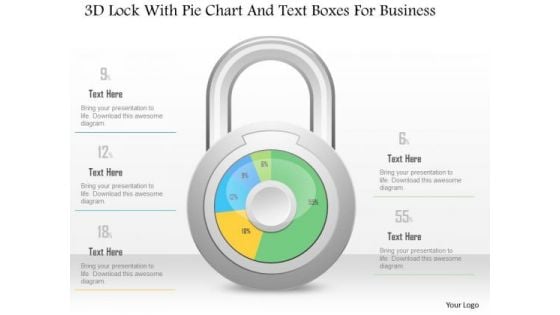
Business Diagram 3d Lock With Pie Chart And Text Boxes For Business PowerPoint Slide
This Power Point diagram has been crafted with pie chart in shape of lock. It contains diagram of lock pie chart to compare and present data in an effective manner. Use this diagram to build professional presentations for your viewers.
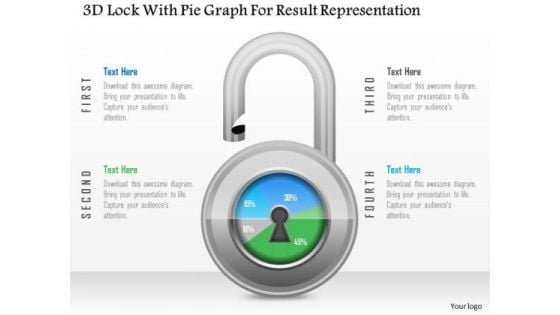
Business Diagram 3d Lock With Pie Graph For Result Representation PowerPoint Slide
This Power Point diagram has been crafted with pie chart in shape of lock. It contains diagram of lock pie chart to compare and present data in an effective manner. Use this diagram to build professional presentations for your viewers.
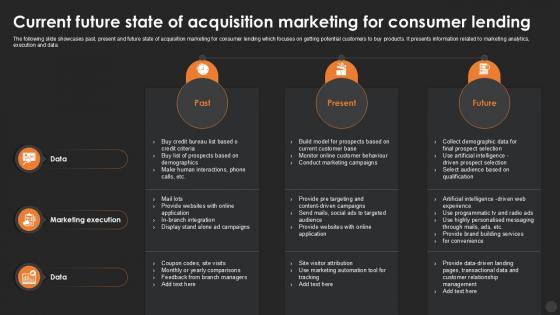
Current Future State Of Acquisition Marketing For Consumer Lending
This modern and well-arranged Current Future State Of Acquisition Marketing For Consumer Lending provides lots of creative possibilities. It is very simple to customize and edit with the Powerpoint Software. Just drag and drop your pictures into the shapes. All facets of this template can be edited with Powerpoint, no extra software is necessary. Add your own material, put your images in the places assigned for them, adjust the colors, and then you can show your slides to the world, with an animated slide included. The following slide illustrates the past, present, and future states of acquisition marketing for consumer lending, with a focus on attracting potential customers to purchase products. It includes information on marketing analytics, execution, and data.
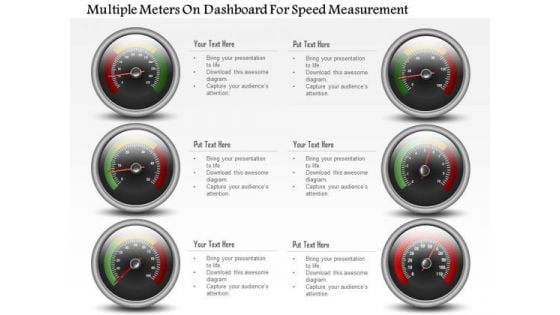
Business Diagram Multiple Meters On Dashboard For Speed Measurement PowerPoint Slide
This business diagram has been designed with multiple meters on dashboard. This slide can be used for business planning and progress. Use this diagram for your business and success milestones related presentations.
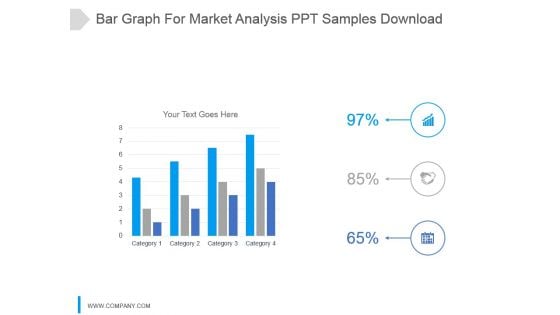
Bar Graph For Market Analysis Ppt Samples Download
This is a bar graph for market analysis ppt samples download. This is a four stage process. The stages in this process are category.
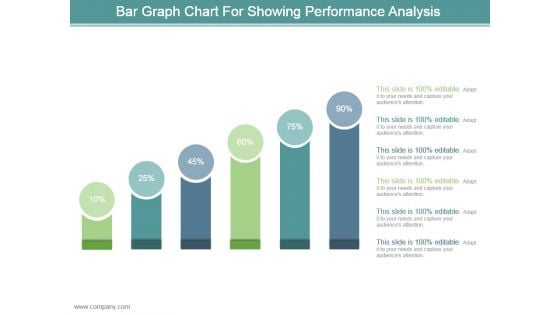
Bar Graph Chart For Showing Performance Analysis Ppt Design
This is a bar graph chart for showing performance analysis ppt design. This is a six stage process. The stages in this process are business, marketing, process, success, presentation.
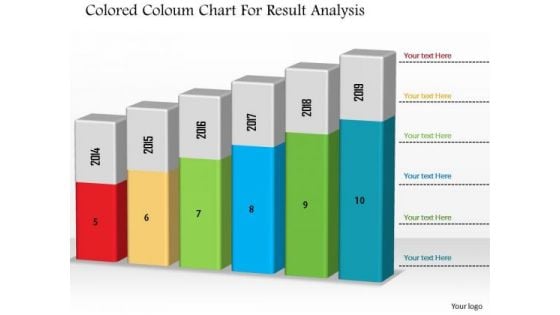
Business Diagram Colored Column Chart For Result Analysis PowerPoint Slide
This Power Point diagram has been designed with graphic of column chart. It contains diagram of bar char depicting annual business progress report. Use this diagram to build professional presentations for your viewers.
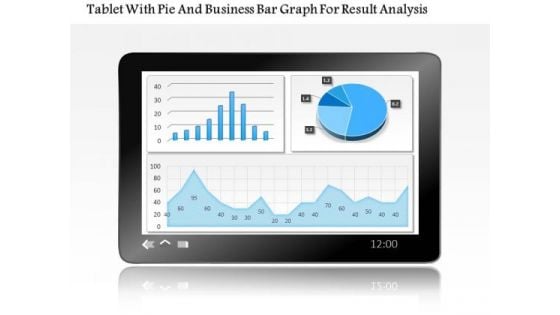
Business Diagram Tablet With Pie And Business Bar Graph For Result Analysis PowerPoint Slide
This PowerPoint template displays technology gadgets with various business charts. Use this diagram slide, in your presentations to make business reports for statistical analysis. You may use this diagram to impart professional appearance to your presentations.
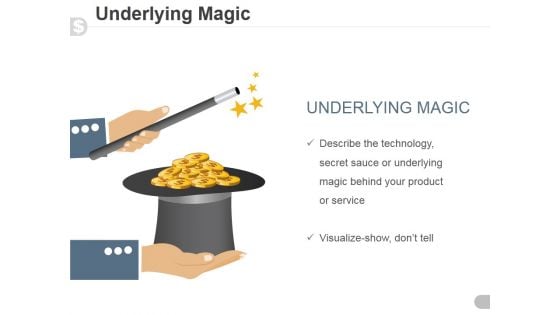
Underlying Magic Ppt PowerPoint Presentation Inspiration
This is a underlying magic ppt powerpoint presentation inspiration. This is a one stage process. The stages in this process are business, marketing, magic, technology, product.
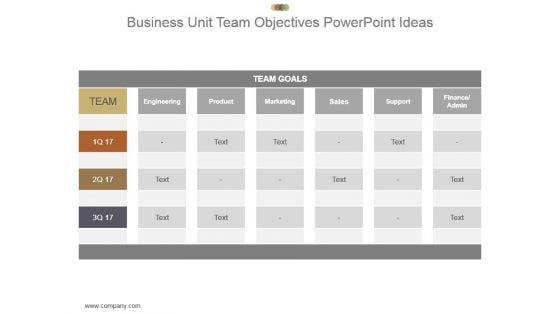
Business Unit Team Objectives Powerpoint Ideas
This is a business unit team objectives powerpoint ideas. This is a four stage process. The stages in this process are team, team goals, engineering, product, marketing, sales, support, finance admin.
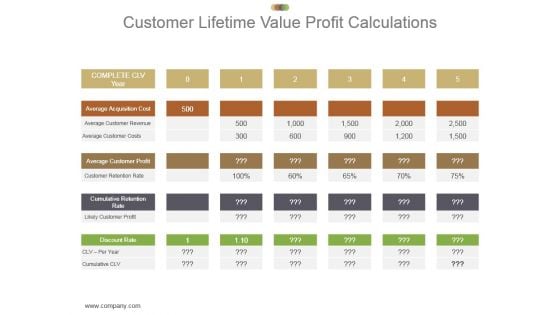
Customer Lifetime Value Profit Calculations Ppt Presentation
This is a customer lifetime value profit calculations ppt presentation. This is a five stage process. The stages in this process are complete clv year, average acquisition cost, average customer revenue, average customer costs, average customer profit, customer retention rate, cumulative retention rate, likely customer profit, discount rate.
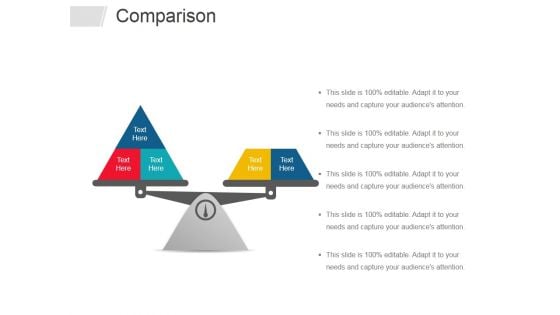
Comparison Ppt PowerPoint Presentation Infographic Template Graphics Tutorials
This is a comparison ppt powerpoint presentation infographic template graphics tutorials. This is a two stage process. The stages in this process are comparison, planning, business, management, marketing.
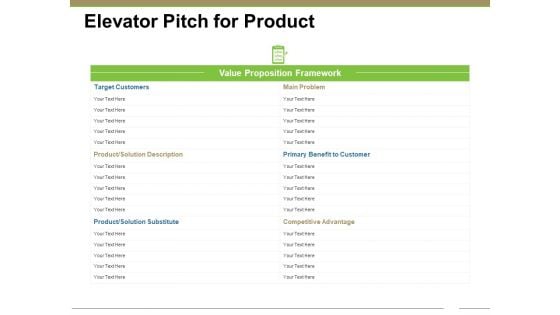
Elevator Pitch For Product Ppt PowerPoint Presentation Infographic Template Infographic Template
This is a elevator pitch for product ppt powerpoint presentation infographic template infographic template. This is a three stage process. The stages in this process are target customers, main problem, primary benefit to customer, competitive advantage, product solution description.

ROI Calculation Ppt PowerPoint Presentation Complete Deck With Slides
This is a roi calculation ppt powerpoint presentation complete deck with slides. This is a one stage process. The stages in this process are business, planning, strategy, marketing, management.

Business Diagram Six Staged Pie Charts For Text Representation PowerPoint Slide
This slide displays graphic six staged pie charts. Download this diagram to present and compare business data. Use this diagram to display business process workflows in any presentation.
Business Diagram Human Icons With Bubbles And Different Icons Inside PowerPoint Slide
This diagram displays graph with percentage value growth. This business slide is suitable to present and compare business data. Use this diagram to build professional presentations for your viewers.

Business Diagram Three Staged Pencil Diagram For Graph Formation PowerPoint Slide
This business diagram displays set of pencils. This Power Point template has been designed to compare and present business data. Download this diagram to represent stages of business growth.
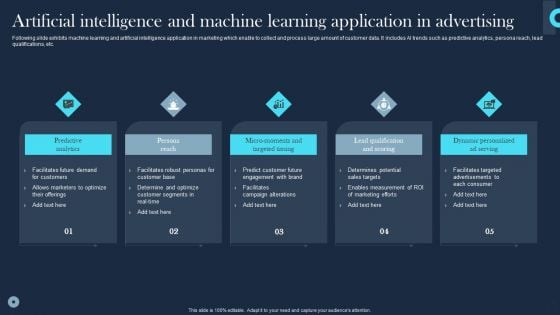
Artificial Intelligence And Machine Learning Application In Advertising Themes PDF
Following slide exhibits machine learning and artificial intelligence application in marketing which enable to collect and process large amount of customer data. It includes AI trends such as predictive analytics, persona reach, lead qualifications, etc. Presenting Artificial Intelligence And Machine Learning Application In Advertising Themes PDF to dispense important information. This template comprises three stages. It also presents valuable insights into the topics including Predictive Analytics, Persona Reach, Scoring. This is a completely customizable PowerPoint theme that can be put to use immediately. So, download it and address the topic impactfully.
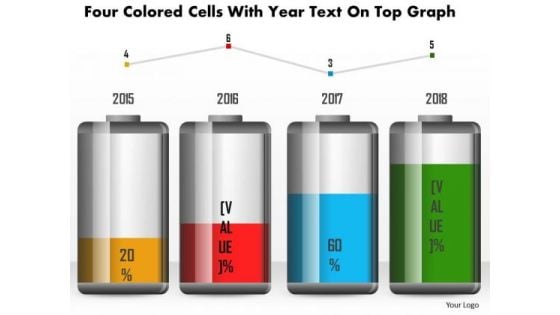
Business Diagram Four Colored Cells With Year Text On Top Graph PowerPoint Slide
This business diagram has been designed with battery cell graphic for business timeline. This slide can be used for business planning and management. Use this diagram for your business and success milestones related presentations.
Business Diagram Battery Icon With Power Icons Energy Technology PowerPoint Slide
This business diagram displays battery icon with power charging. Use this diagram, in your presentations to display energy saving, battery and technology. Create professional presentations using this diagram slide.
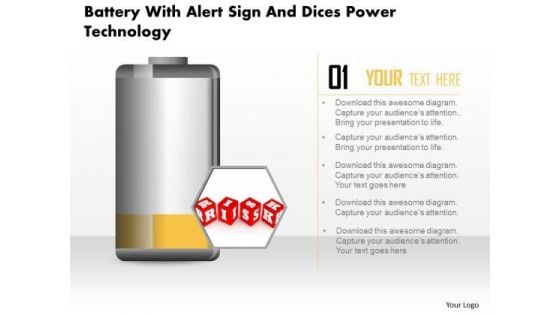
Business Diagram Battery With Alert Sign And Dices Power Technology PowerPoint Slide
This business diagram displays risk alert on battery icon. Use this diagram, in your presentations to display energy saving, battery and technology. Create professional presentations using this diagram slide.
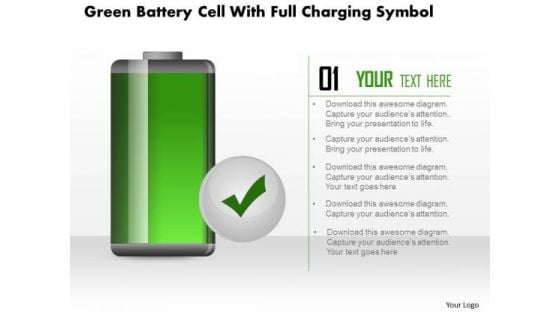
Business Diagram Green Battery Cell With Full Charging Symbol PowerPoint Slide
This business diagram displays full battery charge icon. Use this diagram, in your presentations to display energy saving, battery and technology. Create professional presentations using this diagram slide.
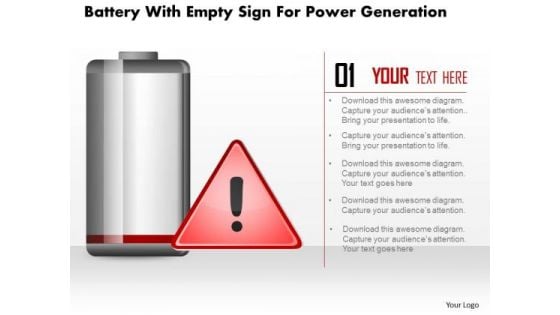
Business Diagram Battery With Empty Sign For Power Generation PowerPoint Slide
This business diagram displays empty sign alert on battery icon. Use this diagram, in your presentations to display energy saving, battery and technology. Create professional presentations using this diagram slide.
Business Diagram Hour Glass With 3d Man And Icons PowerPoint Slide
This diagram displays 3d man with hour glass and icons. This diagram contains concept of communication and technology. Use this diagram to display business process workflows in any presentations.
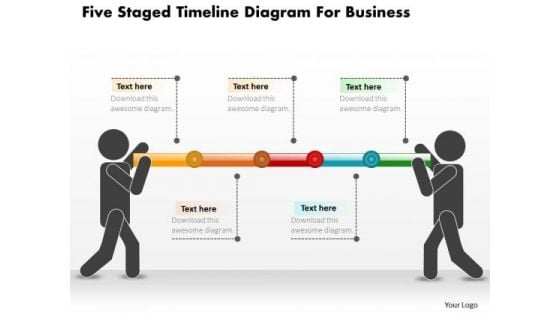
Business Diagram Five Staged Timeline Diagram For Business PowerPoint Slide
This PowerPoint template displays five points timeline diagram. This business diagram has been designed with graphic of timeline with five points, text space and start, end points. Use this diagram, in your presentations to display process steps, stages, timelines and business management. Make wonderful presentations using this business slide.
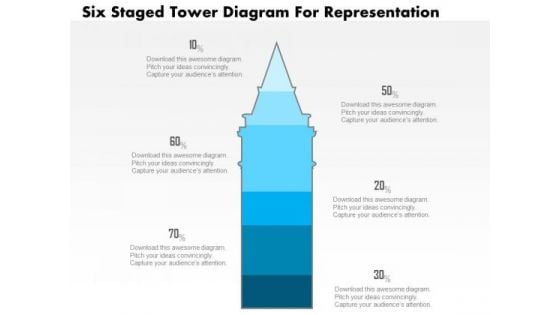
Business Diagram Five Staged Tower Diagram For Representation PowerPoint Slide
This business slide displays five staged tower diagram. It contains blue tower graphic divided into five parts. This diagram slide depicts processes, stages, steps, points, options information display. Use this diagram, in your presentations to express your views innovatively.
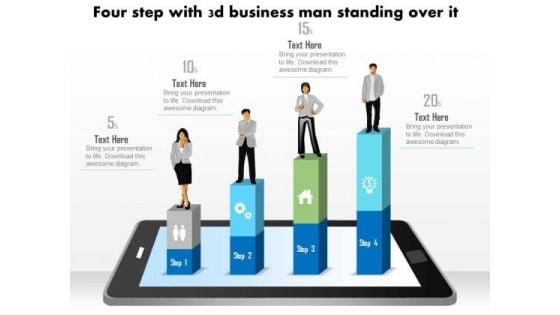
Business Diagram Four Steps With 3d Business Person Standing Over It PowerPoint Slide
This business diagram displays bar graph with business person standing on it. This Power Point template has been designed to display personal growth. You may use this diagram to impart professional appearance to your presentations.
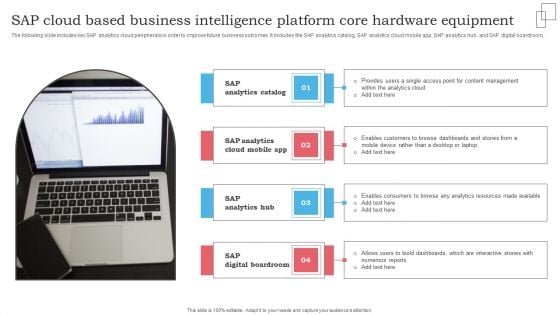
SAP Cloud Based Business Intelligence Platform Core Hardware Equipment Clipart PDF
The following slide includes key SAP analytics cloud peripherals in order to improve future business outcomes. It includes the SAP analytics catalog, SAP analytics cloud mobile app, SAP analytics hub, and SAP digital boardroom. Presenting SAP Cloud Based Business Intelligence Platform Core Hardware Equipment Clipart PDF to dispense important information. This template comprises four stages. It also presents valuable insights into the topics including SAP Analytics Catalog, SAP Analytics Cloud Mobile, SAP Analytics Hub. This is a completely customizable PowerPoint theme that can be put to use immediately. So, download it and address the topic impactfully.


 Continue with Email

 Home
Home


