data management
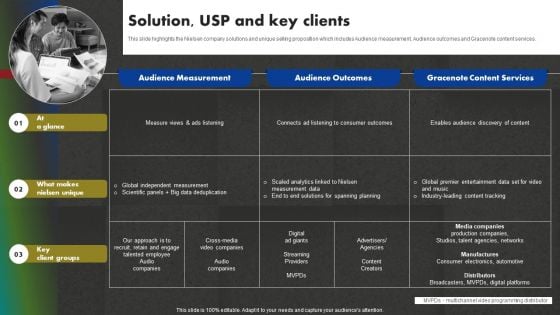
Data And Customer Analysis Company Outline Solution USP And Key Clients Microsoft PDF
Five Boxes Effective Data Collection Ppt PowerPoint Presentation Complete Deck With Slides
Share a great deal of information on the topic by deploying this five boxes effective data collection ppt powerpoint presentation complete deck with slides. Support your ideas and thought process with this prefabricated set. It includes a set of nine slides, all fully modifiable and editable. Each slide can be restructured and induced with the information and content of your choice. You can add or remove large content boxes as well, to make this PPT slideshow more personalized. Its high-quality graphics and visuals help in presenting a well-coordinated pitch. This PPT template is also a resourceful tool to take visual cues from and implement the best ideas to help your business grow and expand. The main attraction of this well-formulated deck is that everything is editable, giving you the freedom to adjust it to your liking and choice. Changes can be made in the background and theme as well to deliver an outstanding pitch. Therefore, click on the download button now to gain full access to this multifunctional set.
Marketers Guide To Data Analysis Optimization Website Landing Page KPI Tracking Dashboard Information PDF
This slide covers a dashboard for analyzing the metrics of the website landing page. It includes KPIs such as conversions, conversion rate, sessions, bounce rate, engagement sickness, etc. Present like a pro with Marketers Guide To Data Analysis Optimization Website Landing Page KPI Tracking Dashboard Information PDF Create beautiful presentations together with your team, using our easy to use presentation slides. Share your ideas in real time and make changes on the fly by downloading our templates. So whether you are in the office, on the go, or in a remote location, you can stay in sync with your team and present your ideas with confidence. With Slidegeeks presentation got a whole lot easier. Grab these presentations today.
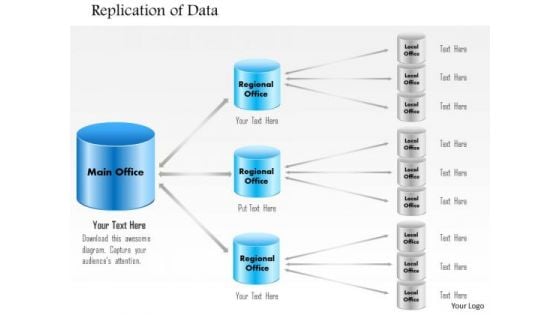
1 Replication Of Data From Main Office To Regional Office To Branch Offices Ppt Slide
This image slide explains the concept database replication in an organization. This image slide has been designed with graphic of database system transfers in main, regional and local office branches. You may change color, size and orientation of any icon to your liking. Use this image slide, in your presentations to express views on backup, storage, networking, communication and technology. Create wonderful presentations using this image slide.
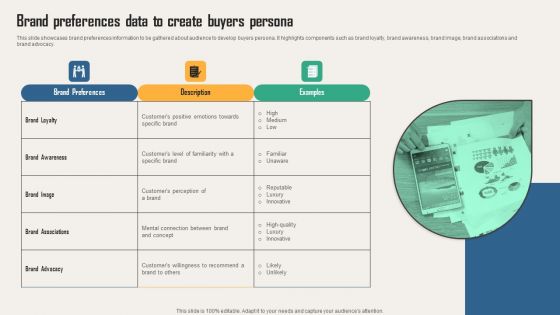
Creating Customer Personas For Customizing Brand Preferences Data To Create Buyers Elements PDF
This slide showcases brand preferences information to be gathered about audience to develop buyers persona. It highlights components such as brand loyalty, brand awareness, brand image, brand associations and brand advocacy. Present like a pro with Creating Customer Personas For Customizing Brand Preferences Data To Create Buyers Elements PDF Create beautiful presentations together with your team, using our easy-to-use presentation slides. Share your ideas in real-time and make changes on the fly by downloading our templates. So whether you are in the office, on the go, or in a remote location, you can stay in sync with your team and present your ideas with confidence. With Slidegeeks presentation got a whole lot easier. Grab these presentations today.
Significance Of Understanding Stages Of Buyers Journey Guide For Data Driven Advertising Icons Pdf
This slide represents the overview of phases of buyers journey to understand buyers behavior and mindset at various stages of his journey. It includes details related to three stages of buyers journey such as awareness, consideration and decision.Welcome to our selection of the Significance Of Understanding Stages Of Buyers Journey Guide For Data Driven Advertising Icons Pdf. These are designed to help you showcase your creativity and bring your sphere to life. Planning and Innovation are essential for any business that is just starting out. This collection contains the designs that you need for your everyday presentations. All of our PowerPoints are 100Precent editable, so you can customize them to suit your needs. This multi-purpose template can be used in various situations. Grab these presentation templates today. This slide represents the overview of phases of buyers journey to understand buyers behavior and mindset at various stages of his journey. It includes details related to three stages of buyers journey such as awareness, consideration and decision.
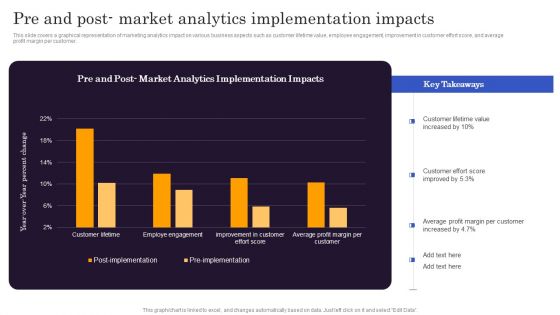
Marketers Guide To Data Analysis Optimization Pre And Post Market Analytics Implementation Impacts Formats PDF
This slide covers a graphical representation of marketing analytics impact on various business aspects such as customer lifetime value, employee engagement, improvement in customer effort score, and average profit margin per customer. Do you know about Slidesgeeks Marketers Guide To Data Analysis Optimization Pre And Post Market Analytics Implementation Impacts Formats PDF. These are perfect for delivering any kind od presentation. Using it, create PowerPoint presentations that communicate your ideas and engage audiences. Save time and effort by using our pre designed presentation templates that are perfect for a wide range of topic. Our vast selection of designs covers a range of styles, from creative to business, and are all highly customizable and easy to edit. Download as a PowerPoint template or use them as Google Slides themes.
BI Technique For Data Informed Decisions Global Market Landscape Of Sap Analytics Cloud Suite Icons PDF
The purpose of this slide is to showcase the global market landscape of SAP analytics cloud as BI tool. It also contains information regarding the business intelligence BI software market share and SAP analytics cloud customers by industry. Are you in need of a template that can accommodate all of your creative concepts This one is crafted professionally and can be altered to fit any style. Use it with Google Slides or PowerPoint. Include striking photographs, symbols, depictions, and other visuals. Fill, move around, or remove text boxes as desired. Test out color palettes and font mixtures. Edit and save your work, or work with colleagues. Download BI Technique For Data Informed Decisions Global Market Landscape Of Sap Analytics Cloud Suite Icons PDF and observe how to make your presentation outstanding. Give an impeccable presentation to your group and make your presentation unforgettable.
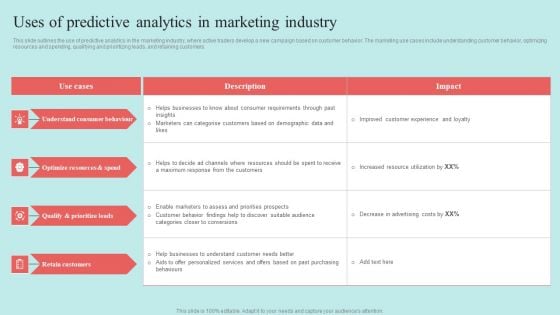
Predictive Data Model Uses Of Predictive Analytics In Marketing Industry Themes PDF
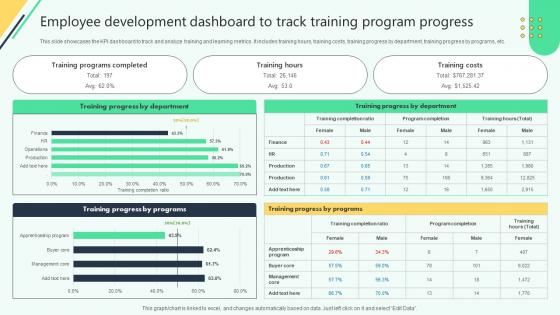
Employee Development Dashboard To Track Training Analysing Hr Data For Effective Decision Making
This slide showcases the KPI dashboard to track and analyze training and learning metrics. It includes training hours, training costs, training progress by department, training progress by programs, etc. Are you in need of a template that can accommodate all of your creative concepts This one is crafted professionally and can be altered to fit any style. Use it with Google Slides or PowerPoint. Include striking photographs, symbols, depictions, and other visuals. Fill, move around, or remove text boxes as desired. Test out color palettes and font mixtures. Edit and save your work, or work with colleagues. Download Employee Development Dashboard To Track Training Analysing Hr Data For Effective Decision Making and observe how to make your presentation outstanding. Give an impeccable presentation to your group and make your presentation unforgettable. This slide showcases the KPI dashboard to track and analyze training and learning metrics. It includes training hours, training costs, training progress by department, training progress by programs, etc.
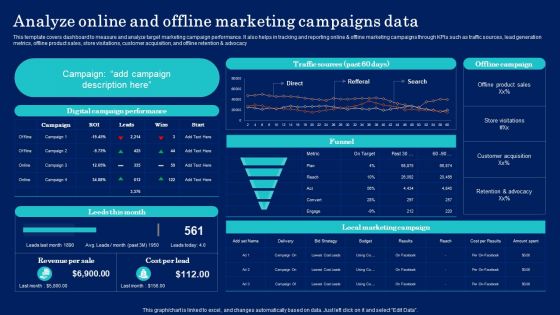
Why Target Market Identification Analyze Online And Offline Marketing Campaigns Data Topics PDF
This template covers dashboard to measure and analyze target marketing campaign performance. It also helps in tracking and reporting online and offline marketing campaigns through KPIs such as traffic sources, lead generation metrics, offline product sales, store visitations, customer acquisition, and offline retention and advocacy. Boost your pitch with our creative Why Target Market Identification Analyze Online And Offline Marketing Campaigns Data Topics PDF. Deliver an awe inspiring pitch that will mesmerize everyone. Using these presentation templates you will surely catch everyones attention. You can browse the ppts collection on our website. We have researchers who are experts at creating the right content for the templates. So you do not have to invest time in any additional work. Just grab the template now and use them.
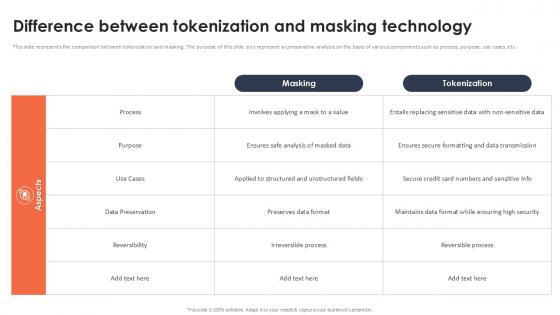
Difference Between Tokenization And Masking Technology Securing Your Data Ppt Powerpoint
This slide represents the comparison between tokenization and masking. The purpose of this slide is to represent a comparative analysis on the basis of various components such as process, purpose, use cases, etc. Are you in need of a template that can accommodate all of your creative concepts This one is crafted professionally and can be altered to fit any style. Use it with Google Slides or PowerPoint. Include striking photographs, symbols, depictions, and other visuals. Fill, move around, or remove text boxes as desired. Test out color palettes and font mixtures. Edit and save your work, or work with colleagues. Download Difference Between Tokenization And Masking Technology Securing Your Data Ppt Powerpoint and observe how to make your presentation outstanding. Give an impeccable presentation to your group and make your presentation unforgettable. This slide represents the comparison between tokenization and masking. The purpose of this slide is to represent a comparative analysis on the basis of various components such as process, purpose, use cases, etc.
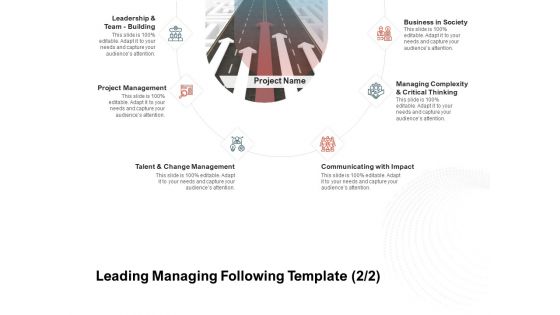
Team Manager Administration Leading Managing Following Template Project Management Slides Pdf
Presenting team manager administration leading managing following template project management slides pdf. to provide visual cues and insights. Share and navigate important information on six stages that need your due attention. This template can be used to pitch topics like business society, leadership, team building, project management, communicating impac, talent change management, managing complexity critical thinking. In addtion, this PPT design contains high-resolution images, graphics, etc, that are easily editable and available for immediate download.
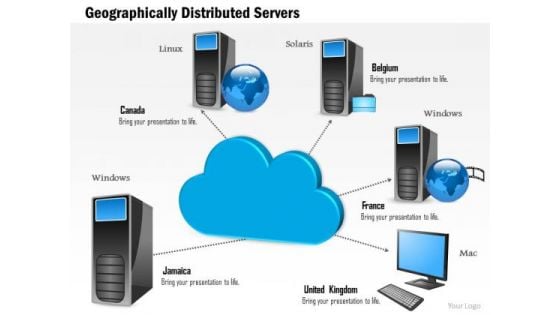
1 Geographically Distributed Servers Across Data Centers Connected To A Centralized Cloud Ppt Slides
This image slide displays geographically distributed server. This image slide has been designed with graphic of could, servers and globe. This image depicts cloud computing. You may change size, color and orientation of any icon to your liking. Use this PowerPoint template, in your presentations to explain concept of cloud computing both at local and global scale. This image slide will help you make professional presentations.

Developing Organization Primary Data Storage Action Plan Ppt PowerPoint Presentation Complete Deck With Slides
This complete deck acts as a great communication tool. It helps you in conveying your business message with personalized sets of graphics, icons etc. Comprising a set of fifty nine slides, this complete deck can help you persuade your audience. It also induces strategic thinking as it has been thoroughly researched and put together by our experts. Not only is it easily downloadable but also editable. The color, graphics, theme any component can be altered to fit your individual needs. So grab it now.
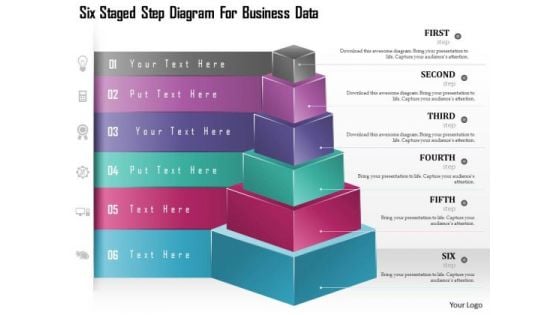
Business Diagram Six Staged Step Diagram For Business Data Presentation Template
Download this diagram to display business development strategies, business plans, decisions, and stages. This Business diagram contains graphics of six steps cubes with icons. Present your views using this innovative slide and be assured of leaving a lasting impression.
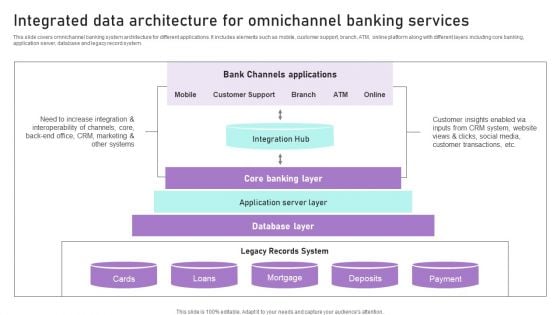
Integrated Data Architecture For Omnichannel Banking Services Ppt Icon Topics PDF
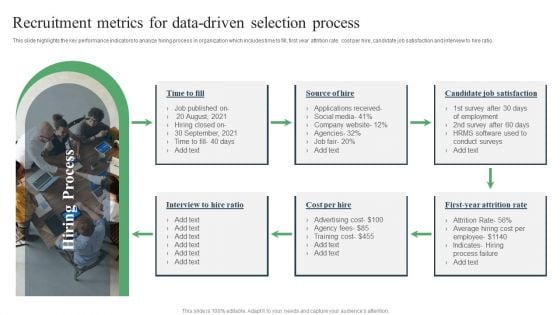
Recruitment Metrics For Data Driven Selection Process Ppt PowerPoint Presentation Inspiration Graphics Download PDF
This slide highlights the key performance indicators to analyze hiring process in organization which includes time to fill, first year attrition rate, cost per hire, candidate job satisfaction and interview to hire ratio. Persuade your audience using this Recruitment Metrics For Data-Driven Selection Process Ppt PowerPoint Presentation Inspiration Graphics Download PDF. This PPT design covers one stage, thus making it a great tool to use. It also caters to a variety of topics including Candidate Job, Satisfaction, Attrition Rate. Download this PPT design now to present a convincing pitch that not only emphasizes the topic but also showcases your presentation skills.

Implementation Of Data Governance Framework Ppt PowerPoint Presentation Complete Deck With Slides
This complete presentation has PPT slides on wide range of topics highlighting the core areas of your business needs. It has professionally designed templates with relevant visuals and subject driven content. This presentation deck has total of fourty four slides. Get access to the customizable templates. Our designers have created editable templates for your convenience. You can edit the colour, text and font size as per your need. You can add or delete the content if required. You are just a click to away to have this ready made presentation. Click the download button now.

Data Preparation Infrastructure And Phases Ppt PowerPoint Presentation Complete Deck With Slides
This complete presentation has PPT slides on wide range of topics highlighting the core areas of your business needs. It has professionally designed templates with relevant visuals and subject driven content. This presentation deck has total of fourty seven slides. Get access to the customizable templates. Our designers have created editable templates for your convenience. You can edit the colour, text and font size as per your need. You can add or delete the content if required. You are just a click to away to have this ready made presentation. Click the download button now.
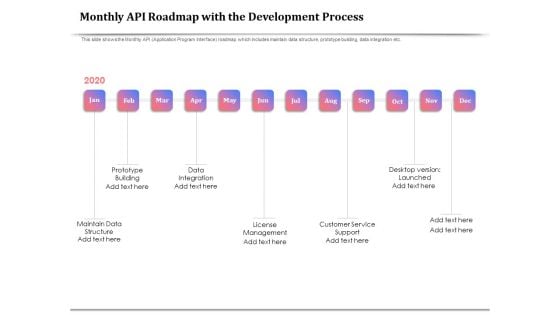
API Management For Building Software Applications Monthly API Roadmap With The Development Process Ideas PDF
Presenting this set of slides with name api management for building software applications monthly api roadmap with the development process ideas pdf. This is a twelve stage process. The stages in this process are data structure, prototype building, data integration, license management, customer service support, desktop version launched, 2020. This is a completely editable PowerPoint presentation and is available for immediate download. Download now and impress your audience.

Oscar Capital Raising Pitch Deck Data Retention For Future Use Diagrams PDF
This slide will be helpful in mapping out the customer journey. It also includes the details about the plans, personalized care and Teladoc profile. Deliver an awe inspiring pitch with this creative oscar capital raising pitch deck customer journey map oscar pitch deck diagrams pdf bundle. Topics like customer journey map oscar pitch deck can be discussed with this completely editable template. It is available for immediate download depending on the needs and requirements of the user.
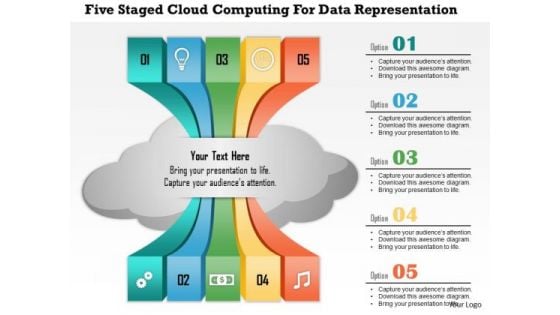
Business Diagram Five Staged Cloud Computing For Data Representation Presentation Template
Our above slide displays five steps with cloud icon. Download our above diagram to express information in a visual way. This diagram offers a way for your audience to visually conceptualize the process.
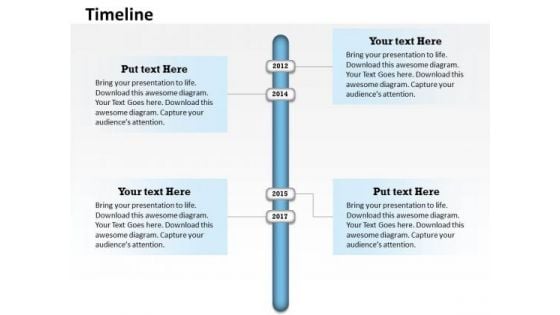
Business Finance Strategy Development Annual Data On Timeline Roadmap Diagram Marketing Diagram
Be The Doer With Our Business Diagram See Business Timeline Roadmap Diagram Strategy Diagram Powerpoint Templates. Put Your Thoughts Into Practice.
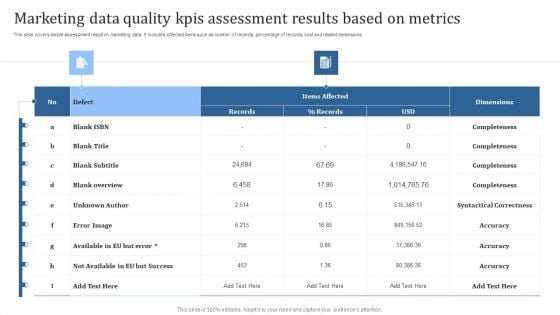
Marketing Data Quality Kpis Assessment Results Based On Metrics Summary PDF
This slide covers simple assessment result on marketing data. It includes affected items such as number of records, percentage of records, cost and related dimensions. Showcasing this set of slides titled Error Image, Unknown Author, Blank Overview. The topics addressed in these templates are Error Image, Unknown Author, Blank Overview. All the content presented in this PPT design is completely editable. Download it and make adjustments in color, background, font etc. as per your unique business setting.
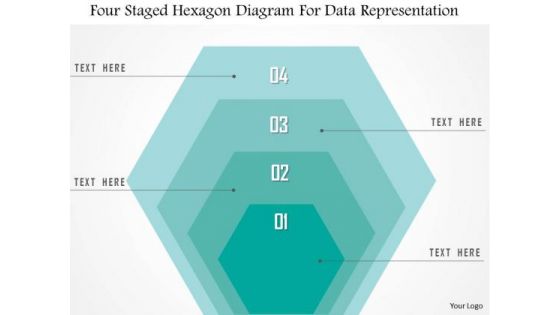
Business Diagram Four Staged Hexagon Diagram For Data Representation Presentation Template
This pre-designed and appealing process and workflow graphics for Microsoft PowerPoint offer an optimized possibility to illustrate your business strategy. Your audience will easily understand all key benefits. This Diagram is editable and can be easily adjusted.
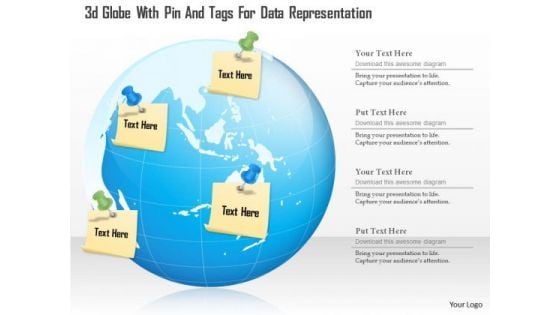
Business Diagram 3d Globe With Pin And Tags For Data Representation Presentation Template
This business diagram has been designed with graphic of 3d globe with pin and tags. This slide helps to depict concept of global communication. Download this diagram slide to make professional presentations.
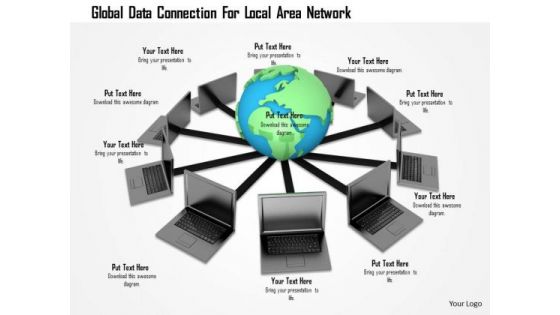
Stock Photo Global Data Connection For Local Area Network PowerPoint Slide
This Power point template has been designed with graphic of globe connected with laptops. This image slide contains the concept of global networking. Use this slide for your business network and communication related topics in any presentation.
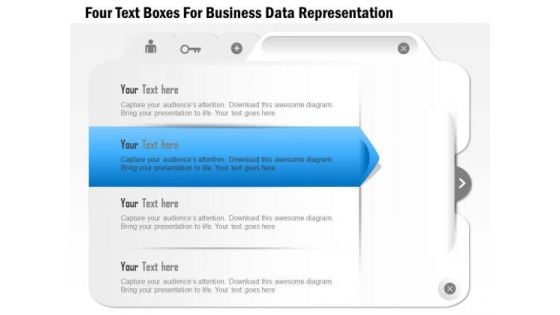
Business Diagram Four Text Boxes For Business Data Representation Presentation Template
This diagram can be used to display 4 staged business plan. Your thoughts need to be organized. This PowerPoint template contains graphics of four text boxes. Use this innovative diagram slide to build exclusive presentation.
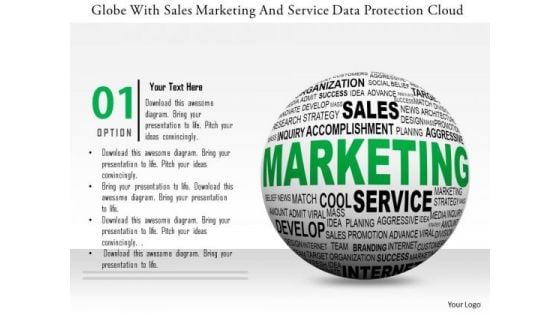
Stock Photo Globe With Sales Marketing And Service Data Protection Cloud PowerPoint Slide
This power point template has been designed with graphic of globe and cloud. This image template contains the concept of global sales and marketing service with cloud technology. Use this image template for global business related presentations.

Outline Of Data Preprocessing Strategies And Importance Ppt PowerPoint Presentation Complete With Slides
Induce strategic thinking by presenting this complete deck. Enthrall your audience by deploying this thought provoking PPT deck. It can be downloaded in both standard and widescreen aspect ratios, thus making it a complete package to use and deploy. Convey your thoughts and actions using the forty six slides presented in this complete deck. Additionally, feel free to alter its components like color, graphics, design, etc, to create a great first impression. Grab it now by clicking on the download button below.
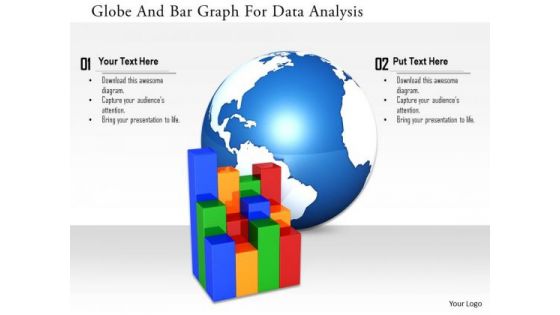
Stock Photo Globe And Bar Graph For Data Analysis Image Graphics For PowerPoint Slide
This image slide has been designed with business graph with globe in background. This image slide represents topics like global business, economic growth. This image will enhance the quality of your presentations.
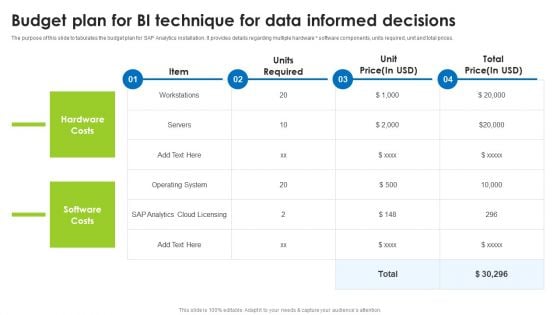
Budget Plan For BI Technique For Data Informed Decisions Clipart PDF
The purpose of this slide to tabulates the budget plan for SAP Analytics installation. It provides details regarding multiple hardware software components, units required, unit and total prices. Explore a selection of the finest Sap Analytics Cloud Dashboard For Income Analysis And Forecasting Formats PDF here. With a plethora of professionally designed and pre made slide templates, you can quickly and easily find the right one for your upcoming presentation. You can use our Sap Analytics Cloud Dashboard For Income Analysis And Forecasting Formats PDF to effectively convey your message to a wider audience. Slidegeeks has done a lot of research before preparing these presentation templates. The content can be personalized and the slides are highly editable. Grab templates today from Slidegeeks.
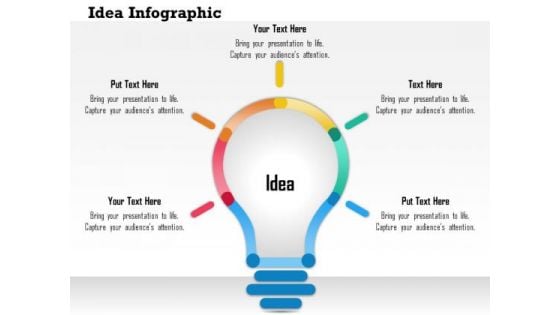
Business Diagram 3d Bulb With Text Boxes For Data Representation Presentation Template
This business diagram has been designed with 3d bulb with text boxes. This bulb graphic is displaying the concept of idea generation. Use this diagram to portray concepts like strategy, idea , success etc.

Administered Data And Analytic Quality Playbook Ppt PowerPoint Presentation Complete Deck With Slides
Induce strategic thinking by presenting this complete deck. Enthrall your audience by deploying this thought provoking PPT deck. It can be downloaded in both standard and widescreen aspect ratios, thus making it a complete package to use and deploy. Convey your thoughts and actions using the thrity eight slides presented in this complete deck. Additionally, feel free to alter its components like color, graphics, design, etc, to create a great first impression. Grab it now by clicking on the download button below.

Oracle Cloud Data Analytics Administration IT Ppt PowerPoint Presentation Complete Deck With Slides
Induce strategic thinking by presenting this complete deck. Enthrall your audience by deploying this thought provoking PPT deck. It can be downloaded in both standard and widescreen aspect ratios, thus making it a complete package to use and deploy. Convey your thoughts and actions using the sixty three slides presented in this complete deck. Additionally, feel free to alter its components like color, graphics, design, etc, to create a great first impression. Grab it now by clicking on the download button below.
Any Queries Illustration For Streaming Stock Data Ppt PowerPoint Presentation File Slides PDF
Presenting to dispense important information. This template comprises five stages. It also presents valuable insights into the topics including any queries illustration for streaming stock data. This is a completely customizable PowerPoint theme that can be put to use immediately. So, download it and address the topic impactfully.
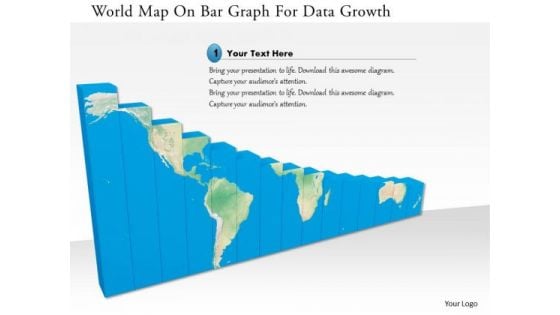
Stock Photo World Map On Bar Graph For Data Growth Image Graphics For PowerPoint Slide
This image is designed with blue graph with world map printed on it. This conceptual image portrays the concepts of global business and global economy. This image slide will help you express your views to target audience.
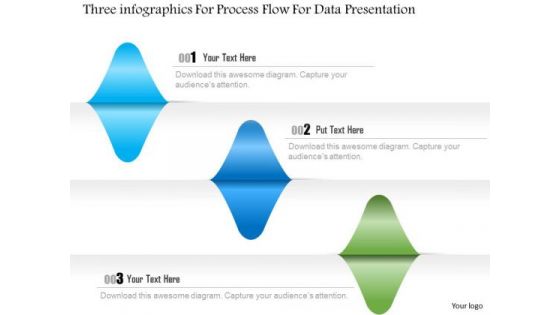
Busines Diagram Three Infographics For Process Flow For Data Presentation Template
Three info graphics has been used to design this business diagram. This slide helps to depict business process flow. This slide offers an excellent background to build professional presentations.

Business Diagram Four Progressive Text Boxes For Business Data Presentation Template
This diagram has been designed with four progressive steps with text boxes. You can insert this diagram into your presentations to clarify information. Highlight your ideas broad based on strong fundamentals and illustrate how they step by step achieve the set growth factor.
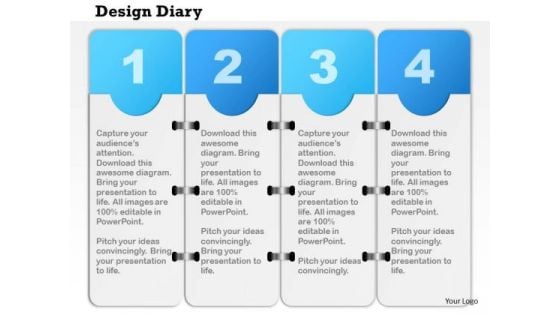
Business Diagram Four Staged Design Diary For Data Flow Presentation Template
Four staged info graphics has been used to design this PowerPoint template. This slide can be used for text representation. Present your views using this innovative slide and be assured of leaving a lasting impression.
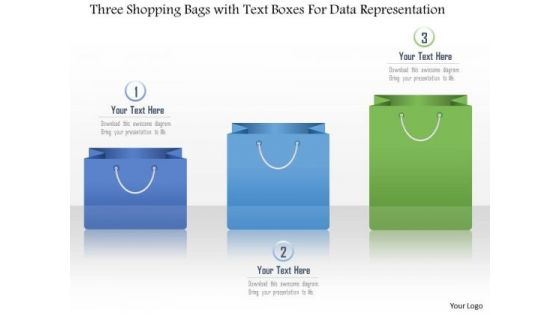
Business Diagram Three Shopping Bags With Text Boxes For Data Representation Presentation Template
This Power Point diagram has been crafted with graphic of three shopping bags. It contains diagram of colorful shopping bag graphics depicting progress steps. Use this diagram to build professional presentation for your viewers.

Busines Diagram Six Staged Vertical Process For Data Presentation Presentation Template
Six staged vertical process flow has been used to design this business diagram. This slide helps to depict business process flow. This slide offers an excellent background to build professional presentations.
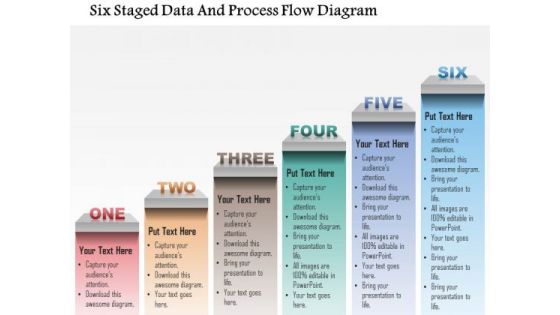
Busines Diagram Six Staged Data And Process Flow Diagram Presentation Template
Six staged diagram has been used to design this business slide. This diagram can be used to show the business processes or workflows. Deliver amazing presentations to mesmerize your audience.
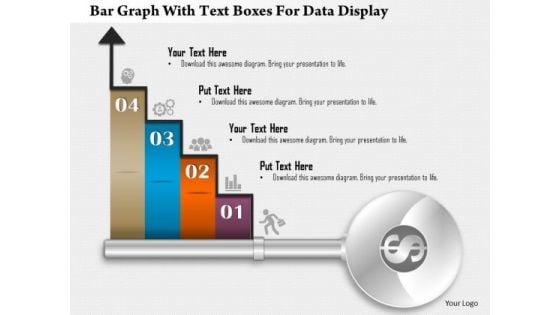
Business Diagram Bar Graph With Text Boxes For Data Display Presentation Template
Our above business diagram displays bar graph. It contains four steps on bar graph with icons. Use this diagram to display four stages of business growth. Download this Power Point slide to build quality presentation for your viewers.
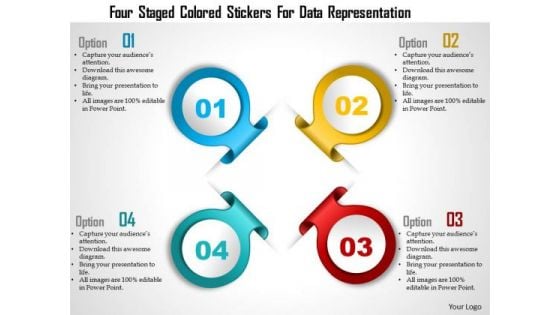
Business Diagram Four Staged Colored Stickers For Data Representation Presentation Template
Graphic of four staged colored stickers been used to design this business slide. This slide depicts four steps of a business process. Make your presentation more interactive with this business slide.
Data Interpretation And Analysis Playbook Ppt PowerPoint Presentation Complete Deck With Slides
This complete deck acts as a great communication tool. It helps you in conveying your business message with personalized sets of graphics, icons etc. Comprising a set of thirty nine slides, this complete deck can help you persuade your audience. It also induces strategic thinking as it has been thoroughly researched and put together by our experts. Not only is it easily downloadable but also editable. The color, graphics, theme any component can be altered to fit your individual needs. So grab it now.
Scale Up Plan For Data Inventory Model Ppt PowerPoint Presentation Complete Deck With Slides
Induce strategic thinking by presenting this complete deck. Enthrall your audience by deploying this thought provoking PPT deck. It can be downloaded in both standard and widescreen aspect ratios, thus making it a complete package to use and deploy. Convey your thoughts and actions using the fifty nine slides presented in this complete deck. Additionally, feel free to alter its components like color, graphics, design, etc, to create a great first impression. Grab it now by clicking on the download button below.

Business Diagram Toy Gun With Flags For Data Representation Presentation Template
This business slide depicts gun design with flags. This diagram provides an effective way of displaying information you can edit text, color, shade and style as per you need. Present your views using this innovative slide and be assured of leaving a lasting impression.

Data Assessment Project Plan Ppt PowerPoint Presentation Complete Deck With Slides
This complete presentation has PPT slides on wide range of topics highlighting the core areas of your business needs. It has professionally designed templates with relevant visuals and subject driven content. This presentation deck has total of sixteen slides. Get access to the customizable templates. Our designers have created editable templates for your convenience. You can edit the colour, text and font size as per your need. You can add or delete the content if required. You are just a click to away to have this ready made presentation. Click the download button now.
Business Diagram Infographics With Multiple Icons For Data Representation Presentation Template
This business diagram has been designed with graphic of multiple icons info graphics. Download this diagram to analyze the key points. This diagram offers a way for your audience to visually conceptualize the process.
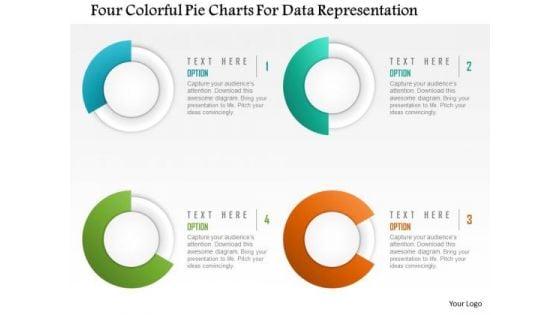
Business Diagram Four Colorful Pie Charts For Data Representation Presentation Template
This diagram is designed with four colorful pie charts. Download this diagram to analyze the key points. This diagram offers a way for your audience to visually conceptualize the process.

Busines Diagram Three Staged Text Boxes For Data Representation Presentation Template
Three staged text boxes are used to design this business diagram. This slide helps to depict business process flow. This slide offers an excellent background to build professional presentations.
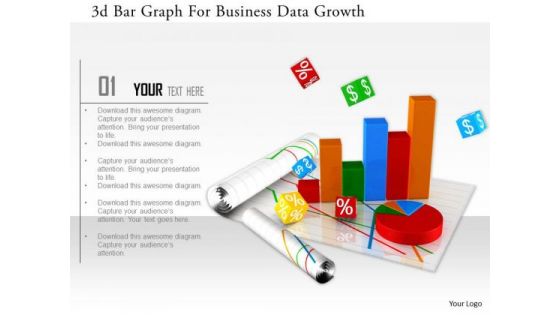
Stock Photo 3d Bar Graph For Business Data Growth Image Graphics For PowerPoint Slide
This image slide has graphics of financial charts and reports. This contains bar graph and pie chart to present business reports. Build an innovative presentations using this professional image slide.
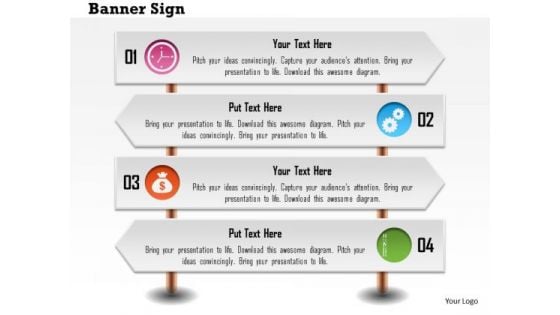
Business Diagram Four Banner Style Text Boxes For Data Representation Presentation Template
This business slide displays four banner style text boxes It contains graphic of text boxes with four steps. Use this diagram, in your presentations to express views on process, steps, stages, progress, targets, goals, success and achievements. Give professional appearance to your presentations using this business slide.
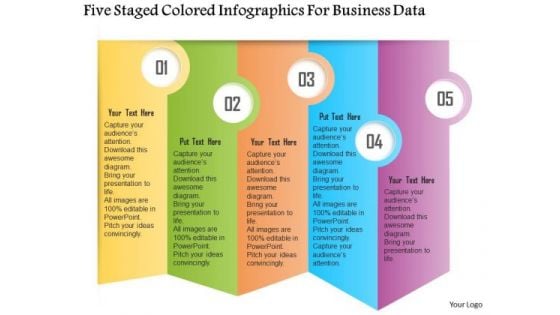
Business Diagram Five Staged Colored Infographics For Business Data Presentation Template
Five staged colored info graphics has been used to design this PowerPoint template. Download our above diagram to express information in a visual way. This diagram offers a way for your audience to visually conceptualize the process.
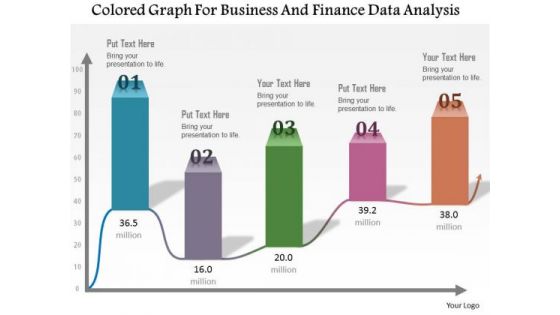
Business Diagram Colored Graph For Business And Finance Data Analysis Presentation Template
This Power Point template has been designed with graphic of colored bar graph. Use this slide to represent five steps of any business process. Use this diagram for your business presentations and get exclusive comments on your efforts.
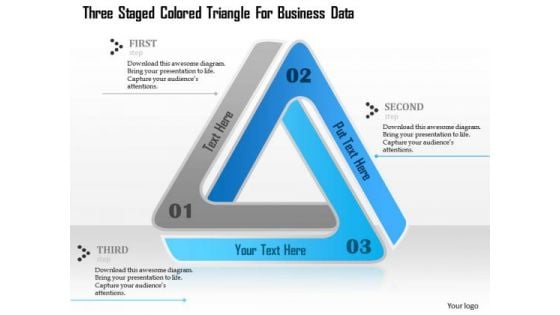
Business Diagram Three Staged Colored Triangle For Business Data Presentation Template
Three staged blue colored triangle has been used to design this business diagram. This slide contains triangle diagram to depict process flow. Use this PPT slide for your business and marketing presentations

Business Diagram Smiley With Check Box And Pencil For Data Representation Presentation Template
This business diagram has been designed with smiley with check box and pencil. Download this diagram to analyze the key points. This diagram offers a way for your audience to visually conceptualize the process.
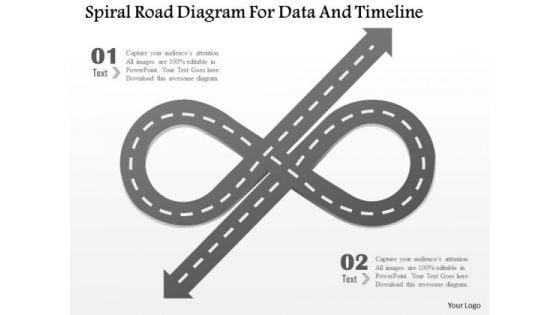
Business Diagram Spiral Road Diagram For Data And Timeline Presentation Template
this power point template slide has been designed with graphic of spiral road diagram. This diagram can be used for timeline and business process flow related topics. Use this PPT slide in your business and marketing related presentations.


 Continue with Email

 Home
Home


