org chart
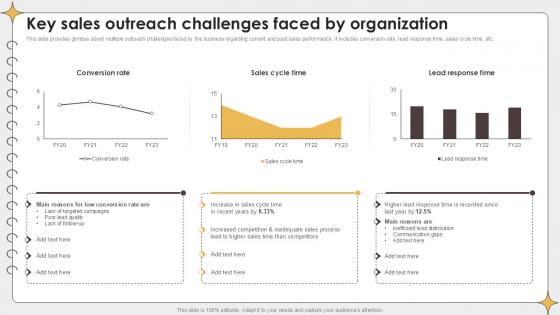
Key Sales Outreach Challenges Planning Outreach Campaigns PPT Example
This slide provides glimpse about multiple outreach challenges faced by the business regarding current and past sales performance. It includes conversion rate, lead response time, sales cycle time, etc. Take your projects to the next level with our ultimate collection of Key Sales Outreach Challenges Planning Outreach Campaigns PPT Example. Slidegeeks has designed a range of layouts that are perfect for representing task or activity duration, keeping track of all your deadlines at a glance. Tailor these designs to your exact needs and give them a truly corporate look with your own brand colors they will make your projects stand out from the rest This slide provides glimpse about multiple outreach challenges faced by the business regarding current and past sales performance. It includes conversion rate, lead response time, sales cycle time, etc.
Confidential Computing Performance Tracking Dashboard Secure Multi Party Portrait Pdf
This slide represents the performance tracking dashboard for confidential computing. The purpose of this slide is to represent the overall performance of the confidential computing cloud environment visually. The main components include overall health, operations, progress, time, cost and workloads. Coming up with a presentation necessitates that the majority of the effort goes into the content and the message you intend to convey. The visuals of a PowerPoint presentation can only be effective if it supplements and supports the story that is being told. Keeping this in mind our experts created Confidential Computing Performance Tracking Dashboard Secure Multi Party Portrait Pdf to reduce the time that goes into designing the presentation. This way, you can concentrate on the message while our designers take care of providing you with the right template for the situation. This slide represents the performance tracking dashboard for confidential computing. The purpose of this slide is to represent the overall performance of the confidential computing cloud environment visually. The main components include overall health, operations, progress, time, cost and workloads.
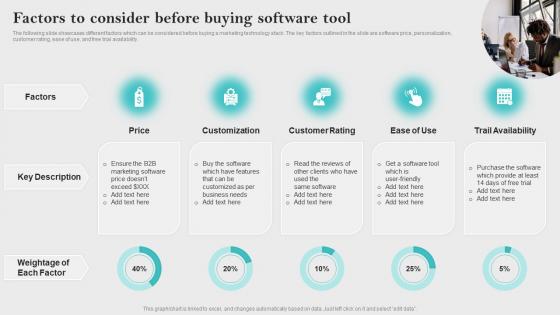
Factors To Consider Before Innovative Business Promotion Ideas Demonstration Pdf
The following slide showcases different factors which can be considered before buying a marketing technology stack. The key factors outlined in the slide are software price, personalization, customer rating, ease of use, and free trial availability. Coming up with a presentation necessitates that the majority of the effort goes into the content and the message you intend to convey. The visuals of a PowerPoint presentation can only be effective if it supplements and supports the story that is being told. Keeping this in mind our experts created Factors To Consider Before Innovative Business Promotion Ideas Demonstration Pdf to reduce the time that goes into designing the presentation. This way, you can concentrate on the message while our designers take care of providing you with the right template for the situation. The following slide showcases different factors which can be considered before buying a marketing technology stack. The key factors outlined in the slide are software price, personalization, customer rating, ease of use, and free trial availability.
Monthly Sales Performance Tracking Sales Performance Enhancement Background Pdf
This slide showcases a dashboard presenting various metrics to measure and analyze sales performance for revenue growth. It includes key components such as number of sales, revenue, profit, cost, sales revenue, sales increment, cost analysis and cross sell. Coming up with a presentation necessitates that the majority of the effort goes into the content and the message you intend to convey. The visuals of a PowerPoint presentation can only be effective if it supplements and supports the story that is being told. Keeping this in mind our experts created Monthly Sales Performance Tracking Sales Performance Enhancement Background Pdf to reduce the time that goes into designing the presentation. This way, you can concentrate on the message while our designers take care of providing you with the right template for the situation. This slide showcases a dashboard presenting various metrics to measure and analyze sales performance for revenue growth. It includes key components such as number of sales, revenue, profit, cost, sales revenue, sales increment, cost analysis and cross sell.
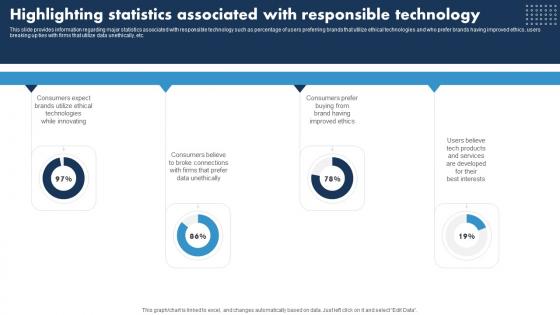
Highlighting Statistics Associated Esponsible Tech Guide To Manage Infographics Pdf
This slide provides information regarding major statistics associated with responsible technology such as percentage of users preferring brands that utilize ethical technologies and who prefer brands having improved ethics, users breaking up ties with firms that utilize data unethically, etc. Coming up with a presentation necessitates that the majority of the effort goes into the content and the message you intend to convey. The visuals of a PowerPoint presentation can only be effective if it supplements and supports the story that is being told. Keeping this in mind our experts created Highlighting Statistics Associated Esponsible Tech Guide To Manage Infographics Pdf to reduce the time that goes into designing the presentation. This way, you can concentrate on the message while our designers take care of providing you with the right template for the situation. This slide provides information regarding major statistics associated with responsible technology such as percentage of users preferring brands that utilize ethical technologies and who prefer brands having improved ethics, users breaking up ties with firms that utilize data unethically, etc.
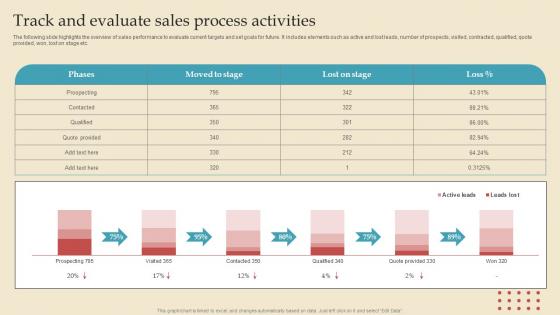
Track And Evaluate Sales Describing Business Performance Administration Goals Information Pdf
The following slide highlights the overview of sales performance to evaluate current targets and set goals for future. It includes elements such as active and lost leads, number of prospects, visited, contracted, qualified, quote provided, won, lost on stage etc. Coming up with a presentation necessitates that the majority of the effort goes into the content and the message you intend to convey. The visuals of a PowerPoint presentation can only be effective if it supplements and supports the story that is being told. Keeping this in mind our experts created Track And Evaluate Sales Describing Business Performance Administration Goals Information Pdf to reduce the time that goes into designing the presentation. This way, you can concentrate on the message while our designers take care of providing you with the right template for the situation. The following slide highlights the overview of sales performance to evaluate current targets and set goals for future. It includes elements such as active and lost leads, number of prospects, visited, contracted, qualified, quote provided, won, lost on stage etc.
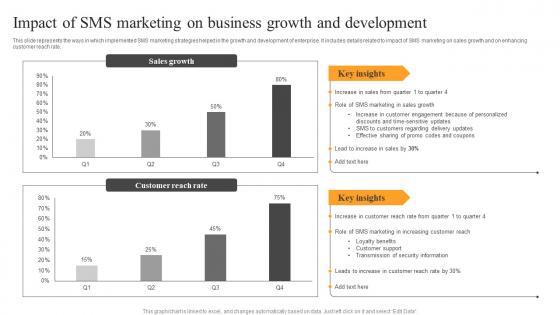
Impact Of SMS Marketing Business Text Message Advertising Solutions Enhancing Introduction Pdf
This slide represents the ways in which implemented SMS marketing strategies helped in the growth and development of enterprise. It includes details related to impact of SMS marketing on sales growth and on enhancing customer reach rate. Coming up with a presentation necessitates that the majority of the effort goes into the content and the message you intend to convey. The visuals of a PowerPoint presentation can only be effective if it supplements and supports the story that is being told. Keeping this in mind our experts created Impact Of SMS Marketing Business Text Message Advertising Solutions Enhancing Introduction Pdf to reduce the time that goes into designing the presentation. This way, you can concentrate on the message while our designers take care of providing you with the right template for the situation. This slide represents the ways in which implemented SMS marketing strategies helped in the growth and development of enterprise. It includes details related to impact of SMS marketing on sales growth and on enhancing customer reach rate.
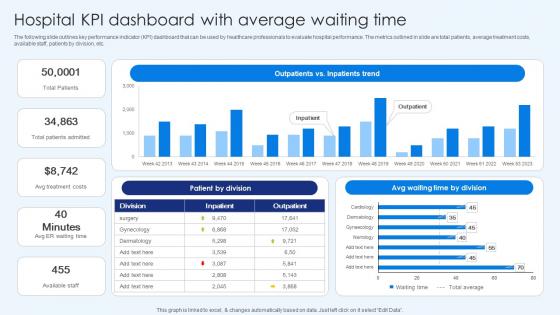
Hospital Kpi Dashboard With Average Waiting Time Healthcare Promotion Ideas Pdf
The following slide outlines key performance indicator KPI dashboard that can be used by healthcare professionals to evaluate hospital performance. The metrics outlined in slide are total patients, average treatment costs, available staff, patients by division, etc. Coming up with a presentation necessitates that the majority of the effort goes into the content and the message you intend to convey. The visuals of a PowerPoint presentation can only be effective if it supplements and supports the story that is being told. Keeping this in mind our experts created Hospital KPI Dashboard With Average Waiting Time Healthcare Promotion Ideas Pdf to reduce the time that goes into designing the presentation. This way, you can concentrate on the message while our designers take care of providing you with the right template for the situation. The following slide outlines key performance indicator KPI dashboard that can be used by healthcare professionals to evaluate hospital performance. The metrics outlined in slide are total patients, average treatment costs, available staff, patients by division, etc.
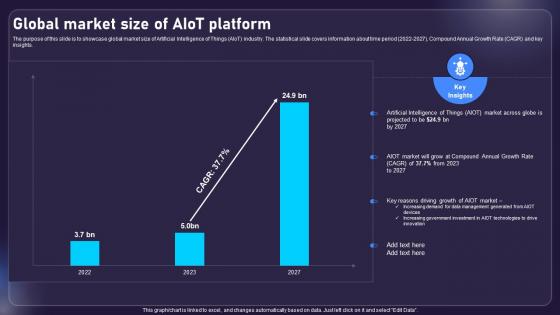
Global Market Size Of AIOT Platform AIOT Applications For Various Industries IoT SS V
The purpose of this slide is to showcase global market size of Artificial Intelligence of Things AIoT industry. The statistical slide covers information about time period 2022-2027, Compound Annual Growth Rate CAGR and key insights. Coming up with a presentation necessitates that the majority of the effort goes into the content and the message you intend to convey. The visuals of a PowerPoint presentation can only be effective if it supplements and supports the story that is being told. Keeping this in mind our experts created Global Market Size Of AIOT Platform AIOT Applications For Various Industries IoT SS V to reduce the time that goes into designing the presentation. This way, you can concentrate on the message while our designers take care of providing you with the right template for the situation. The purpose of this slide is to showcase global market size of Artificial Intelligence of Things AIoT industry. The statistical slide covers information about time period 2022-2027, Compound Annual Growth Rate CAGR and key insights.
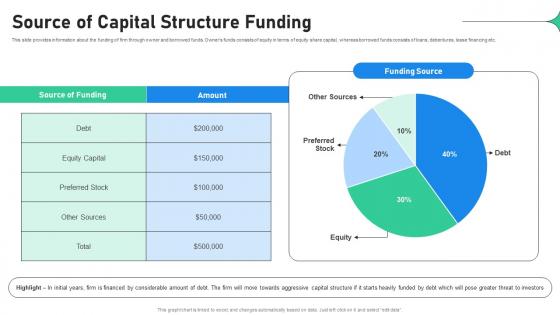
Source Of Capital Structure Funding Increasing Profitability Through Better Product
This slide provides information about the funding of firm through owner and borrowed funds. Owners funds consists of equity in terms of equity share capital, whereas borrowed funds consists of loans, debentures, lease financing etc. Coming up with a presentation necessitates that the majority of the effort goes into the content and the message you intend to convey. The visuals of a PowerPoint presentation can only be effective if it supplements and supports the story that is being told. Keeping this in mind our experts created Source Of Capital Structure Funding Increasing Profitability Through Better Product to reduce the time that goes into designing the presentation. This way, you can concentrate on the message while our designers take care of providing you with the right template for the situation. This slide provides information about the funding of firm through owner and borrowed funds. Owners funds consists of equity in terms of equity share capital, whereas borrowed funds consists of loans, debentures, lease financing etc.

Targeted Industries Of Cyber Phishing Man In The Middle Phishing IT
This slide represents the statistics of most targeted industries of phishing scams. The purpose of this slide is to outline the various sectors which are more prone to phishing attacks. These industries are retail, manufacturing, food and beverage, tech, etc. Coming up with a presentation necessitates that the majority of the effort goes into the content and the message you intend to convey. The visuals of a PowerPoint presentation can only be effective if it supplements and supports the story that is being told. Keeping this in mind our experts created Targeted Industries Of Cyber Phishing Man In The Middle Phishing IT to reduce the time that goes into designing the presentation. This way, you can concentrate on the message while our designers take care of providing you with the right template for the situation. This slide represents the statistics of most targeted industries of phishing scams. The purpose of this slide is to outline the various sectors which are more prone to phishing attacks. These industries are retail, manufacturing, food and beverage, tech, etc.

North America Beauty And Personal Care Industry Makeup And Skincare Market IR SS V
This slide presents the North American market size of beauty and personal care products. It highlights key market players, major product segment, import value of beauty and personal care products, millennials and gen Z beauty and personal care products preferences. Coming up with a presentation necessitates that the majority of the effort goes into the content and the message you intend to convey. The visuals of a PowerPoint presentation can only be effective if it supplements and supports the story that is being told. Keeping this in mind our experts created North America Beauty And Personal Care Industry Makeup And Skincare Market IR SS V to reduce the time that goes into designing the presentation. This way, you can concentrate on the message while our designers take care of providing you with the right template for the situation. This slide presents the North American market size of beauty and personal care products. It highlights key market players, major product segment, import value of beauty and personal care products, millennials and gen Z beauty and personal care products preferences.
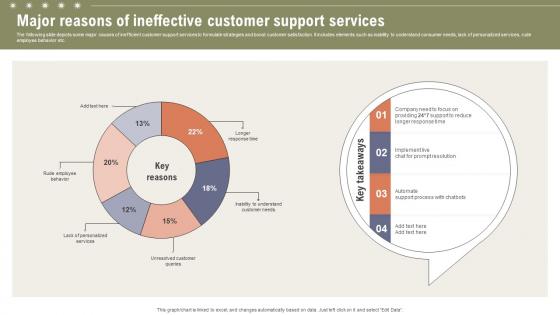
Major Reasons Of Ineffective Customer Support Boosting Customer Retention Rate With Live Chat
The following slide depicts some major causes of inefficient customer support services to formulate strategies and boost customer satisfaction. It includes elements such as inability to understand consumer needs, lack of personalized services, rude employee behavior etc. Coming up with a presentation necessitates that the majority of the effort goes into the content and the message you intend to convey. The visuals of a PowerPoint presentation can only be effective if it supplements and supports the story that is being told. Keeping this in mind our experts created Major Reasons Of Ineffective Customer Support Boosting Customer Retention Rate With Live Chat to reduce the time that goes into designing the presentation. This way, you can concentrate on the message while our designers take care of providing you with the right template for the situation. The following slide depicts some major causes of inefficient customer support services to formulate strategies and boost customer satisfaction. It includes elements such as inability to understand consumer needs, lack of personalized services, rude employee behavior etc.
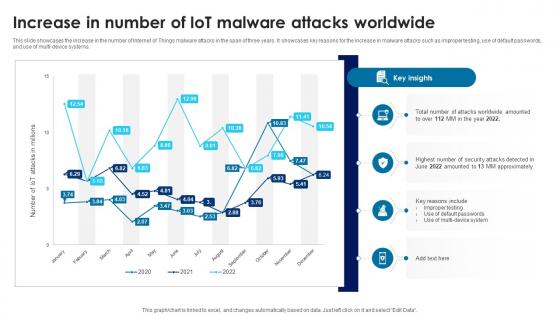
Building Trust With IoT Security Increase In Number Of IoT Malware Attacks Worldwide IoT SS V
This slide showcases the increase in the number of Internet of Things malware attacks in the span of three years. It showcases key reasons for the increase in malware attacks such as improper testing, use of default passwords, and use of multi-device systems. Coming up with a presentation necessitates that the majority of the effort goes into the content and the message you intend to convey. The visuals of a PowerPoint presentation can only be effective if it supplements and supports the story that is being told. Keeping this in mind our experts created Building Trust With IoT Security Increase In Number Of IoT Malware Attacks Worldwide IoT SS V to reduce the time that goes into designing the presentation. This way, you can concentrate on the message while our designers take care of providing you with the right template for the situation. This slide showcases the increase in the number of Internet of Things malware attacks in the span of three years. It showcases key reasons for the increase in malware attacks such as improper testing, use of default passwords, and use of multi-device systems.
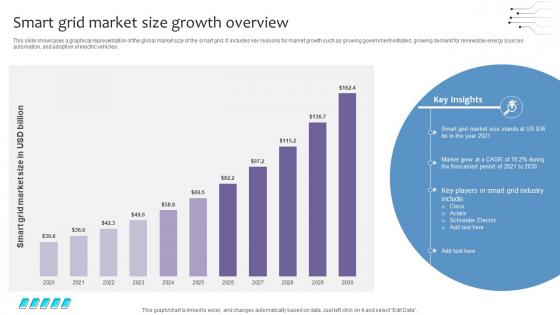
Empowering The Future Smart Grid Market Size Growth Overview IoT SS V
This slide showcases a graphical representation of the global market size of the smart grid. It Includes key reasons for market growth such as growing government-initiated, growing demand for renewable energy sources automation, and adoption of electric vehicles. Coming up with a presentation necessitates that the majority of the effort goes into the content and the message you intend to convey. The visuals of a PowerPoint presentation can only be effective if it supplements and supports the story that is being told. Keeping this in mind our experts created Empowering The Future Smart Grid Market Size Growth Overview IoT SS V to reduce the time that goes into designing the presentation. This way, you can concentrate on the message while our designers take care of providing you with the right template for the situation. This slide showcases a graphical representation of the global market size of the smart grid. It Includes key reasons for market growth such as growing government-initiated, growing demand for renewable energy sources automation, and adoption of electric vehicles.
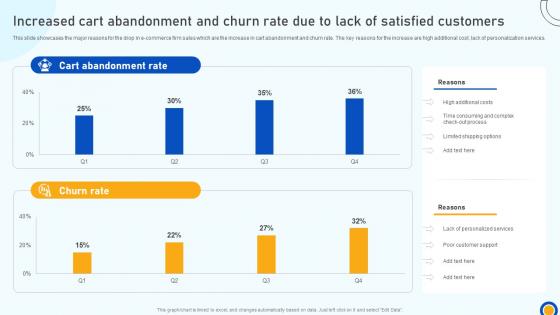
Digital Marketing Strategies Increased Cart Abandonment And Churn Rate Due To Lack SA SS V
This slide showcases the major reasons for the drop in e-commerce firm sales which are the increase in cart abandonment and churn rate. The key reasons for the increase are high additional cost, lack of personalization services. Coming up with a presentation necessitates that the majority of the effort goes into the content and the message you intend to convey. The visuals of a PowerPoint presentation can only be effective if it supplements and supports the story that is being told. Keeping this in mind our experts created Digital Marketing Strategies Increased Cart Abandonment And Churn Rate Due To Lack SA SS V to reduce the time that goes into designing the presentation. This way, you can concentrate on the message while our designers take care of providing you with the right template for the situation. This slide showcases the major reasons for the drop in e-commerce firm sales which are the increase in cart abandonment and churn rate. The key reasons for the increase are high additional cost, lack of personalization services.
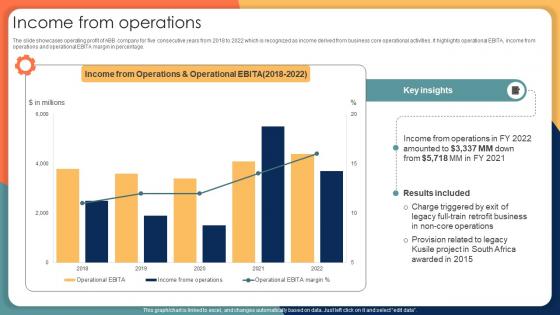
Income From Operations Engineering Solution Provider Company Profile CP SS V
The slide showcases operating profit of ABB company for five consecutive years from 2018 to 2022 which is recognized as income derived from business core operational activities. It highlights operational EBITA, income from operations and operational EBITA margin in percentage. Coming up with a presentation necessitates that the majority of the effort goes into the content and the message you intend to convey. The visuals of a PowerPoint presentation can only be effective if it supplements and supports the story that is being told. Keeping this in mind our experts created Income From Operations Engineering Solution Provider Company Profile CP SS V to reduce the time that goes into designing the presentation. This way, you can concentrate on the message while our designers take care of providing you with the right template for the situation. The slide showcases operating profit of ABB company for five consecutive years from 2018 to 2022 which is recognized as income derived from business core operational activities. It highlights operational EBITA, income from operations and operational EBITA margin in percentage.
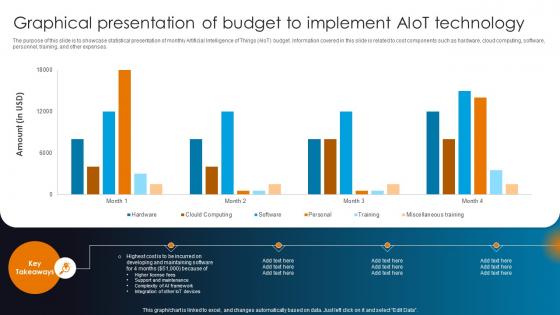
Integrating AI With IoT Graphical Presentation Of Budget To Implement AIoT Technology IoT SS V
The purpose of this slide is to showcase statistical presentation of monthly Artificial Intelligence of Things AIoT budget. Information covered in this slide is related to cost components such as hardware, cloud computing, software, personnel, training, and other expenses. Coming up with a presentation necessitates that the majority of the effort goes into the content and the message you intend to convey. The visuals of a PowerPoint presentation can only be effective if it supplements and supports the story that is being told. Keeping this in mind our experts created Integrating AI With IoT Graphical Presentation Of Budget To Implement AIoT Technology IoT SS V to reduce the time that goes into designing the presentation. This way, you can concentrate on the message while our designers take care of providing you with the right template for the situation. The purpose of this slide is to showcase statistical presentation of monthly Artificial Intelligence of Things AIoT budget. Information covered in this slide is related to cost components such as hardware, cloud computing, software, personnel, training, and other expenses.
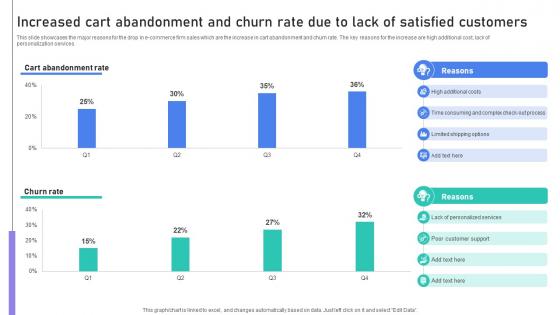
Building Stronger Customer Increased Cart Abandonment And Churn Rate Due To Lack SA SS V
This slide showcases the major reasons for the drop in e-commerce firm sales which are the increase in cart abandonment and churn rate. The key reasons for the increase are high additional cost, lack of personalization services. Coming up with a presentation necessitates that the majority of the effort goes into the content and the message you intend to convey. The visuals of a PowerPoint presentation can only be effective if it supplements and supports the story that is being told. Keeping this in mind our experts created Building Stronger Customer Increased Cart Abandonment And Churn Rate Due To Lack SA SS V to reduce the time that goes into designing the presentation. This way, you can concentrate on the message while our designers take care of providing you with the right template for the situation. This slide showcases the major reasons for the drop in e-commerce firm sales which are the increase in cart abandonment and churn rate. The key reasons for the increase are high additional cost, lack of personalization services.

Major Reasons Of Ineffective Improving Customer Retention PPT Slide
The following slide depicts some major causes of inefficient customer support services to formulate strategies and boost customer satisfaction. It includes elements such as inability to understand consumer needs, lack of personalized services, rude employee behavior etc. Coming up with a presentation necessitates that the majority of the effort goes into the content and the message you intend to convey. The visuals of a PowerPoint presentation can only be effective if it supplements and supports the story that is being told. Keeping this in mind our experts created Major Reasons Of Ineffective Improving Customer Retention PPT Slide to reduce the time that goes into designing the presentation. This way, you can concentrate on the message while our designers take care of providing you with the right template for the situation. The following slide depicts some major causes of inefficient customer support services to formulate strategies and boost customer satisfaction. It includes elements such as inability to understand consumer needs, lack of personalized services, rude employee behavior etc.
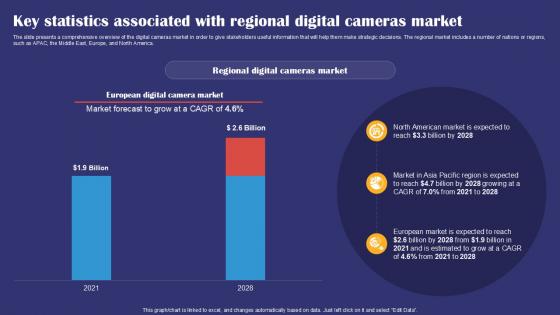
Key Statistics Associated With Regional Digital Cameras Smartphones Industry Report PPT Example IR SS V
The slide presents a comprehensive overview of the digital cameras market in order to give stakeholders useful information that will help them make strategic decisions. The regional market includes a number of nations or regions, such as APAC, the Middle East, Europe, and North America. Coming up with a presentation necessitates that the majority of the effort goes into the content and the message you intend to convey. The visuals of a PowerPoint presentation can only be effective if it supplements and supports the story that is being told. Keeping this in mind our experts created Key Statistics Associated With Regional Digital Cameras Smartphones Industry Report PPT Example IR SS V to reduce the time that goes into designing the presentation. This way, you can concentrate on the message while our designers take care of providing you with the right template for the situation. The slide presents a comprehensive overview of the digital cameras market in order to give stakeholders useful information that will help them make strategic decisions. The regional market includes a number of nations or regions, such as APAC, the Middle East, Europe, and North America.
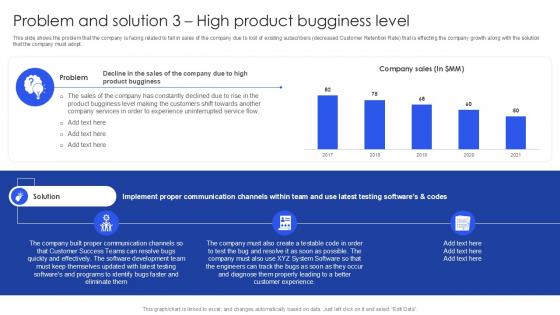
Problem And Solution 3 High Product Bugginess Level PPT Example SS
This slide shows the problem that the company is facing related to fall in sales of the company due to lost of existing subscribers decreased Customer Retention Rate that is effecting the company growth along with the solution that the company must adopt. Coming up with a presentation necessitates that the majority of the effort goes into the content and the message you intend to convey. The visuals of a PowerPoint presentation can only be effective if it supplements and supports the story that is being told. Keeping this in mind our experts created Problem And Solution 3 High Product Bugginess Level PPT Example SS to reduce the time that goes into designing the presentation. This way, you can concentrate on the message while our designers take care of providing you with the right template for the situation. This slide shows the problem that the company is facing related to fall in sales of the company due to lost of existing subscribers decreased Customer Retention Rate that is effecting the company growth along with the solution that the company must adopt.

Major Reasons Of Ineffective Enhancing Customer Experience Ppt Sample
The following slide depicts some major causes of inefficient customer support services to formulate strategies and boost customer satisfaction. It includes elements such as inability to understand consumer needs, lack of personalized services, rude employee behavior etc. Coming up with a presentation necessitates that the majority of the effort goes into the content and the message you intend to convey. The visuals of a PowerPoint presentation can only be effective if it supplements and supports the story that is being told. Keeping this in mind our experts created Major Reasons Of Ineffective Enhancing Customer Experience Ppt Sample to reduce the time that goes into designing the presentation. This way, you can concentrate on the message while our designers take care of providing you with the right template for the situation. The following slide depicts some major causes of inefficient customer support services to formulate strategies and boost customer satisfaction. It includes elements such as inability to understand consumer needs, lack of personalized services, rude employee behavior etc.

Dashboard To Evaluate Top Performing Comprehensive Guide To Wholesale Ppt Presentation
This slide showcases dashboard which helps track sales representatives performance by assessing cold calling KPIs. it provides information regarding KPIs such as conversion rates, no. of items sold. No. of deals converted, value generated etc. Coming up with a presentation necessitates that the majority of the effort goes into the content and the message you intend to convey. The visuals of a PowerPoint presentation can only be effective if it supplements and supports the story that is being told. Keeping this in mind our experts created Dashboard To Evaluate Top Performing Comprehensive Guide To Wholesale Ppt Presentation to reduce the time that goes into designing the presentation. This way, you can concentrate on the message while our designers take care of providing you with the right template for the situation. This slide showcases dashboard which helps track sales representatives performance by assessing cold calling KPIs. it provides information regarding KPIs such as conversion rates, no. of items sold. No. of deals converted, value generated etc.
Project Management Dashboard For Tracking Performance Closing A Project By Fulfilling PM SS V
This slide showcases dashboard for tracing project performance. This template focuses on changing the status of each task and graphs automatically tracking overall status. It covers aspects related to task priority, budget, etc. Find a pre-designed and impeccable Project Management Dashboard For Tracking Performance Closing A Project By Fulfilling PM SS V. The templates can ace your presentation without additional effort. You can download these easy-to-edit presentation templates to make your presentation stand out from others. So, what are you waiting for Download the template from Slidegeeks today and give a unique touch to your presentation. This slide showcases dashboard for tracing project performance. This template focuses on changing the status of each task and graphs automatically tracking overall status. It covers aspects related to task priority, budget, etc.
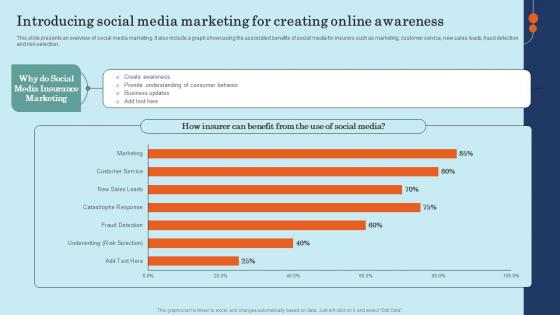
Introducing Social Media Marketing For Creating Online Effective General Insurance Marketing Ideas Pdf
This slide presents an overview of social media marketing. It also include a graph showcasing the associated benefits of social media for insurers such as marketing, customer service, new sales leads, fraud detection and risk selection.Find a pre-designed and impeccable Introducing Social Media Marketing For Creating Online Effective General Insurance Marketing Ideas Pdf. The templates can ace your presentation without additional effort. You can download these easy-to-edit presentation templates to make your presentation stand out from others. So, what are you waiting for Download the template from Slidegeeks today and give a unique touch to your presentation. This slide presents an overview of social media marketing. It also include a graph showcasing the associated benefits of social media for insurers such as marketing, customer service, new sales leads, fraud detection and risk selection.
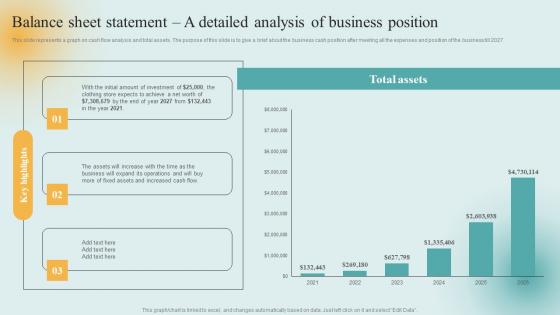
Insurance Firm Start Up Financial Balance Sheet Statement A Detailed Analysis Of Business Demonstration Pdf
This slide represents a graph on cash flow analysis and total assets. The purpose of this slide is to give a brief about the business cash position after meeting all the expenses and position of the business till 2027. Find a pre-designed and impeccable Insurance Firm Start Up Financial Balance Sheet Statement A Detailed Analysis Of Business Demonstration Pdf. The templates can ace your presentation without additional effort. You can download these easy-to-edit presentation templates to make your presentation stand out from others. So, what are you waiting for Download the template from Slidegeeks today and give a unique touch to your presentation. This slide represents a graph on cash flow analysis and total assets. The purpose of this slide is to give a brief about the business cash position after meeting all the expenses and position of the business till 2027.
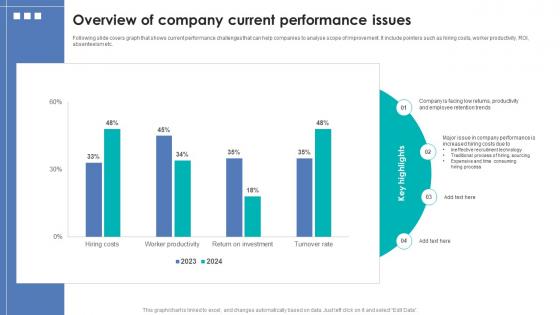
Integrating Automation For Effective Business Overview Of Company Current Performance Issues
Following slide covers graph that shows current performance challenges that can help companies to analyse scope of improvement. It include pointers such as hiring costs, worker productivity, ROI, absenteeism etc. Explore a selection of the finest Integrating Automation For Effective Business Overview Of Company Current Performance Issues here. With a plethora of professionally designed and pre-made slide templates, you can quickly and easily find the right one for your upcoming presentation. You can use our Integrating Automation For Effective Business Overview Of Company Current Performance Issues to effectively convey your message to a wider audience. Slidegeeks has done a lot of research before preparing these presentation templates. The content can be personalized and the slides are highly editable. Grab templates today from Slidegeeks. Following slide covers graph that shows current performance challenges that can help companies to analyse scope of improvement. It include pointers such as hiring costs, worker productivity, ROI, absenteeism etc.
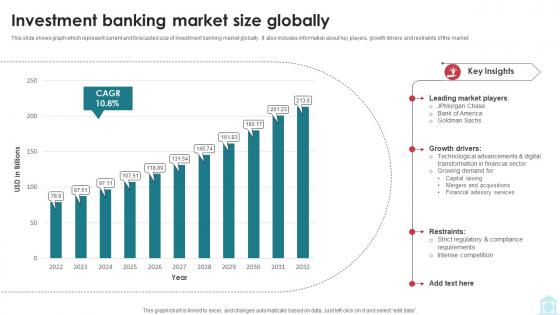
Investment Banking Market Size Globally Mastering Investment Banking Fin SS V
This slide shows graph which represent current and forecasted size of investment banking market globally . It also includes information about key players, growth drivers and restraints of the market. Explore a selection of the finest Investment Banking Market Size Globally Mastering Investment Banking Fin SS V here. With a plethora of professionally designed and pre-made slide templates, you can quickly and easily find the right one for your upcoming presentation. You can use our Investment Banking Market Size Globally Mastering Investment Banking Fin SS V to effectively convey your message to a wider audience. Slidegeeks has done a lot of research before preparing these presentation templates. The content can be personalized and the slides are highly editable. Grab templates today from Slidegeeks. This slide shows graph which represent current and forecasted size of investment banking market globally . It also includes information about key players, growth drivers and restraints of the market.

Investment Banking Market Size Globally Investment Banking Simplified Functions Fin SS V
This slide shows graph which represent current and forecasted size of investment banking market globally . It also includes information about key players, growth drivers and restraints of the market. Explore a selection of the finest Investment Banking Market Size Globally Investment Banking Simplified Functions Fin SS V here. With a plethora of professionally designed and pre-made slide templates, you can quickly and easily find the right one for your upcoming presentation. You can use our Investment Banking Market Size Globally Investment Banking Simplified Functions Fin SS V to effectively convey your message to a wider audience. Slidegeeks has done a lot of research before preparing these presentation templates. The content can be personalized and the slides are highly editable. Grab templates today from Slidegeeks. This slide shows graph which represent current and forecasted size of investment banking market globally . It also includes information about key players, growth drivers and restraints of the market.
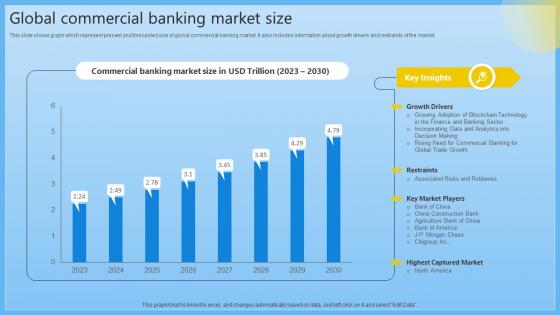
Global Commercial Banking Market Size Complete Guide On Managing Banking Fin SS V
This slide shows graph which represent present and forecasted size of global commercial banking market. It also includes information about growth drivers and restraints of the market. Explore a selection of the finest Global Commercial Banking Market Size Complete Guide On Managing Banking Fin SS V here. With a plethora of professionally designed and pre-made slide templates, you can quickly and easily find the right one for your upcoming presentation. You can use our Global Commercial Banking Market Size Complete Guide On Managing Banking Fin SS V to effectively convey your message to a wider audience. Slidegeeks has done a lot of research before preparing these presentation templates. The content can be personalized and the slides are highly editable. Grab templates today from Slidegeeks. This slide shows graph which represent present and forecasted size of global commercial banking market. It also includes information about growth drivers and restraints of the market.
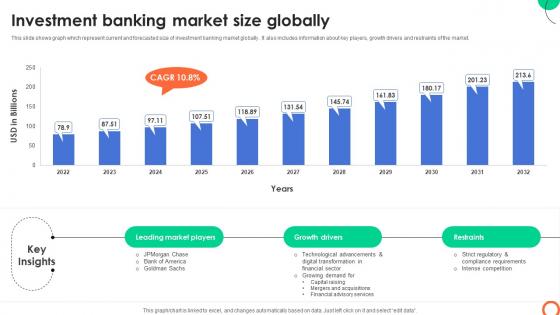
Investment Banking Market Size Globally Understanding Investment Banking Framework Fin SS V
This slide shows graph which represent current and forecasted size of investment banking market globally . It also includes information about key players, growth drivers and restraints of the market. Explore a selection of the finest Investment Banking Market Size Globally Understanding Investment Banking Framework Fin SS V here. With a plethora of professionally designed and pre-made slide templates, you can quickly and easily find the right one for your upcoming presentation. You can use our Investment Banking Market Size Globally Understanding Investment Banking Framework Fin SS V to effectively convey your message to a wider audience. Slidegeeks has done a lot of research before preparing these presentation templates. The content can be personalized and the slides are highly editable. Grab templates today from Slidegeeks. This slide shows graph which represent current and forecasted size of investment banking market globally . It also includes information about key players, growth drivers and restraints of the market.
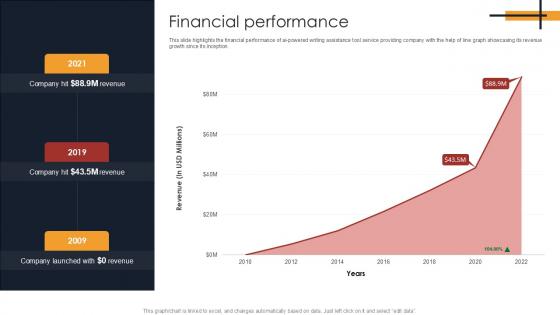
Financial Performance Writing Enhancement Software Pitch Deck PPT Example
This slide highlights the financial performance of ai powered writing assistance tool service providing company with the help of line graph showcasing its revenue growth since its inception. Find a pre designed and impeccable Financial Performance Writing Enhancement Software Pitch Deck PPT Example. The templates can ace your presentation without additional effort. You can download these easy to edit presentation templates to make your presentation stand out from others. So, what are you waiting for Download the template from Slidegeeks today and give a unique touch to your presentation. This slide highlights the financial performance of ai powered writing assistance tool service providing company with the help of line graph showcasing its revenue growth since its inception.
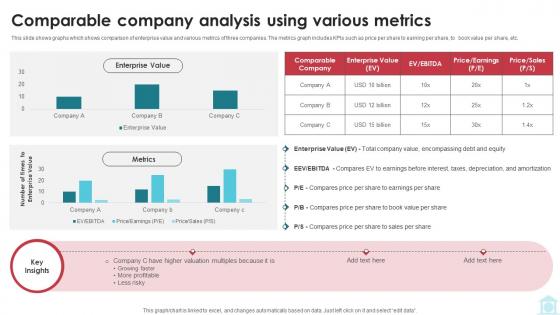
Comparable Company Analysis Using Various Metrics Mastering Investment Banking Fin SS V
This slide shows graphs which shows comparison of enterprise value and various metrics of three companies. The metrics graph includes KPIs such as price per share to earning per share, to book value per share, etc. Get a simple yet stunning designed Comparable Company Analysis Using Various Metrics Mastering Investment Banking Fin SS V It is the best one to establish the tone in your meetings. It is an excellent way to make your presentations highly effective. So, download this PPT today from Slidegeeks and see the positive impacts. Our easy-to-edit Comparable Company Analysis Using Various Metrics Mastering Investment Banking Fin SS V can be your go-to option for all upcoming conferences and meetings. So, what are you waiting for Grab this template today. This slide shows graphs which shows comparison of enterprise value and various metrics of three companies. The metrics graph includes KPIs such as price per share to earning per share, to book value per share, etc.
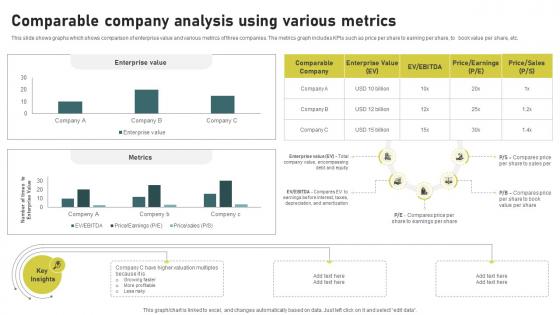
Comparable Company Analysis Using Investment Banking Simplified Functions Fin SS V
This slide shows graphs which shows comparison of enterprise value and various metrics of three companies. The metrics graph includes KPIs such as price per share to earning per share, to book value per share, etc. Get a simple yet stunning designed Comparable Company Analysis Using Investment Banking Simplified Functions Fin SS V. It is the best one to establish the tone in your meetings. It is an excellent way to make your presentations highly effective. So, download this PPT today from Slidegeeks and see the positive impacts. Our easy-to-edit Comparable Company Analysis Using Investment Banking Simplified Functions Fin SS V can be your go-to option for all upcoming conferences and meetings. So, what are you waiting for Grab this template today. This slide shows graphs which shows comparison of enterprise value and various metrics of three companies. The metrics graph includes KPIs such as price per share to earning per share, to book value per share, etc.
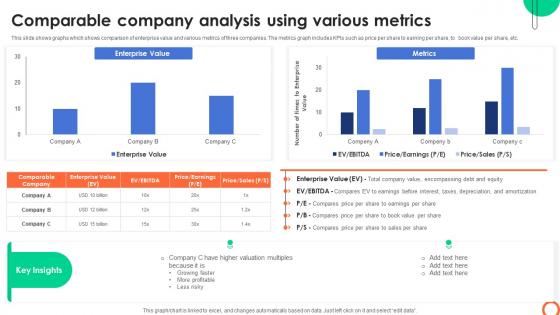
Comparable Company Analysis Using Various Understanding Investment Banking Framework Fin SS V
This slide shows graphs which shows comparison of enterprise value and various metrics of three companies. The metrics graph includes KPIs such as price per share to earning per share, to book value per share, etc. Get a simple yet stunning designed Comparable Company Analysis Using Various Understanding Investment Banking Framework Fin SS V. It is the best one to establish the tone in your meetings. It is an excellent way to make your presentations highly effective. So, download this PPT today from Slidegeeks and see the positive impacts. Our easy-to-edit Comparable Company Analysis Using Various Understanding Investment Banking Framework Fin SS V can be your go-to option for all upcoming conferences and meetings. So, what are you waiting for Grab this template today. This slide shows graphs which shows comparison of enterprise value and various metrics of three companies. The metrics graph includes KPIs such as price per share to earning per share, to book value per share, etc.
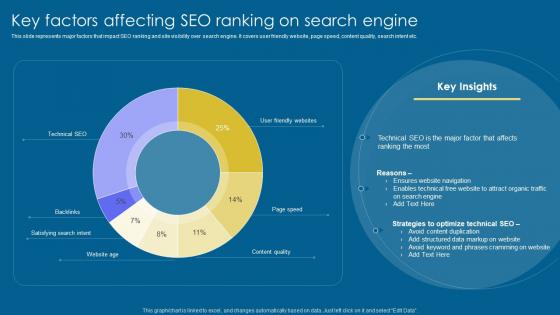
Key Factors Affecting SEO Implementation Of Digital Advertising Strategies Diagrams Pdf
This slide represents major factors that impact SEO ranking and site visibility over search engine. It covers user friendly website, page speed, content quality, search intent etc. Take your projects to the next level with our ultimate collection of Key Factors Affecting SEO Implementation Of Digital Advertising Strategies Diagrams Pdf. Slidegeeks has designed a range of layouts that are perfect for representing task or activity duration, keeping track of all your deadlines at a glance. Tailor these designs to your exact needs and give them a truly corporate look with your own brand colors they will make your projects stand out from the rest This slide represents major factors that impact SEO ranking and site visibility over search engine. It covers user friendly website, page speed, content quality, search intent etc.
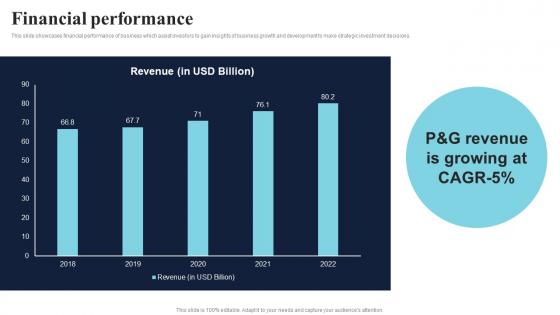
Financial Performance Healthcare Product Company Fund Raising Pitch Deck Diagrams Pdf
This slide showcases financial performance of business which assist investors to gain insights of business growth and development to make strategic investment decisions. Take your projects to the next level with our ultimate collection of Financial Performance Healthcare Product Company Fund Raising Pitch Deck Diagrams Pdf. Slidegeeks has designed a range of layouts that are perfect for representing task or activity duration, keeping track of all your deadlines at a glance. Tailor these designs to your exact needs and give them a truly corporate look with your own brand colors they will make your projects stand out from the rest This slide showcases financial performance of business which assist investors to gain insights of business growth and development to make strategic investment decisions.
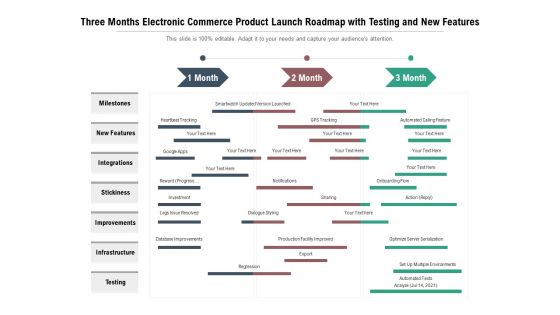
Three Months Electronic Commerce Product Launch Roadmap With Testing And New Features Diagrams
Presenting our innovatively-structured three months electronic commerce product launch roadmap with testing and new features diagrams Template. Showcase your roadmap process in different formats like PDF, PNG, and JPG by clicking the download button below. This PPT design is available in both Standard Screen and Widescreen aspect ratios. It can also be easily personalized and presented with modified font size, font type, color, and shapes to measure your progress in a clear way.
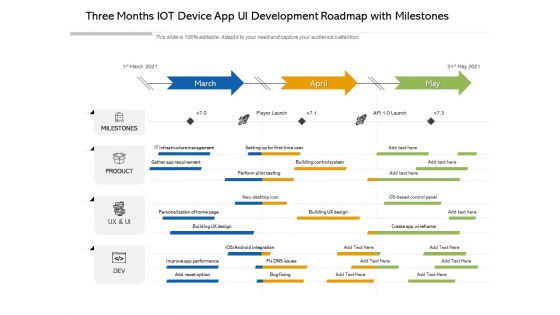
Three Months IOT Device App UI Development Roadmap With Milestones Diagrams
Presenting our innovatively structured three months iot device app ui development roadmap with milestones diagrams Template. Showcase your roadmap process in different formats like PDF, PNG, and JPG by clicking the download button below. This PPT design is available in both Standard Screen and Widescreen aspect ratios. It can also be easily personalized and presented with modified font size, font type, color, and shapes to measure your progress in a clear way.
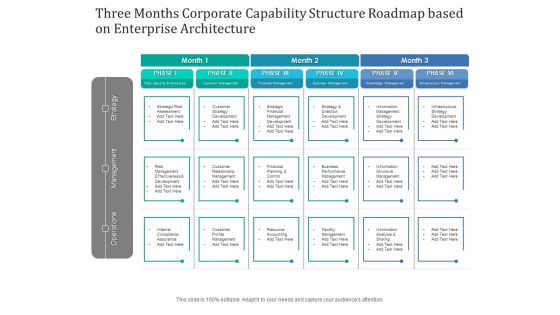
Three Months Corporate Capability Structure Roadmap Based On Enterprise Architecture Diagrams
Presenting our innovatively structured three months corporate capability structure roadmap based on enterprise architecture diagrams Template. Showcase your roadmap process in different formats like PDF, PNG, and JPG by clicking the download button below. This PPT design is available in both Standard Screen and Widescreen aspect ratios. It can also be easily personalized and presented with modified font size, font type, color, and shapes to measure your progress in a clear way.
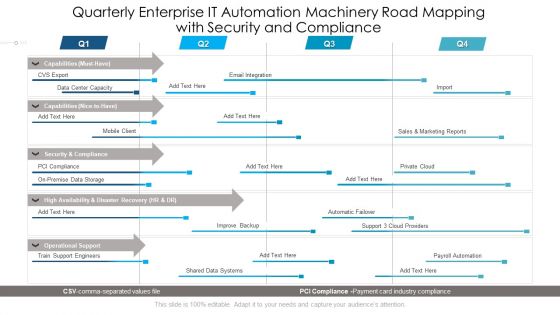
Quarterly Enterprise IT Automation Machinery Road Mapping With Security And Compliance Diagrams
Presenting our innovatively structured quarterly enterprise it automation machinery road mapping with security and compliance diagrams Template. Showcase your roadmap process in different formats like PDF, PNG, and JPG by clicking the download button below. This PPT design is available in both Standard Screen and Widescreen aspect ratios. It can also be easily personalized and presented with modified font size, font type, color, and shapes to measure your progress in a clear way.
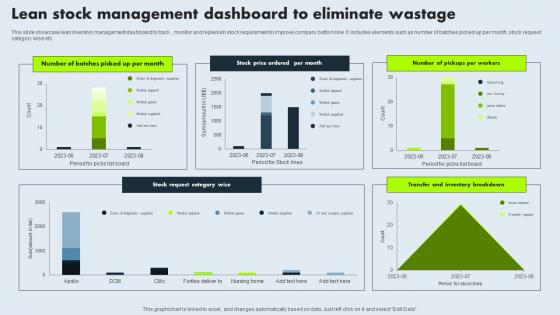
Lean Stock Management Dashboard To Eliminate Wastage Mockup Pdf
This slide showcase lean inventory management dashboard to track , monitor and replenish stock requirement to improve company bottom line. It includes elements such as number of batches picked up per month, stock request category wise etc. Pitch your topic with ease and precision using this Lean Stock Management Dashboard To Eliminate Wastage Mockup Pdf. This layout presents information on Lean Stock, Management Dashboard, Eliminate Wastage, Stock Request Category. It is also available for immediate download and adjustment. So, changes can be made in the color, design, graphics or any other component to create a unique layout. This slide showcase lean inventory management dashboard to track , monitor and replenish stock requirement to improve company bottom line. It includes elements such as number of batches picked up per month, stock request category wise etc.
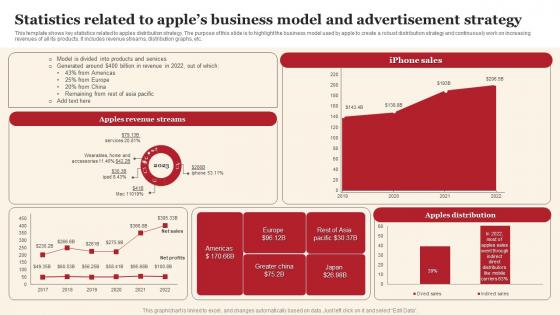
Statistics Related To Apples Business Model And Advertisement Strategy Introduction Pdf
This template shows key statistics related to apples distribution strategy. The purpose of this slide is to highlight the business model used by apple to create a robust distribution strategy and continuously work on increasing revenues of all its products. It includes revenue streams, distribution graphs, etc. Pitch your topic with ease and precision using this Statistics Related To Apples Business Model And Advertisement Strategy Introduction Pdf This layout presents information on Apples Revenue Streams, Iphone Sales, Apples Distribution It is also available for immediate download and adjustment. So, changes can be made in the color, design, graphics or any other component to create a unique layout. This template shows key statistics related to apples distribution strategy. The purpose of this slide is to highlight the business model used by apple to create a robust distribution strategy and continuously work on increasing revenues of all its products. It includes revenue streams, distribution graphs, etc.
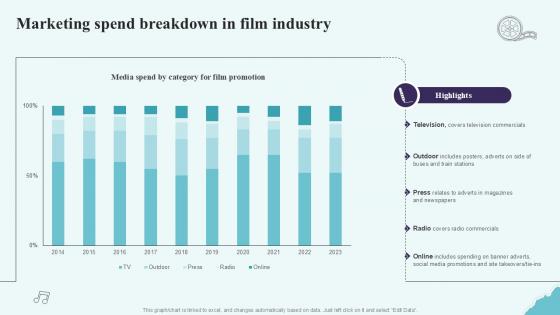
Marketing Spend Breakdown In Film Industry Strategic Plan To Increase Film Ppt Presentation Strategy SS V
This Marketing Spend Breakdown In Film Industry Strategic Plan To Increase Film Ppt Presentation Strategy SS V from Slidegeeks makes it easy to present information on your topic with precision. It provides customization options, so you can make changes to the colors, design, graphics, or any other component to create a unique layout. It is also available for immediate download, so you can begin using it right away. Slidegeeks has done good research to ensure that you have everything you need to make your presentation stand out. Make a name out there for a brilliant performance. Our Marketing Spend Breakdown In Film Industry Strategic Plan To Increase Film Ppt Presentation Strategy SS V are topically designed to provide an attractive backdrop to any subject. Use them to look like a presentation pro.
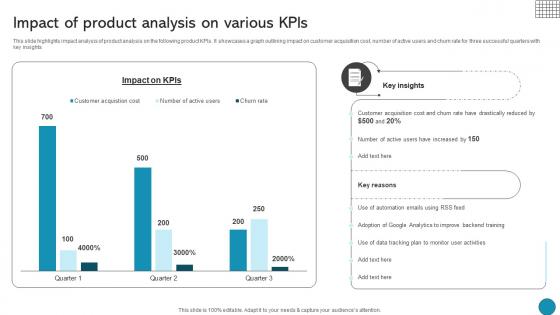
Impact Of Product Analysis On Various Kpis Driving Business Success Integrating Product
This slide highlights impact analysis of product analysis on the following product KPIs. It showcases a graph outlining impact on customer acquisition cost, number of active users and churn rate for three successful quarters with key insights Retrieve professionally designed Impact Of Product Analysis On Various Kpis Driving Business Success Integrating Product to effectively convey your message and captivate your listeners. Save time by selecting pre-made slideshows that are appropriate for various topics, from business to educational purposes. These themes come in many different styles, from creative to corporate, and all of them are easily adjustable and can be edited quickly. Access them as PowerPoint templates or as Google Slides themes. You do not have to go on a hunt for the perfect presentation because Slidegeeks got you covered from everywhere. This slide highlights impact analysis of product analysis on the following product KPIs. It showcases a graph outlining impact on customer acquisition cost, number of active users and churn rate for three successful quarters with key insights
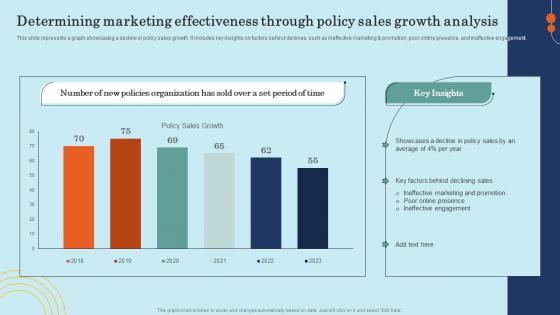
Determining Marketing Effectiveness Through Policy Effective General Insurance Marketing Background Pdf
This slide represents a graph showcasing a decline in policy sales growth. It includes key insights on factors behind declines, such as ineffective marketing And promotion, poor online presence, and ineffective engagement.Get a simple yet stunning designed Determining Marketing Effectiveness Through Policy Effective General Insurance Marketing Background Pdf. It is the best one to establish the tone in your meetings. It is an excellent way to make your presentations highly effective. So, download this PPT today from Slidegeeks and see the positive impacts. Our easy-to-edit Determining Marketing Effectiveness Through Policy Effective General Insurance Marketing Background Pdf can be your go-to option for all upcoming conferences and meetings. So, what are you waiting for Grab this template today. This slide represents a graph showcasing a decline in policy sales growth. It includes key insights on factors behind declines, such as ineffective marketing And promotion, poor online presence, and ineffective engagement.
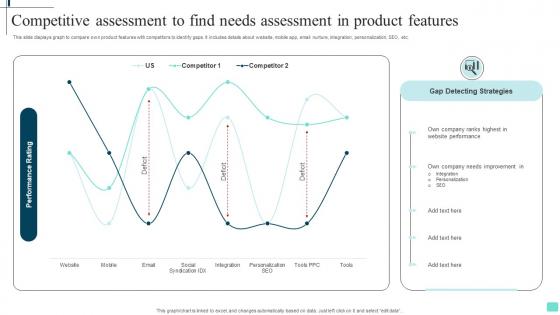
Competitive Assessment To Find Needs Assessment In Product Features Guidelines Pdf
This slide displays graph to compare own product features with competitors to identify gaps. It includes details about website, mobile app, email nurture, integration, personalization, SEO, etc. Showcasing this set of slides titled Competitive Assessment To Find Needs Assessment In Product Features Guidelines Pdf. The topics addressed in these templates are Competitive Assessment, Competitors To Identify Gaps, Mobile App, Email Nurture. All the content presented in this PPT design is completely editable. Download it and make adjustments in color, background, font etc. as per your unique business setting. This slide displays graph to compare own product features with competitors to identify gaps. It includes details about website, mobile app, email nurture, integration, personalization, SEO, etc.

Financial Projections Work Management Tool Pitch Deck
This slide presents the financial projection of the company with the help of line graphs. It showcases projected increase in company revenue and growth of EBITDA.Slidegeeks is here to make your presentations a breeze with Financial Projections Work Management Tool Pitch Deck With our easy-to-use and customizable templates, you can focus on delivering your ideas rather than worrying about formatting. With a variety of designs to choose from, you are sure to find one that suits your needs. And with animations and unique photos, illustrations, and fonts, you can make your presentation pop. So whether you are giving a sales pitch or presenting to the board, make sure to check out Slidegeeks first This slide presents the financial projection of the company with the help of line graphs. It showcases projected increase in company revenue and growth of EBITDA.
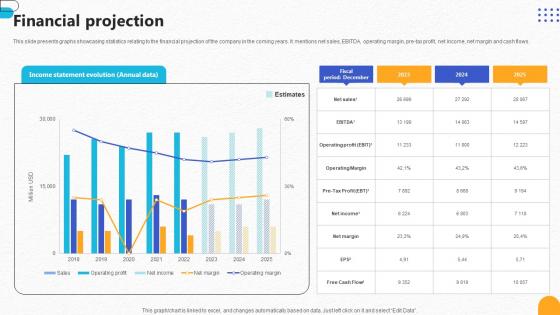
Financial Projection Pharmaceutical R And D Company Pitch Deck
This slide presents graphs showcasing statistics relating to the financial projection of the company in the coming years. It mentions net sales, EBITDA, operating margin, pre-tax profit, net income, net margin and cash flows. Slidegeeks is here to make your presentations a breeze with Financial Projection Pharmaceutical R And D Company Pitch Deck With our easy-to-use and customizable templates, you can focus on delivering your ideas rather than worrying about formatting. With a variety of designs to choose from, you are sure to find one that suits your needs. And with animations and unique photos, illustrations, and fonts, you can make your presentation pop. So whether you are giving a sales pitch or presenting to the board, make sure to check out Slidegeeks first This slide presents graphs showcasing statistics relating to the financial projection of the company in the coming years. It mentions net sales, EBITDA, operating margin, pre-tax profit, net income, net margin and cash flows.
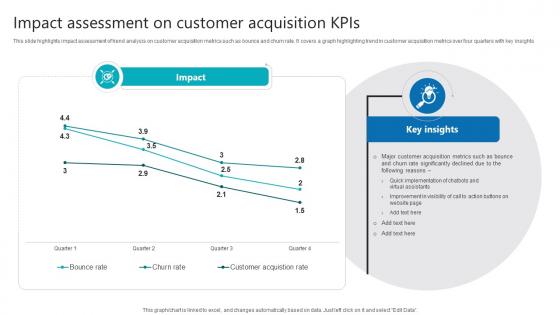
Impact Assessment On Customer Acquisition Kpis Product Analytics Implementation Data Analytics V
This slide highlights impact assessment of trend analysis on customer acquisition metrics such as bounce and churn rate. It covers a graph highlighting trend in customer acquisition metrics over four quarters with key insights The Impact Assessment On Customer Acquisition Kpis Product Analytics Implementation Data Analytics V is a compilation of the most recent design trends as a series of slides. It is suitable for any subject or industry presentation, containing attractive visuals and photo spots for businesses to clearly express their messages. This template contains a variety of slides for the user to input data, such as structures to contrast two elements, bullet points, and slides for written information. Slidegeeks is prepared to create an impression. This slide highlights impact assessment of trend analysis on customer acquisition metrics such as bounce and churn rate. It covers a graph highlighting trend in customer acquisition metrics over four quarters with key insights
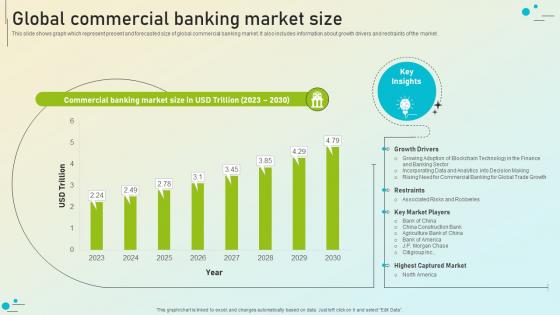
Beginners Guide To Commercial Global Commercial Banking Market Size Fin SS V
This slide shows graph which represent present and forecasted size of global commercial banking market. It also includes information about growth drivers and restraints of the market. The Beginners Guide To Commercial Global Commercial Banking Market Size Fin SS V is a compilation of the most recent design trends as a series of slides. It is suitable for any subject or industry presentation, containing attractive visuals and photo spots for businesses to clearly express their messages. This template contains a variety of slides for the user to input data, such as structures to contrast two elements, bullet points, and slides for written information. Slidegeeks is prepared to create an impression. This slide shows graph which represent present and forecasted size of global commercial banking market. It also includes information about growth drivers and restraints of the market.
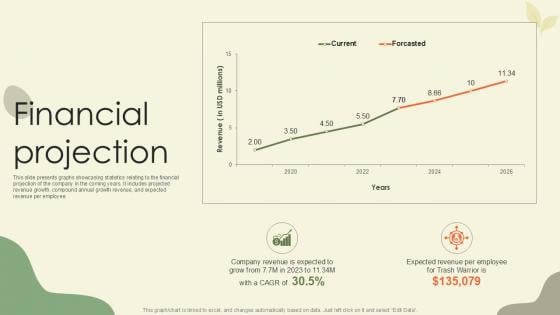
Financial Projection Waste Disposal Platform Pitch Deck Ppt Sample
This slide presents graphs showcasing statistics relating to the financial projection of the company in the coming years. It includes projected revenue growth, compound annual growth revenue, and expected revenue per employee. Slidegeeks is here to make your presentations a breeze with Financial Projection Waste Disposal Platform Pitch Deck Ppt Sample With our easy-to-use and customizable templates, you can focus on delivering your ideas rather than worrying about formatting. With a variety of designs to choose from, you are sure to find one that suits your needs. And with animations and unique photos, illustrations, and fonts, you can make your presentation pop. So whether you are giving a sales pitch or presenting to the board, make sure to check out Slidegeeks first This slide presents graphs showcasing statistics relating to the financial projection of the company in the coming years. It includes projected revenue growth, compound annual growth revenue, and expected revenue per employee.
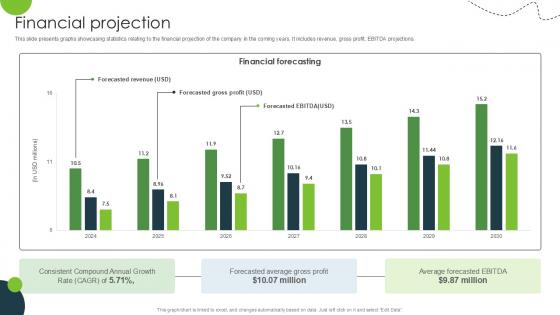
Financial Projection Land And Property Marketplace Pitch Deck PPT Example
This slide presents graphs showcasing statistics relating to the financial projection of the company in the coming years. It includes revenue, gross profit, EBITDA projections. Slidegeeks is here to make your presentations a breeze with Financial Projection Land And Property Marketplace Pitch Deck PPT Example With our easy-to-use and customizable templates, you can focus on delivering your ideas rather than worrying about formatting. With a variety of designs to choose from, you are sure to find one that suits your needs. And with animations and unique photos, illustrations, and fonts, you can make your presentation pop. So whether you are giving a sales pitch or presenting to the board, make sure to check out Slidegeeks first This slide presents graphs showcasing statistics relating to the financial projection of the company in the coming years. It includes revenue, gross profit, EBITDA projections.
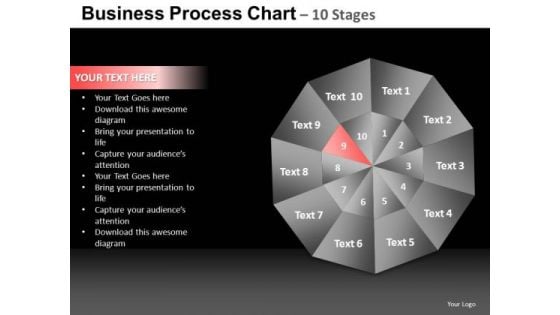
PowerPoint Designs Download Quadrant Diagram Ppt Theme
PowerPoint Designs Download Quadrant Diagram PPT Theme-These high quality powerpoint pre-designed slides and powerpoint templates have been carefully created by our professional team to help you impress your audience. All slides have been created and are 100% editable in powerpoint. Each and every property of any graphic - color, size, orientation, shading, outline etc. can be modified to help you build an effective powerpoint presentation. Any text can be entered at any point in the powerpoint template or slide. Simply DOWNLOAD, TYPE and PRESENT! Expose the facts and figures with our PowerPoint Designs Download Quadrant Diagram Ppt Theme. Remove the fig leaf with your thoughts.
Facial Recognition Access Regulations Technology Half Yearly Roadmap Icons
Presenting our innovatively structured facial recognition access regulations technology half yearly roadmap icons Template. Showcase your roadmap process in different formats like PDF, PNG, and JPG by clicking the download button below. This PPT design is available in both Standard Screen and Widescreen aspect ratios. It can also be easily personalized and presented with modified font size, font type, color, and shapes to measure your progress in a clear way.
Quarterly Process Roadmap For Matching Clients With Digital Assistant Icons
Presenting our innovatively-structured quarterly process roadmap for matching clients with digital assistant icons Template. Showcase your roadmap process in different formats like PDF, PNG, and JPG by clicking the download button below. This PPT design is available in both Standard Screen and Widescreen aspect ratios. It can also be easily personalized and presented with modified font size, font type, color, and shapes to measure your progress in a clear way.
Six Month Digital Criminalistics Roadmap With Data Collection Icons
Presenting our innovatively-structured six month digital criminalistics roadmap with data collection icons Template. Showcase your roadmap process in different formats like PDF, PNG, and JPG by clicking the download button below. This PPT design is available in both Standard Screen and Widescreen aspect ratios. It can also be easily personalized and presented with modified font size, font type, color, and shapes to measure your progress in a clear way.
6 Months Early Alzheimer Drug Evolution Roadmap Icons
Presenting our innovatively-structured 6 months early alzheimer drug evolution roadmap icons Template. Showcase your roadmap process in different formats like PDF, PNG, and JPG by clicking the download button below. This PPT design is available in both Standard Screen and Widescreen aspect ratios. It can also be easily personalized and presented with modified font size, font type, color, and shapes to measure your progress in a clear way.
5 Yearly Roadmap For Healthcare Safety At Workplace Icons
Presenting our innovatively structured 5 yearly roadmap for healthcare safety at workplace icons Template. Showcase your roadmap process in different formats like PDF, PNG, and JPG by clicking the download button below. This PPT design is available in both Standard Screen and Widescreen aspect ratios. It can also be easily personalized and presented with modified font size, font type, color, and shapes to measure your progress in a clear way.


 Continue with Email

 Home
Home


