org chart
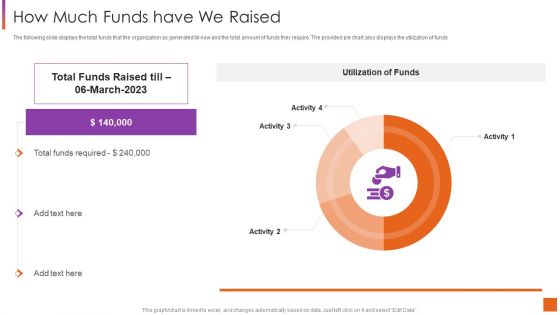
Investor Pitch Deck For Software Development How Much Funds Have We Raised Infographics PDF
The following slide displays the total funds that the organization as generated till now and the total amount of funds they require. The provided pie chart also displays the utilization of funds. Deliver an awe inspiring pitch with this creative Investor Pitch Deck For Software Development How Much Funds Have We Raised Infographics PDF bundle. Topics like Funds Raised, Utilization Funds, Activity can be discussed with this completely editable template. It is available for immediate download depending on the needs and requirements of the user.
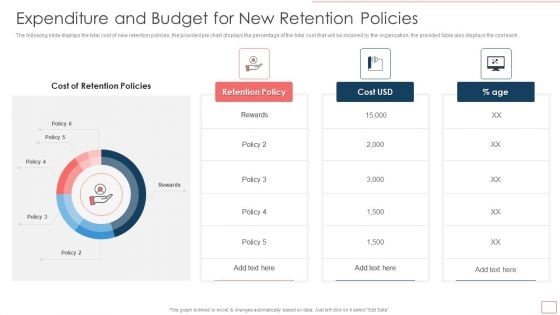
Strategic Human Resource Retention Management Expenditure And Budget Inspiration PDF
The following slide displays the total cost of new retention policies, the provided pie chart displays the percentage of the total cost that will be incurred by the organization, the provided table also displays the cost each. Deliver an awe inspiring pitch with this creative Strategic Human Resource Retention Management Expenditure And Budget Inspiration PDF bundle. Topics like Retention Policies, Rewards, Cost Of Retention can be discussed with this completely editable template. It is available for immediate download depending on the needs and requirements of the user.
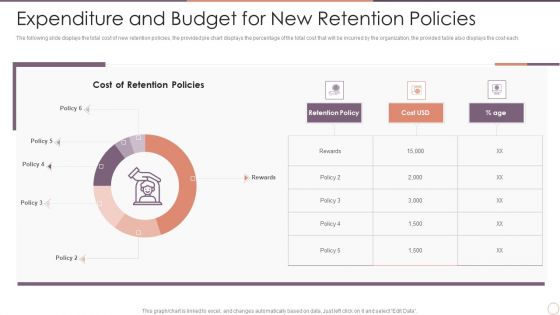
Managing Employee Turnover Expenditure And Budget For New Retention Policies Topics PDF
The following slide displays the total cost of new retention policies, the provided pie chart displays the percentage of the total cost that will be incurred by the organization, the provided table also displays the cost each. Deliver and pitch your topic in the best possible manner with this Managing Employee Turnover Expenditure And Budget For New Retention Policies Topics PDF. Use them to share invaluable insights on Expenditure And Budget, New Retention Policies and impress your audience. This template can be altered and modified as per your expectations. So, grab it now.
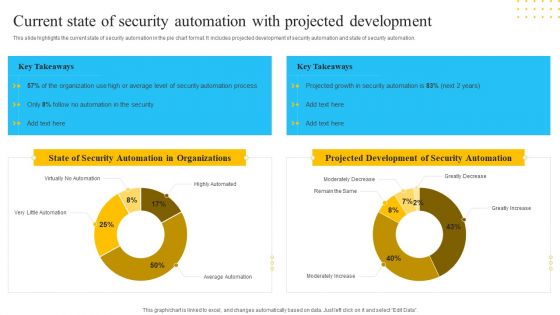
IT Security Automation Tools Integration Current State Of Security Automation With Projected Introduction PDF
This slide highlights the current state of security automation in the pie chart format. It includes projected development of security automation and state of security automation. Deliver and pitch your topic in the best possible manner with this IT Security Automation Tools Integration Current State Of Security Automation With Projected Introduction PDF. Use them to share invaluable insights on State Security, Automation Organizations, Projected Development, Security Automation and impress your audience. This template can be altered and modified as per your expectations. So, grab it now.
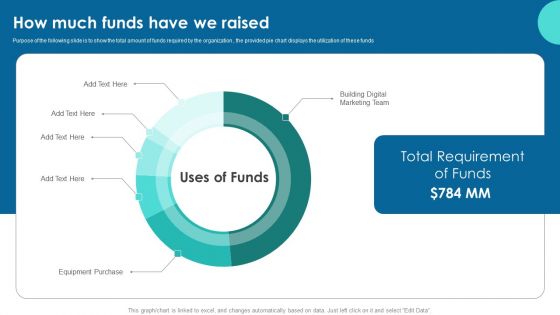
How Much Funds Have We Raised Inbound Marketing Business Fundraising Elevator Guidelines PDF
Purpose of the following slide is to show the total amount of funds required by the organization , the provided pie chart displays the utilization of these funds. Want to ace your presentation in front of a live audience Our How Much Funds Have We Raised Inbound Marketing Business Fundraising Elevator Guidelines PDF can help you do that by engaging all the users towards you. Slidegeeks experts have put their efforts and expertise into creating these impeccable powerpoint presentations so that you can communicate your ideas clearly. Moreover, all the templates are customizable, and easy-to-edit and downloadable. Use these for both personal and commercial use.
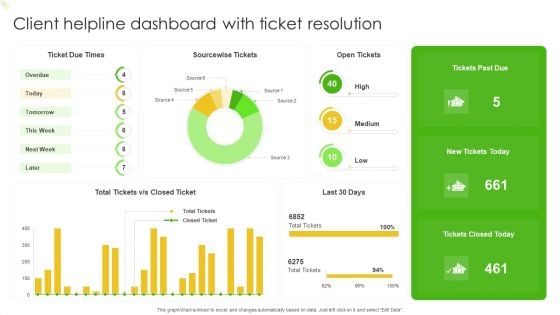
Client Helpline Dashboard With Ticket Resolution Ppt Model Graphics Design PDF
This graph or chart is linked to excel, and changes automatically based on data. Just left click on it and select Edit Data. Pitch your topic with ease and precision using this Client Helpline Dashboard With Ticket Resolution Ppt Model Graphics Design PDF. This layout presents information on Ticket Due Times, Sourcewise Tickets, Open Tickets. It is also available for immediate download and adjustment. So, changes can be made in the color, design, graphics or any other component to create a unique layout.
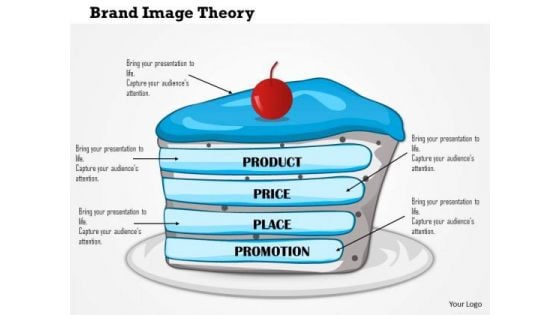
Business Framework Brand Image Theory PowerPoint Presentation
Colored chart graphic with multiple milestones has been used to decorate this Power Point template slide. This PPT slide contains the concept of data prediction. This slide shows big data from descriptive to predictive way. Use this PPT slide for business data analysis related presentation.
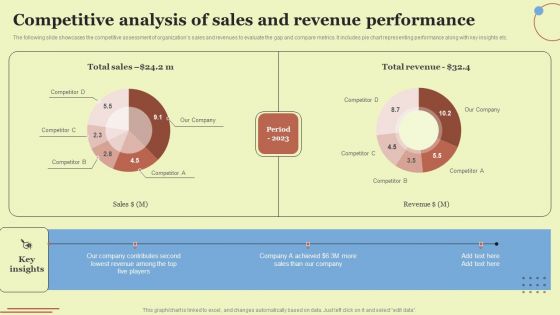
Competitive Analysis Of Sales And Revenue Performance Elements PDF
The following slide showcases the competitive assessment of organizations sales and revenues to evaluate the gap and compare metrics. It includes pie chart representing performance along with key insights etc. Take your projects to the next level with our ultimate collection of Competitive Analysis Of Sales And Revenue Performance Elements PDF. Slidegeeks has designed a range of layouts that are perfect for representing task or activity duration, keeping track of all your deadlines at a glance. Tailor these designs to your exact needs and give them a truly corporate look with your own brand colors they will make your projects stand out from the rest.
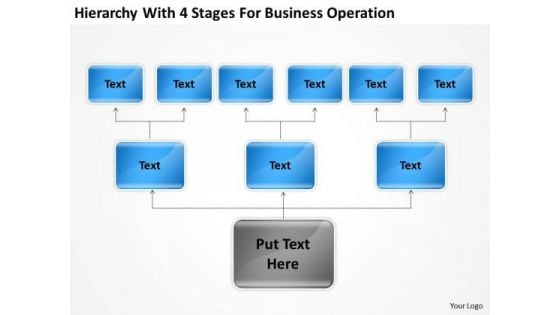
Hierarchy With 4 Stages For Business Operation Ppt Sample Small Plan PowerPoint Slides
We present our hierarchy with 4 stages for business operation ppt sample small plan PowerPoint Slides.Present our Business PowerPoint Templates because Our PowerPoint Templates and Slides come in all colours, shades and hues. They help highlight every nuance of your views. Present our Finance PowerPoint Templates because Our PowerPoint Templates and Slides will let you Hit the right notes. Watch your audience start singing to your tune. Download our Shapes PowerPoint Templates because Our PowerPoint Templates and Slides will Embellish your thoughts. They will help you illustrate the brilliance of your ideas. Use our Flow Charts PowerPoint Templates because Our PowerPoint Templates and Slides are designed to help you succeed. They have all the ingredients you need. Present our Process and Flows PowerPoint Templates because Our PowerPoint Templates and Slides are Clear and concise. Use them and dispel any doubts your team may have.Use these PowerPoint slides for presentations relating to Business, plan, process, chart, corporate, success, diagram, strong, finance, analysis, idea, management, start, stage, operational, strategy, develop, professional, procedure, organize, assessment, increase, implement, successful, improvement, financial, continuous. The prominent colors used in the PowerPoint template are Blue, Gray, Black. Connect the dots differently. Be daring with our Hierarchy With 4 Stages For Business Operation Ppt Sample Small Plan PowerPoint Slides.
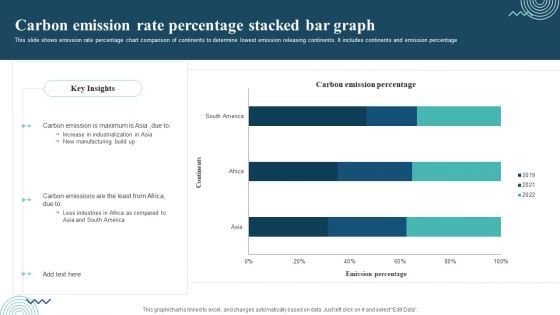
Carbon Emission Rate Percentage Stacked Bar Graph Rules PDF
This slide shows emission rate percentage chart comparison of continents to determine lowest emission releasing continents. It includes continents and emission percentage Showcasing this set of slides titled Carbon Emission Rate Percentage Stacked Bar Graph Rules PDF. The topics addressed in these templates are Carbon Emission, Increase In Industrialization, New Manufacturing. All the content presented in this PPT design is completely editable. Download it and make adjustments in color, background, font etc. as per your unique business setting.
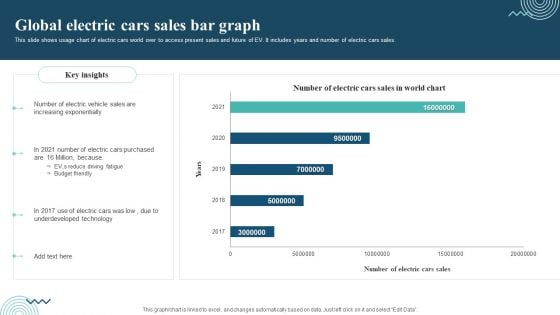
Global Electric Cars Sales Bar Graph Graphics PDF
This slide shows usage chart of electric cars world over to access present sales and future of EV. It includes years and number of electric cars sales. Showcasing this set of slides titled Global Electric Cars Sales Bar Graph Graphics PDF. The topics addressed in these templates are Electric Vehicle Sales, Electric Cars Purchased, Underdeveloped Technology. All the content presented in this PPT design is completely editable. Download it and make adjustments in color, background, font etc. as per your unique business setting.
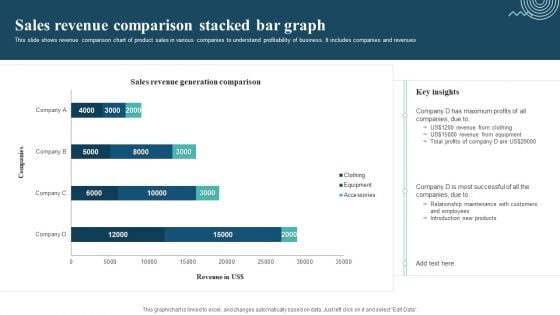
Sales Revenue Comparison Stacked Bar Graph Mockup PDF
This slide shows revenue comparison chart of product sales in various companies to understand profitability of business. It includes companies and revenues. Showcasing this set of slides titled Sales Revenue Comparison Stacked Bar Graph Mockup PDF. The topics addressed in these templates are Sales Revenue Comparison, Revenue From Clothing, Revenue From Equipment. All the content presented in this PPT design is completely editable. Download it and make adjustments in color, background, font etc. as per your unique business setting.
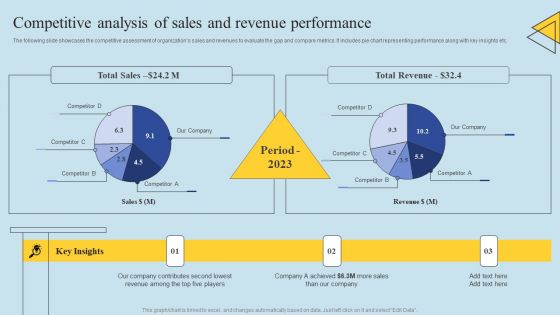
Determining Risks In Sales Administration Procedure Competitive Analysis Of Sales And Revenue Introduction PDF
The following slide showcases the competitive assessment of organizations sales and revenues to evaluate the gap and compare metrics. It includes pie chart representing performance along with key insights etc. Make sure to capture your audiences attention in your business displays with our gratis customizable Determining Risks In Sales Administration Procedure Competitive Analysis Of Sales And Revenue Introduction PDF. These are great for business strategies, office conferences, capital raising or task suggestions. If you desire to acquire more customers for your tech business and ensure they stay satisfied, create your own sales presentation with these plain slides.
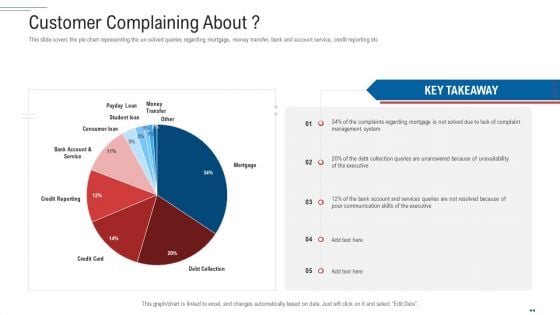
Customer Complaint Handling Process Customer Complaining About Topics PDF
This slide covers the pie chart representing the un-solved queries regarding mortgage, money transfer, bank and account service, credit reporting etc. Deliver an awe inspiring pitch with this creative customer complaint handling process customer complaining about topics pdf bundle. Topics like executive, management, communication, services can be discussed with this completely editable template. It is available for immediate download depending on the needs and requirements of the user.

Bar Graph Showing Revenues Generated By Sales Department Ppt Portfolio Graphics Example PDF
This graph or chart is linked to excel, and changes automatically based on data. Just left click on it and select edit data. Showcasing this set of slides titled bar graph showing revenues generated by sales department ppt portfolio graphics example pdf. The topics addressed in these templates are yearly sales revenues, sales team, profits. All the content presented in this PPT design is completely editable. Download it and make adjustments in color, background, font etc. as per your unique business setting.
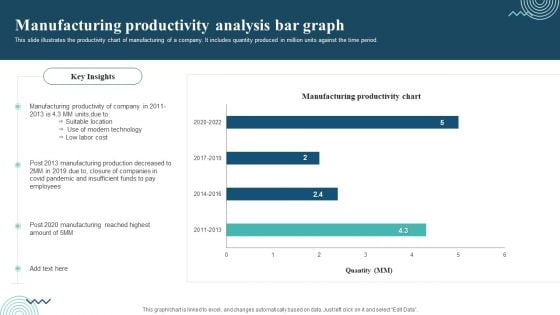
Manufacturing Productivity Analysis Bar Graph Introduction PDF
This slide illustrates the productivity chart of manufacturing of a company. It includes quantity produced in million units against the time period. Pitch your topic with ease and precision using this Manufacturing Productivity Analysis Bar Graph Introduction PDF. This layout presents information on Manufacturing Productivity, Production Decreased, Closure Of Companies. It is also available for immediate download and adjustment. So, changes can be made in the color, design, graphics or any other component to create a unique layout.

Carbon Emissions Of Countries Bar Graph Professional PDF
This slide depicts emissions chart of various countries to avoid the worst impacts of climate change. It includes countries and carbon emissions in million metric tons. Pitch your topic with ease and precision using this Carbon Emissions Of Countries Bar Graph Professional PDF. This layout presents information on Maximum Production, Consumer Goods, Carbon Emissions. It is also available for immediate download and adjustment. So, changes can be made in the color, design, graphics or any other component to create a unique layout.
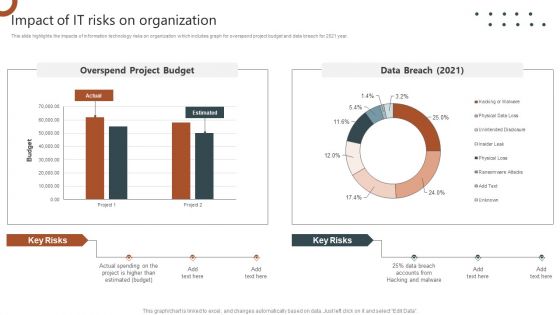
Organizations Risk Management And IT Security Impact Of IT Risks On Organization Structure PDF
This slide highlights the impacts of information technology risks on organization which includes graph for overspend project budget and data breach for 2021 year. Explore a selection of the finest Organizations Risk Management And IT Security Impact Of IT Risks On Organization Structure PDF here. With a plethora of professionally designed and pre made slide templates, you can quickly and easily find the right one for your upcoming presentation. You can use our Organizations Risk Management And IT Security Impact Of IT Risks On Organization Structure PDF to effectively convey your message to a wider audience. Slidegeeks has done a lot of research before preparing these presentation templates. The content can be personalized and the slides are highly editable. Grab templates today from Slidegeeks.
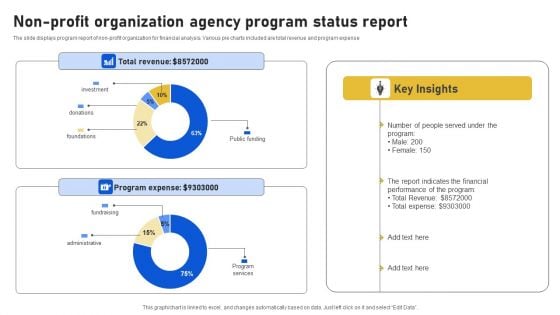
Non-Profit Organization Agency Program Status Report Diagrams PDF
The slide displays program report of non-profit organization for financial analysis. Various pie charts included are total revenue and program expense. Showcasing this set of slides titled Non-Profit Organization Agency Program Status Report Diagrams PDF. The topics addressed in these templates are Total Revenue, Program Expense, Report Indicates. All the content presented in this PPT design is completely editable. Download it and make adjustments in color, background, font etc. as per your unique business setting.
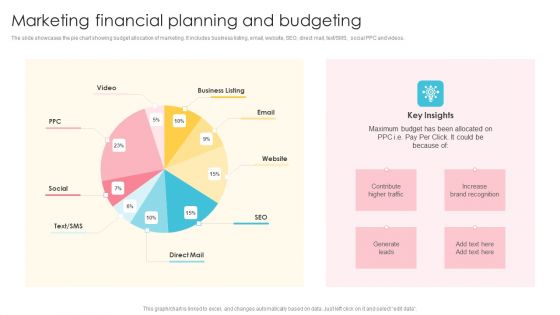
Marketing Financial Planning And Budgeting Ideas PDF
The slide showcases the pie chart showing budget allocation of marketing. It includes business listing, email, website, SEO, direct mail, text SMS, social PPC and videos. Showcasing this set of slides titled Marketing Financial Planning And Budgeting Ideas PDF. The topics addressed in these templates are Business Listing, Social, Direct Mail. All the content presented in this PPT design is completely editable. Download it and make adjustments in color, background, font etc. as per your unique business setting.
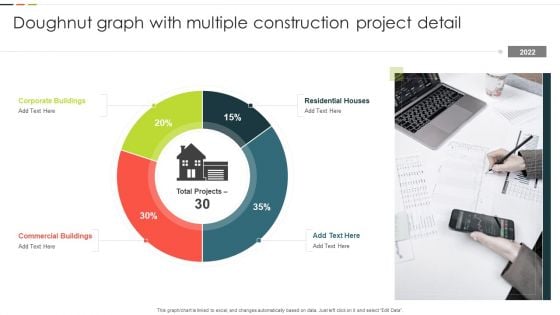
Doughnut Graph With Multiple Construction Project Detail Structure PDF
This graph or chart is linked to excel, and changes automatically based on data. Just left click on it and select Edit Data. Showcasing this set of slides titled Doughnut Graph With Multiple Construction Project Detail Structure PDF. The topics addressed in these templates are Corporate Buildings, Residential Houses, Commercial Buildings. All the content presented in this PPT design is completely editable. Download it and make adjustments in color, background, font etc. as per your unique business setting.
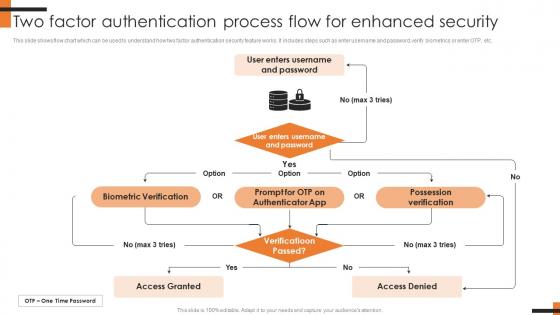
Two Factor Authentication Process Flow For Comprehensive Smartphone Banking Diagrams Pdf
This slide shows flow chart which can be used to understand how two factor authentication security feature works. It includes steps such as enter username and password, verify biometrics or enter OTP, etc. The Two Factor Authentication Process Flow For Comprehensive Smartphone Banking Diagrams Pdf is a compilation of the most recent design trends as a series of slides. It is suitable for any subject or industry presentation, containing attractive visuals and photo spots for businesses to clearly express their messages. This template contains a variety of slides for the user to input data, such as structures to contrast two elements, bullet points, and slides for written information. Slidegeeks is prepared to create an impression. This slide shows flow chart which can be used to understand how two factor authentication security feature works. It includes steps such as enter username and password, verify biometrics or enter OTP, etc.
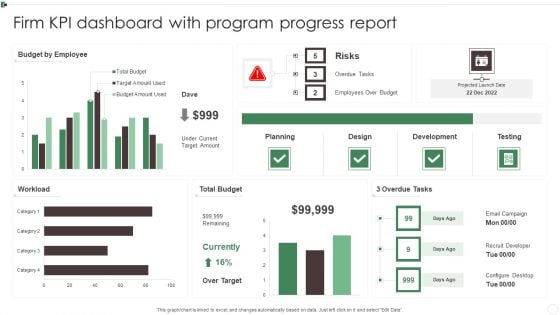
Firm KPI Dashboard With Program Progress Report Ppt Pictures Deck PDF
This graph or chart is linked to excel, and changes automatically based on data. Just left click on it and select Edit Data. Showcasing this set of slides titled Firm KPI Dashboard With Program Progress Report Ppt Pictures Deck PDF. The topics addressed in these templates are Budget By Employee, Total Budget, 3 Overdue Tasks, Workload. All the content presented in this PPT design is completely editable. Download it and make adjustments in color, background, font etc. as per your unique business setting.
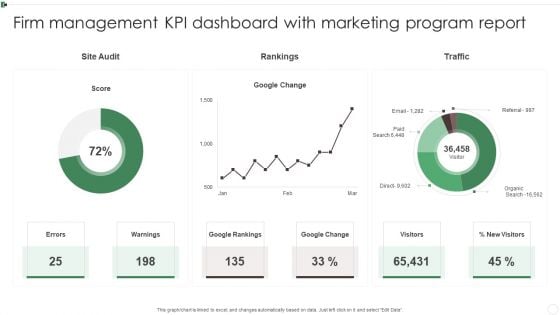
Firm Management KPI Dashboard With Marketing Program Report Ppt Styles Introduction PDF
This graph or chart is linked to excel, and changes automatically based on data. Just left click on it and select Edit Data. Showcasing this set of slides titled Firm Management KPI Dashboard With Marketing Program Report Ppt Styles Introduction PDF. The topics addressed in these templates are Google Rankings, Google Change, Warnings, Visitors. All the content presented in this PPT design is completely editable. Download it and make adjustments in color, background, font etc. as per your unique business setting.
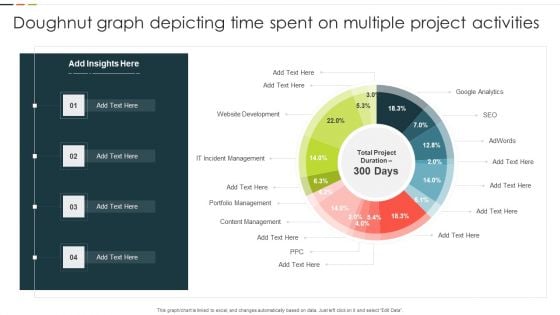
Doughnut Graph Depicting Time Spent On Multiple Project Activities Microsoft PDF
This graph or chart is linked to excel, and changes automatically based on data. Just left click on it and select Edit Data. Showcasing this set of slides titled Doughnut Graph Depicting Time Spent On Multiple Project Activities Microsoft PDF. The topics addressed in these templates are Website Development, IT Incident Management, Portfolio Management. All the content presented in this PPT design is completely editable. Download it and make adjustments in color, background, font etc. as per your unique business setting.
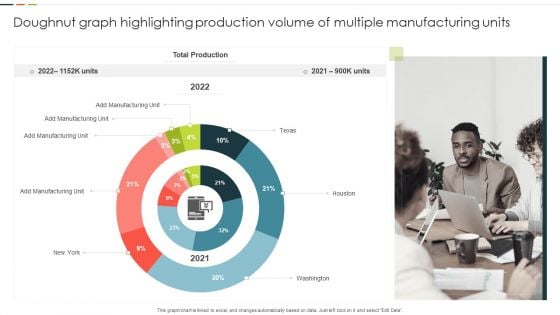
Doughnut Graph Highlighting Production Volume Of Multiple Manufacturing Units Guidelines PDF
This graph or chart is linked to excel, and changes automatically based on data. Just left click on it and select Edit Data. Showcasing this set of slides titled Doughnut Graph Highlighting Production Volume Of Multiple Manufacturing Units Guidelines PDF. The topics addressed in these templates are Total Production, Manufacturing Unit, Washington. All the content presented in this PPT design is completely editable. Download it and make adjustments in color, background, font etc. as per your unique business setting.
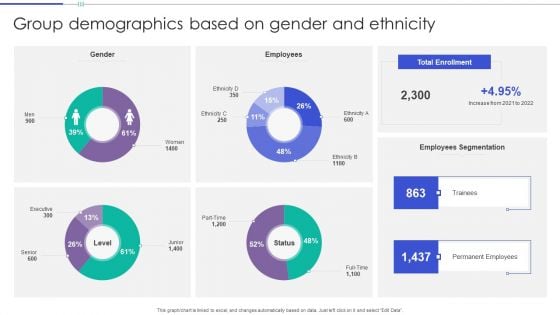
Group Demographics Based On Gender And Ethnicity Themes PDF
This graph or chart is linked to excel, and changes automatically based on data. Just left click on it and select Edit Data. Showcasing this set of slides titled Group Demographics Based On Gender And Ethnicity Themes PDF. The topics addressed in these templates are Gender, Employees, Total Enrollment. All the content presented in this PPT design is completely editable. Download it and make adjustments in color, background, font etc. as per your unique business setting.
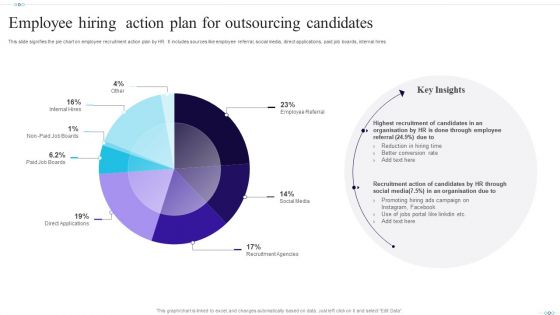
Employee Hiring Action Plan For Outsourcing Candidates Template PDF
This slide signifies the pie chart on employee recruitment action plan by HR. It includes sources like employee referral, social media, direct applications, paid job boards, internal hires. Showcasing this set of slides titled Employee Hiring Action Plan For Outsourcing Candidates Template PDF. The topics addressed in these templates are Employee Hiring Action Plan, Outsourcing Candidates. All the content presented in this PPT design is completely editable. Download it and make adjustments in color, background, font etc. as per your unique business setting.
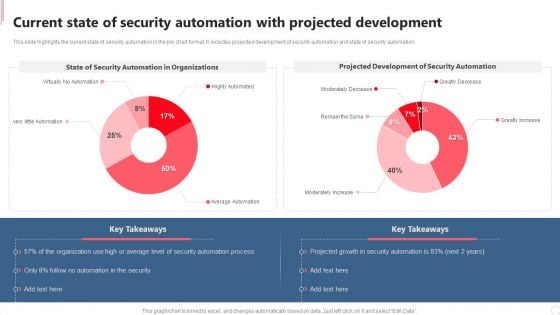
Current State Of Security Automation With Projected Development Rules PDF
This slide highlights the current state of security automation in the pie chart format. It includes projected development of security automation and state of security automation. If you are looking for a format to display your unique thoughts, then the professionally designed Current State Of Security Automation With Projected Development Rules PDF is the one for you. You can use it as a Google Slides template or a PowerPoint template. Incorporate impressive visuals, symbols, images, and other charts. Modify or reorganize the text boxes as you desire. Experiment with shade schemes and font pairings. Alter, share or cooperate with other people on your work. Download Current State Of Security Automation With Projected Development Rules PDF and find out how to give a successful presentation. Present a perfect display to your team and make your presentation unforgettable.
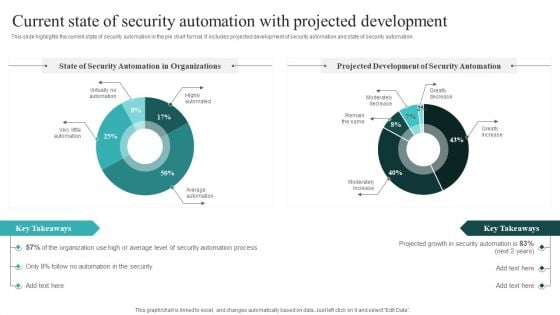
Current State Of Security Automation With Projected Development Slides PDF
This slide highlights the current state of security automation in the pie chart format. It includes projected development of security automation and state of security automation. If you are looking for a format to display your unique thoughts, then the professionally designed IT Security Automation Systems Guide Different Security Automation Tools With Pros And Cons Summary PDF is the one for you. You can use it as a Google Slides template or a PowerPoint template. Incorporate impressive visuals, symbols, images, and other charts. Modify or reorganize the text boxes as you desire. Experiment with shade schemes and font pairings. Alter, share or cooperate with other people on your work. Download IT Security Automation Systems Guide Different Security Automation Tools With Pros And Cons Summary PDF and find out how to give a successful presentation. Present a perfect display to your team and make your presentation unforgettable.
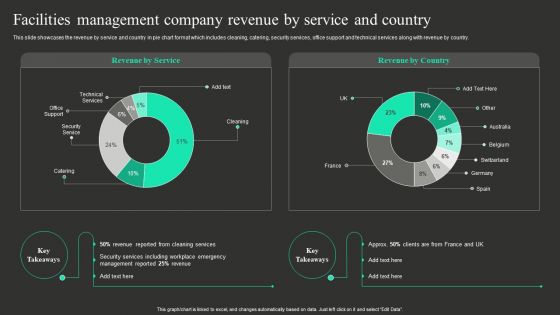
Facilities Management Company Revenue By Service And Country Information PDF
This slide showcases the revenue by service and country in pie chart format which includes cleaning, catering, security services, office support and technical services along with revenue by country. If you are looking for a format to display your unique thoughts, then the professionally designed Facilities Management Company Revenue By Service And Country Information PDF is the one for you. You can use it as a Google Slides template or a PowerPoint template. Incorporate impressive visuals, symbols, images, and other charts. Modify or reorganize the text boxes as you desire. Experiment with shade schemes and font pairings. Alter, share or cooperate with other people on your work. Download Facilities Management Company Revenue By Service And Country Information PDF and find out how to give a successful presentation. Present a perfect display to your team and make your presentation unforgettable.
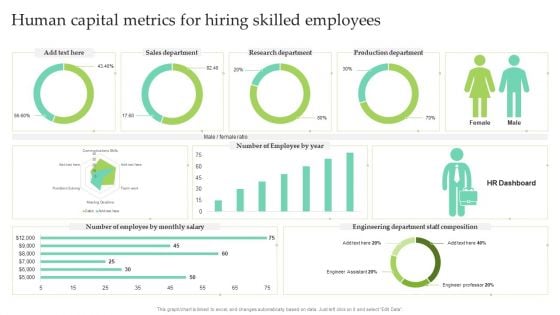
Human Capital Metrics For Hiring Skilled Employees Ppt Slides Themes PDF
This graph or chart is linked to excel, and changes automatically based on data. Just left click on it and select Edit Data. Showcasing this set of slides titled Human Capital Metrics For Hiring Skilled Employees Ppt Slides Themes PDF. The topics addressed in these templates are Sales Department, Research Department, Production Department. All the content presented in this PPT design is completely editable. Download it and make adjustments in color, background, font etc. as per your unique business setting.
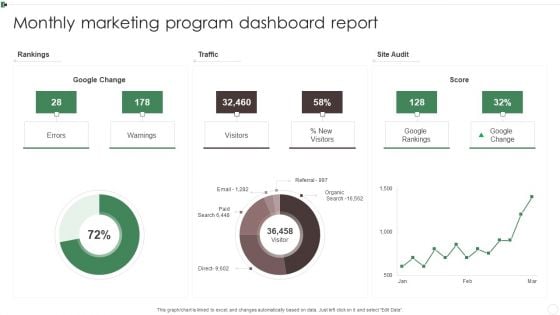
Monthly Marketing Program Dashboard Report Ppt Inspiration Information PDF
This graph or chart is linked to excel, and changes automatically based on data. Just left click on it and select Edit Data. Pitch your topic with ease and precision using this Monthly Marketing Program Dashboard Report Ppt Inspiration Information PDF. This layout presents information on Rankings, Traffic, Site Audit, Warnings. It is also available for immediate download and adjustment. So, changes can be made in the color, design, graphics or any other component to create a unique layout.
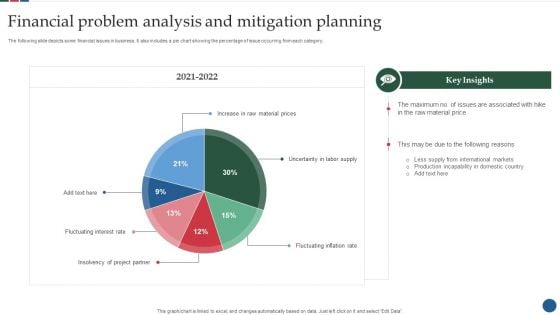
Financial Problem Analysis And Mitigation Planning Portrait PDF
The following slide depicts some financial issues in business. It also includes a pie chart showing the percentage of issue occurring from each category. Showcasing this set of slides titled Financial Problem Analysis And Mitigation Planning Portrait PDF. The topics addressed in these templates are Raw Material Price, International Markets, Production Incapability. All the content presented in this PPT design is completely editable. Download it and make adjustments in color, background, font etc. as per your unique business setting.
Finance Metrics Dashboard Illustrating Gross And Operating Profit Margin Icons PDF
This graph or chart is linked to excel, and changes automatically based on data. Just left click on it and select edit data. Showcasing this set of slides titled Finance Metrics Dashboard Illustrating Gross And Operating Profit Margin Icons PDF. The topics addressed in these templates are Gross Profit Margin, Operating Profit Margin, Net Profit Margin. All the content presented in this PPT design is completely editable. Download it and make adjustments in color, background, font etc. as per your unique business setting.
Social Media Marketing Performance Highlights With Key Campaign Results Ppt Icon PDF
This graph or chart is linked to excel, and changes automatically based on data. Just left click on it and select Edit Data. Showcasing this set of slides titled Social Media Marketing Performance Highlights With Key Campaign Results Ppt Icon PDF. The topics addressed in these templates are Profit Per, Overall Campaign, Total Budget. All the content presented in this PPT design is completely editable. Download it and make adjustments in color, background, font etc. as per your unique business setting.
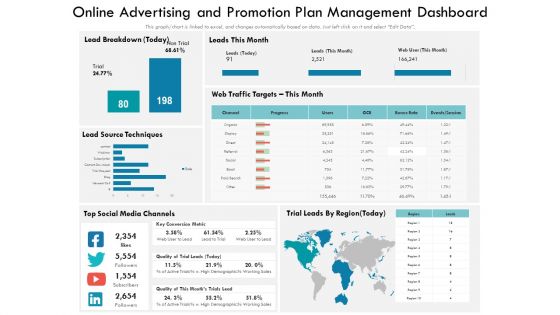
Online Advertising And Promotion Plan Management Dashboard Ppt PowerPoint Presentation Show Tips PDF
This graph chart is linked to excel, and changes automatically based on data. Just left click on it and select Edit Data. Showcasing this set of slides titled online advertising and promotion plan management dashboard ppt powerpoint presentation show tips pdf. The topics addressed in these templates are source techniques, social media channels, traffic targets. All the content presented in this PPT design is completely editable. Download it and make adjustments in color, background, font etc. as per your unique business setting.
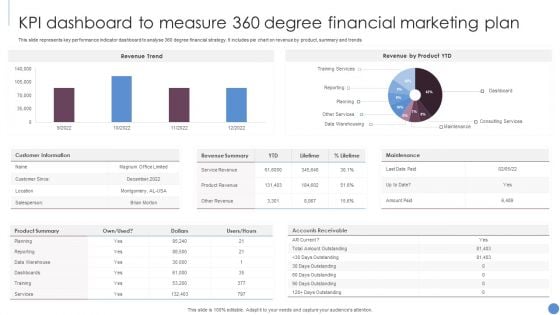
KPI Dashboard To Measure 360 Degree Financial Marketing Plan Slides PDF
This slide represents key performance indicator dashboard to analyse 360 degree financial strategy. It includes pie chart on revenue by product, summary and trends. Showcasing this set of slides titled KPI Dashboard To Measure 360 Degree Financial Marketing Plan Slides PDF. The topics addressed in these templates are Revenue Trend, Revenue Product YTD, Customer Information. All the content presented in this PPT design is completely editable. Download it and make adjustments in color, background, font etc. as per your unique business setting.
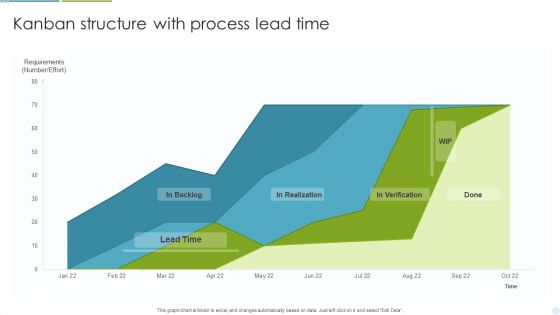
Kanban Structure With Process Lead Time Ppt Gallery Template PDF
This graph or chart is linked to excel, and changes automatically based on data. Just left click on it and select Edit Data. Showcasing this set of slides titled Kanban Structure With Process Lead Time Ppt Gallery Template PDF. The topics addressed in these templates are Lead Time, In Realization, Requirements. All the content presented in this PPT design is completely editable. Download it and make adjustments in color, background, font etc. as per your unique business setting.
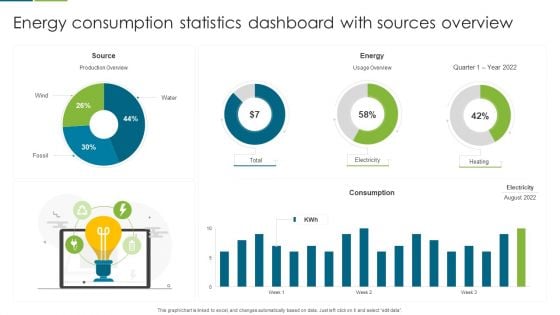
Energy Consumption Statistics Dashboard With Sources Overview Template PDF
This graph or chart is linked to excel, and changes automatically based on data. Just left click on it and select edit data. Pitch your topic with ease and precision using this Energy Consumption Statistics Dashboard With Sources Overview Template PDF. This layout presents information on Source, Energy, Consumption. It is also available for immediate download and adjustment. So, changes can be made in the color, design, graphics or any other component to create a unique layout.
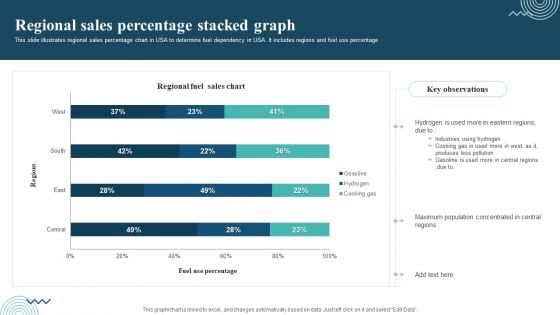
Regional Sales Percentage Stacked Graph Themes PDF
This slide illustrates regional sales percentage chart in USA to determine fuel dependency in USA. It includes regions and fuel use percentage. Pitch your topic with ease and precision using this Regional Sales Percentage Stacked Graph Themes PDF. This layout presents information on Regional Sales, Industries Using Hydrogen, Cooking Gas. It is also available for immediate download and adjustment. So, changes can be made in the color, design, graphics or any other component to create a unique layout.
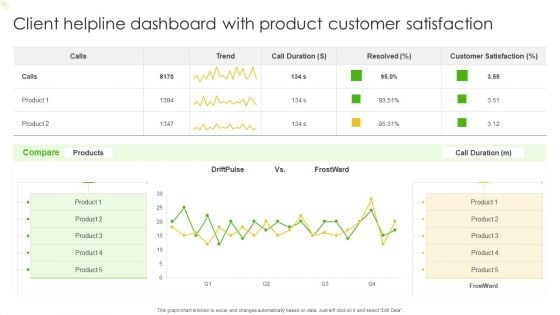
Client Helpline Dashboard With Product Customer Satisfaction Ppt Slides Graphics Template PDF
This graph or chart is linked to excel, and changes automatically based on data. Just left click on it and select Edit Data. Pitch your topic with ease and precision using this Client Helpline Dashboard With Product Customer Satisfaction Ppt Slides Graphics Template PDF. This layout presents information on Customer Satisfaction, Product, Compare. It is also available for immediate download and adjustment. So, changes can be made in the color, design, graphics or any other component to create a unique layout.
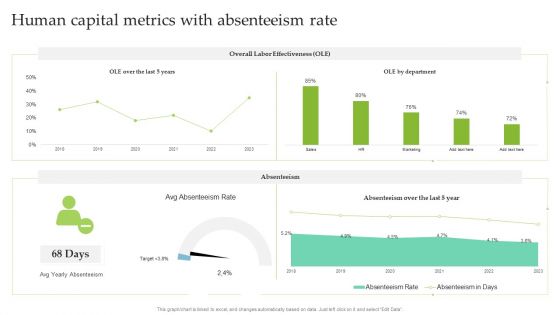
Human Capital Metrics With Absenteeism Rate Ppt Infographic Template Ideas PDF
This graph or chart is linked to excel, and changes automatically based on data. Just left click on it and select Edit Data. Pitch your topic with ease and precision using this Human Capital Metrics With Absenteeism Rate Ppt Infographic Template Ideas PDF. This layout presents information on Overall Labor Effectiveness, OLE Department, Absenteeism. It is also available for immediate download and adjustment. So, changes can be made in the color, design, graphics or any other component to create a unique layout.
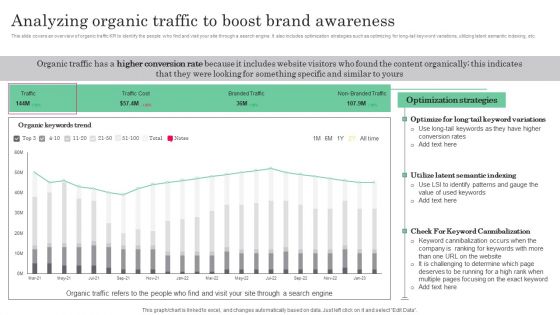
Online Marketing Analytics To Enhance Business Growth Analyzing Organic Traffic To Boost Brand Awareness Structure PDF
This slide covers an overview of organic traffic KPI to identify the people who find and visit your site through a search engine. It also includes optimization strategies such as optimizing for long-tail keyword variations, utilizing latent semantic indexing, etc. Create an editable Online Marketing Analytics To Enhance Business Growth Analyzing Organic Traffic To Boost Brand Awareness Structure PDF that communicates your idea and engages your audience. Whether youre presenting a business or an educational presentation, pre designed presentation templates help save time. Online Marketing Analytics To Enhance Business Growth Analyzing Organic Traffic To Boost Brand Awareness Structure PDF is highly customizable and very easy to edit, covering many different styles from creative to business presentations. Slidegeeks has creative team members who have crafted amazing templates. So, go and get them without any delay.
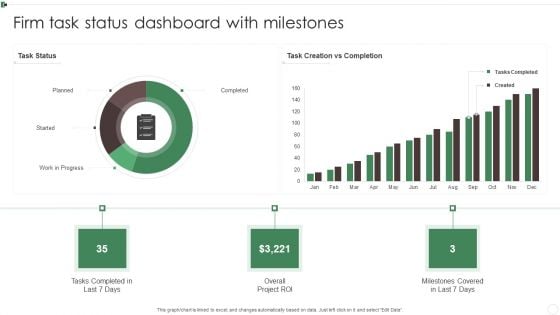
Firm Task Status Dashboard With Milestones Ppt Show Sample PDF
This graph or chart is linked to excel, and changes automatically based on data. Just left click on it and select Edit Data. Showcasing this set of slides titled Firm Task Status Dashboard With Milestones Ppt Show Sample PDF. The topics addressed in these templates are Tasks Completed, Planned, Work Progress, Overall Project ROI. All the content presented in this PPT design is completely editable. Download it and make adjustments in color, background, font etc. as per your unique business setting.
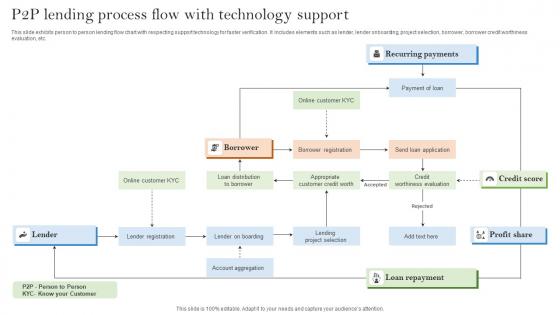
P2P Lending Process Flow With Technology Support Brochure Pdf
This slide exhibits person to person lending flow chart with respecting support technology for faster verification. It includes elements such as lender, lender onboarding, project selection, borrower, borrower credit worthiness evaluation, etc. Showcasing this set of slides titled P2P Lending Process Flow With Technology Support Brochure Pdf. The topics addressed in these templates are Profit Share, Credit Score, Recurring Payments. All the content presented in this PPT design is completely editable. Download it and make adjustments in color, background, font etc. as per your unique business setting. This slide exhibits person to person lending flow chart with respecting support technology for faster verification. It includes elements such as lender, lender onboarding, project selection, borrower, borrower credit worthiness evaluation, etc.
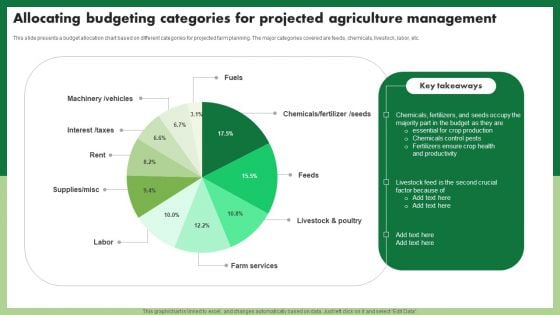
Allocating Budgeting Categories For Projected Agriculture Management Infographics PDF
This slide presents a budget allocation chart based on different categories for projected farm planning. The major categories covered are feeds, chemicals, livestock, labor, etc. Showcasing this set of slides titled Allocating Budgeting Categories For Projected Agriculture Management Infographics PDF. The topics addressed in these templates are Machinery Vehicles, Interest Taxes. All the content presented in this PPT design is completely editable. Download it and make adjustments in color, background, font etc. as per your unique business setting.
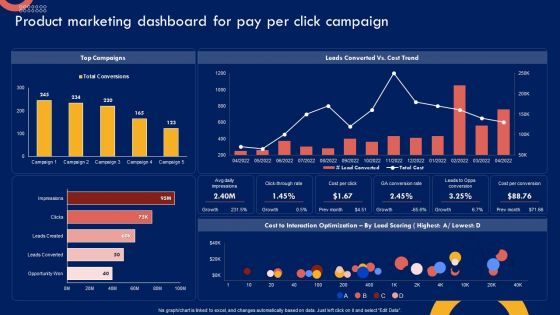
Product Marketing Leadership Product Marketing Dashboard For Pay Per Microsoft PDF
This graph or chart is linked to excel, and changes automatically based on data. Just left click on it and select Edit Data. Find a pre-designed and impeccable Product Marketing Leadership Product Marketing Dashboard For Pay Per Microsoft PDF. The templates can ace your presentation without additional effort. You can download these easy-to-edit presentation templates to make your presentation stand out from others. So, what are you waiting for Download the template from Slidegeeks today and give a unique touch to your presentation.
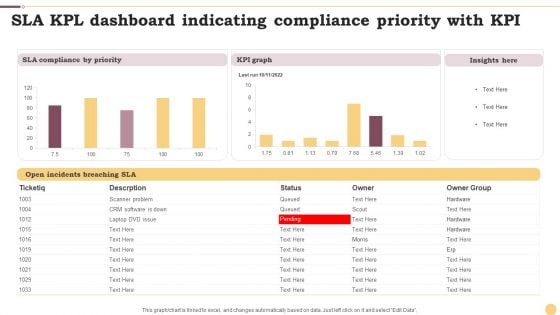
SLA KPL Dashboard Indicating Compliance Priority With KPI Ppt File Format PDF
This graph or chart is linked to excel, and changes automatically based on data. Just left click on it and select Edit Data. Showcasing this set of slides titled SLA KPL Dashboard Indicating Compliance Priority With KPI Ppt File Format PDF. The topics addressed in these templates are KPI Graph, Insights Here, SLA Compliance Priority. All the content presented in this PPT design is completely editable. Download it and make adjustments in color, background, font etc. as per your unique business setting.
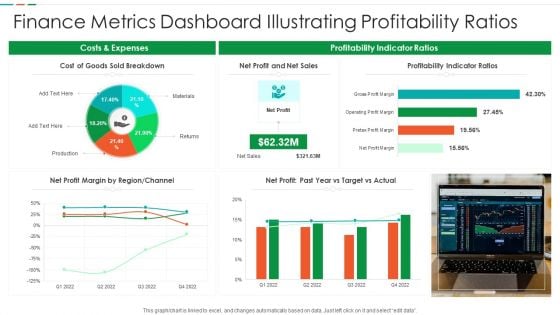
Finance Metrics Dashboard Illustrating Profitability Ratios Diagrams PDF
This graph or chart is linked to excel, and changes automatically based on data. Just left click on it and select edit data. Pitch your topic with ease and precision using this Finance Metrics Dashboard Illustrating Profitability Ratios Diagrams PDF. This layout presents information on Cost Goods Sold, Net Profit Net, Sales Profitability Indicator. It is also available for immediate download and adjustment. So, changes can be made in the color, design, graphics or any other component to create a unique layout.
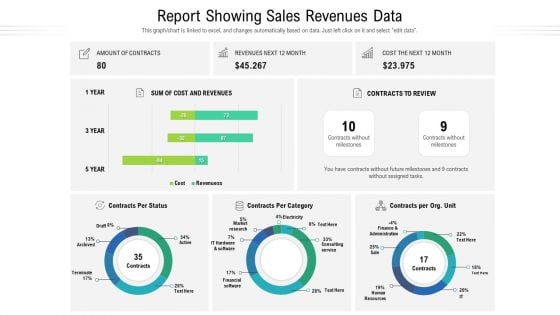
Report Showing Sales Revenues Data Ppt Show Backgrounds PDF
This graph or chart is linked to excel, and changes automatically based on data. Just left click on it and select edit data. Showcasing this set of slides titled report showing sales revenues data ppt show backgrounds pdf. The topics addressed in these templates are cost and revenues, market research, finance and administration. All the content presented in this PPT design is completely editable. Download it and make adjustments in color, background, font etc. as per your unique business setting.
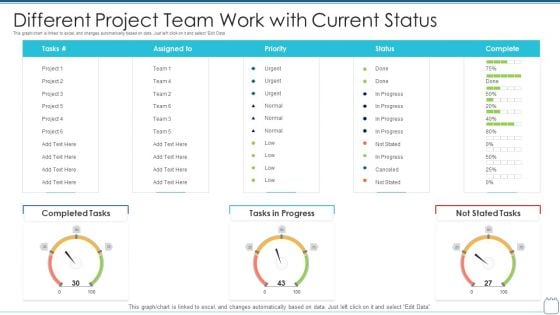
Different Project Team Work With Current Status Graphics PDF
This graph chart is linked to excel, and changes automatically based on data. Just left click on it and select Edit Data Showcasing this set of slides titled different project team work with current status graphics pdf . The topics addressed in these templates are different project team work with current status . All the content presented in this PPT design is completely editable. Download it and make adjustments in color, background, font etc. as per your unique business setting.
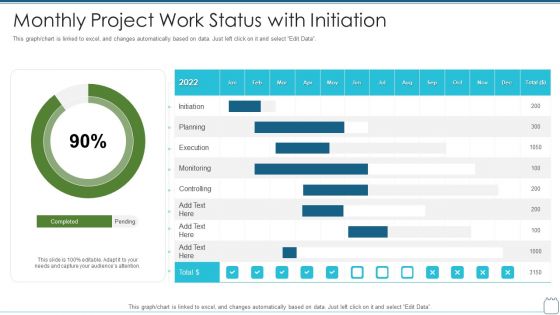
Monthly Project Work Status With Initiation Graphics PDF
This graph chart is linked to excel, and changes automatically based on data. Just left click on it and select Edit Data Showcasing this set of slides titled monthly project work status with initiation graphics pdf . The topics addressed in these templates are monthly project work status with initiation . All the content presented in this PPT design is completely editable. Download it and make adjustments in color, background, font etc. as per your unique business setting.
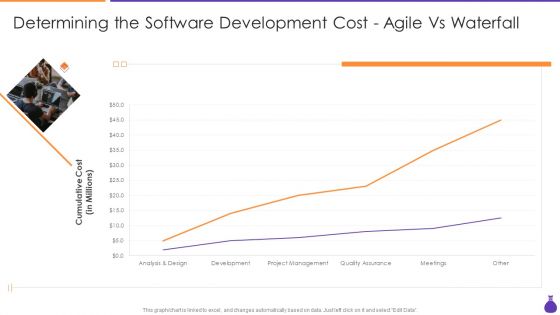
Why Is Agile Cost Effective IT Determining The Software Development Cost Agile Demonstration PDF
This graph or chart is linked to excel, and changes automatically based on data. Just left click on it and select Edit Data. Deliver and pitch your topic in the best possible manner with this Why Is Agile Cost Effective IT Determining The Software Development Cost Agile Demonstration PDF. Use them to share invaluable insights on Analysis And Design, Development, Project Management, Quality Assurance and impress your audience. This template can be altered and modified as per your expectations. So, grab it now.
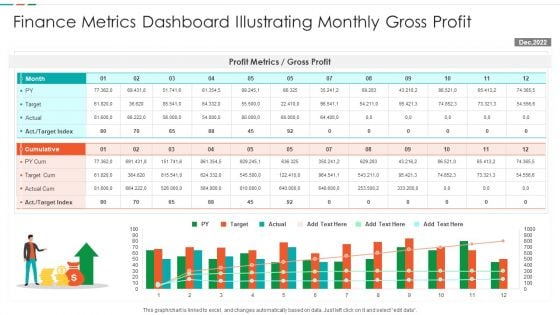
Finance Metrics Dashboard Illustrating Monthly Gross Profit Formats PDF
This graph or chart is linked to excel, and changes automatically based on data. Just left click on it and select edit data. Showcasing this set of slides titled Finance Metrics Dashboard Illustrating Monthly Gross Profit Formats PDF. The topics addressed in these templates are Profit Metrics Gross, Profit Target Cum, Actual Cum Target. All the content presented in this PPT design is completely editable. Download it and make adjustments in color, background, font etc. as per your unique business setting.
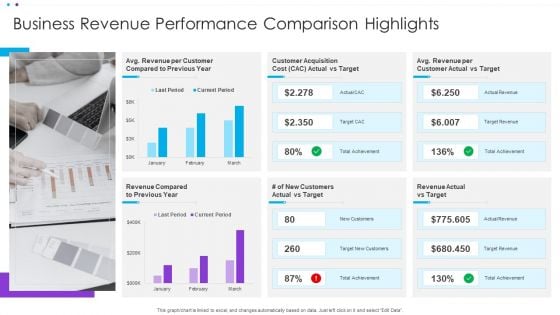
Business Revenue Performance Comparison Highlights Ppt Summary Rules PDF
This graph or chart is linked to excel, and changes automatically based on data. Just left click on it and select Edit Data. Showcasing this set of slides titled Business Revenue Performance Comparison Highlights Ppt Summary Rules PDF. The topics addressed in these templates are Customer Acquisition, Customer Actual, Revenue Compared. All the content presented in this PPT design is completely editable. Download it and make adjustments in color, background, font etc. as per your unique business setting.
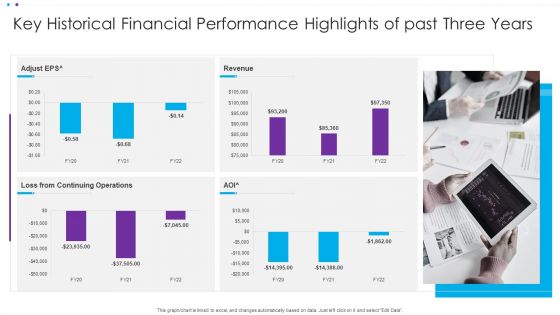
Key Historical Financial Performance Highlights Of Past Three Years Ppt Ideas Background PDF
This graph or chart is linked to excel, and changes automatically based on data. Just left click on it and select Edit Data. Showcasing this set of slides titled Key Historical Financial Performance Highlights Of Past Three Years Ppt Ideas Background PDF. The topics addressed in these templates are Continuing Operations, Adjust EP. All the content presented in this PPT design is completely editable. Download it and make adjustments in color, background, font etc. as per your unique business setting.
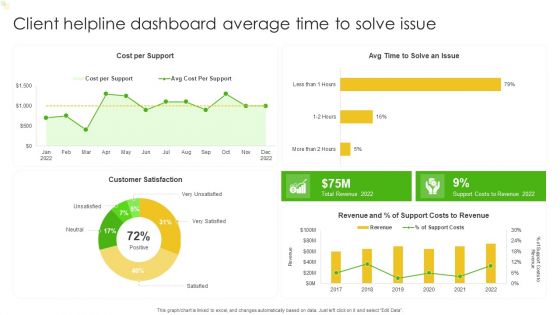
Client Helpline Dashboard Average Time To Solve Issue Ppt Portfolio Visuals PDF
This graph or chart is linked to excel, and changes automatically based on data. Just left click on it and select Edit Data. Showcasing this set of slides titled Client Helpline Dashboard Average Time To Solve Issue Ppt Portfolio Visuals PDF. The topics addressed in these templates are Cost Per Support, Customer Satisfaction, Costs To Revenue. All the content presented in this PPT design is completely editable. Download it and make adjustments in color, background, font etc. as per your unique business setting.
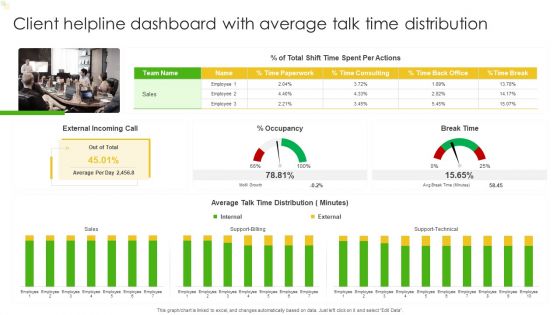
Client Helpline Dashboard With Average Talk Time Distribution Ppt Gallery Backgrounds PDF
This graph or chart is linked to excel, and changes automatically based on data. Just left click on it and select Edit Data. Showcasing this set of slides titled Client Helpline Dashboard With Average Talk Time Distribution Ppt Gallery Backgrounds PDF. The topics addressed in these templates are External Incoming Call, Occupancy, Break Time, Sales. All the content presented in this PPT design is completely editable. Download it and make adjustments in color, background, font etc. as per your unique business setting.
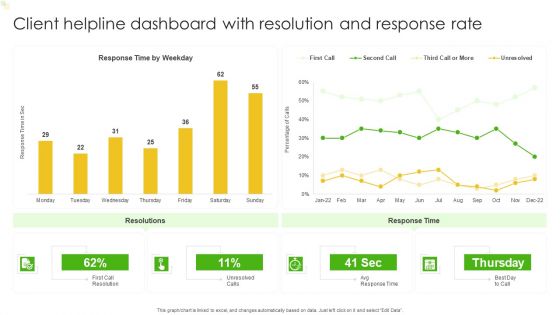
Client Helpline Dashboard With Resolution And Response Rate Ppt File Example Topics PDF
This graph or chart is linked to excel, and changes automatically based on data. Just left click on it and select Edit Data. Showcasing this set of slides titled Client Helpline Dashboard With Resolution And Response Rate Ppt File Example Topics PDF. The topics addressed in these templates are Resolutions, Response Time, Response Time Weekday. All the content presented in this PPT design is completely editable. Download it and make adjustments in color, background, font etc. as per your unique business setting.


 Continue with Email

 Home
Home


