org chart

Enterprise Review Management Organizational Chart Ppt Styles Guide PDF
This is a enterprise review management organizational chart ppt styles guide pdf template with various stages. Focus and dispense information on six stages using this creative set, that comes with editable features. It contains large content boxes to add your information on topics like management organizational chart. You can also showcase facts, figures, and other relevant content using this PPT layout. Grab it now.
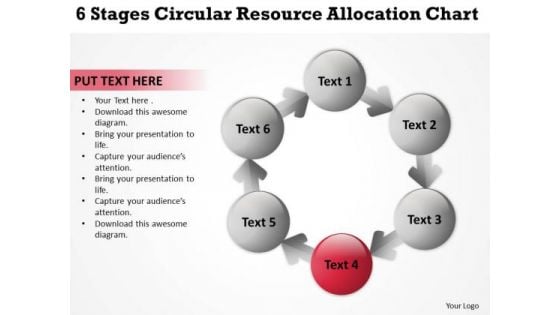
Circular Resource Allocation Chart Template For Business Plan PowerPoint Slides
We present our circular resource allocation chart template for business plan PowerPoint Slides.Present our Arrows PowerPoint Templates because our PowerPoint Templates and Slides are a looking glass. Train them on the magnificent future you have in mind. Present our Circle Charts PowerPoint Templates because It can Bubble and burst with your ideas. Download and present our Process and Flows PowerPoint Templates because You can Score a slam dunk with our PowerPoint Templates and Slides. Watch your audience hang onto your every word. Present our Shapes PowerPoint Templates because It is Aesthetically crafted by artistic young minds. Our PowerPoint Templates and Slides are designed to display your dexterity. Download and present our Marketing PowerPoint Templates because Our PowerPoint Templates and Slides are a sure bet. Gauranteed to win against all odds. Use these PowerPoint slides for presentations relating to Arrow, art, background, bright, bubble, business, button, circle, color, colorful, communication, concept, conceptual, connect,connection, cycle, design, element, financial, graphic, idea, illustration, link, management, model, modern, plan, process, rings, set, shape, sign, six, strategy, style, success, symbol, web, website, white. The prominent colors used in the PowerPoint template are Red, Gray, White. Our Circular Resource Allocation Chart Template For Business Plan PowerPoint Slides are destined to meet your standards. They conform to your exacting demands.
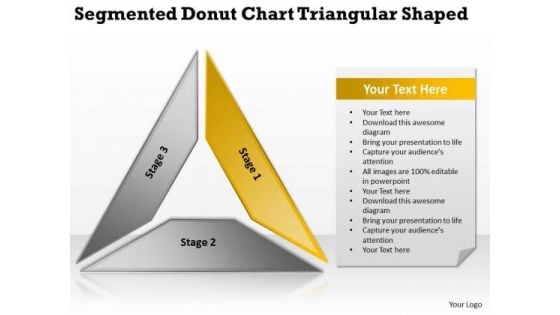
Segmented Donut Chart Triangular Shaped Ppt Business Plan PowerPoint Templates
We present our segmented donut chart triangular shaped ppt business plan PowerPoint templates.Present our Process and Flows PowerPoint Templates because It will mark the footprints of your journey. Illustrate how they will lead you to your desired destination. Download our Flow Charts PowerPoint Templates because Our PowerPoint Templates and Slides are designed to help you succeed. They have all the ingredients you need. Download and present our Triangles PowerPoint Templates because It will mark the footprints of your journey. Illustrate how they will lead you to your desired destination. Download and present our Marketing PowerPoint Templates because You are working at that stage with an air of royalty. Let our PowerPoint Templates and Slides be the jewels in your crown. Use our Future PowerPoint Templates because It can Conjure up grand ideas with our magical PowerPoint Templates and Slides. Leave everyone awestruck by the end of your presentation.Use these PowerPoint slides for presentations relating to Optical, shape, abstract, paradox, motion, symbol, mathematical, illusion, form, perspective, mathematics, liquid, triangle, amazing, flow, geometry,concept, sign, presentation, magic, infinity, bright, psychical, light, impossible, modern, fantasy, creative, geometric, figure, object, trick, futuristic, web,surreal, design, science, trendy, imagination, angle, space, strange, distorted. The prominent colors used in the PowerPoint template are Yellow, Gray, White. Beat the clock with our Segmented Donut Chart Triangular Shaped Ppt Business Plan PowerPoint Templates. They keep you ahead in the race.
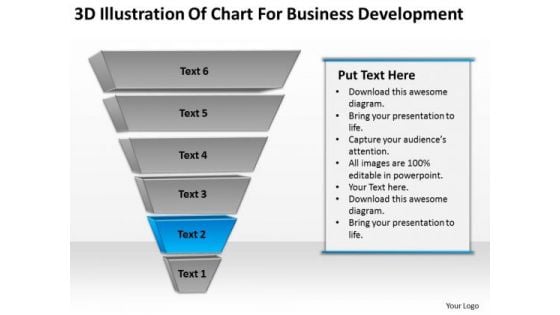
Chart For Business Development Ppt Plan PowerPoint Templates
We present our chart for business development ppt plan PowerPoint templates.Download and present our Process and Flows PowerPoint Templates because Our PowerPoint Templates and Slides will provide you the cutting edge. Slice through the doubts in the minds of your listeners. Present our Business PowerPoint Templates because You can safely bank on our PowerPoint Templates and Slides. They will provide a growth factor to your valuable thoughts. Download and present our Flow Charts PowerPoint Templates because You are well armed with penetrative ideas. Our PowerPoint Templates and Slides will provide the gunpowder you need. Download and present our Marketing PowerPoint Templates because It can Leverage your style with our PowerPoint Templates and Slides. Charm your audience with your ability. Download and present our Shapes PowerPoint Templates because Our PowerPoint Templates and Slides are endowed to endure. Ideas conveyed through them will pass the test of time.Use these PowerPoint slides for presentations relating to Collection, web, info, item, grade, business,, concept, vector, line, visual, presentation, internet, gradation, template, shadow, graphic, clean, element, simple, abstract, multicolored, modern, creative, illustration, backdrop, design, cover, color,, composition, set, banner, stripe, information, background. The prominent colors used in the PowerPoint template are Blue, Gray, Black. Our Chart For Business Development Ppt Plan PowerPoint Templates act like a consultant. They advise on the arrangement of your thoughts.
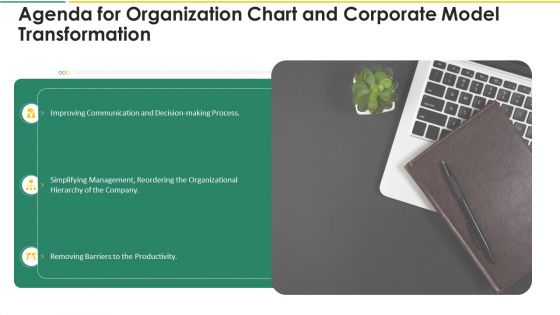
Agenda For Organization Chart And Corporate Model Transformation Background PDF
This is a agenda for organization chart and corporate model transformation background pdf template with various stages. Focus and dispense information on three stages using this creative set, that comes with editable features. It contains large content boxes to add your information on topics like communication, decision making process, organizational hierarchy, management. You can also showcase facts, figures, and other relevant content using this PPT layout. Grab it now.
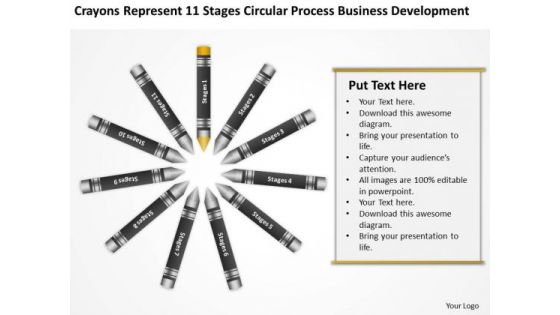
Business Organizational Chart Template Ppt PowerPoint Templates Backgrounds For Slides
We present our business organizational chart template ppt PowerPoint templates backgrounds for slides.Download and present our Communication PowerPoint Templates because Watching this your Audience will Grab their eyeballs, they wont even blink. Present our Finance PowerPoint Templates because Our PowerPoint Templates and Slides will let Your superior ideas hit the target always and everytime. Use our Circle Charts PowerPoint Templates because You are well armed with penetrative ideas. Our PowerPoint Templates and Slides will provide the gunpowder you need. Download our Business PowerPoint Templates because Our PowerPoint Templates and Slides provide you with a vast range of viable options. Select the appropriate ones and just fill in your text. Download our Shapes PowerPoint Templates because Our PowerPoint Templates and Slides will generate and maintain the level of interest you desire. They will create the impression you want to imprint on your audience.Use these PowerPoint slides for presentations relating to pencil, isolated, wallpaper, decoration, vibrant, sketching, row, blank, concept, vector, line, spectrum, bright, template, circle, ring, graphic, pastel, drawing, paint, multicolor, card, assortment, vertical, idea, equipment, multicolored, creative, arrangement, palette, illustration, object, wood, backdrop, design, group, tape, school, pointing, education, draw, art, stripe, wooden, instrument, college, rainbow. The prominent colors used in the PowerPoint template are Yellow, Black, Gray. Set a good example with our Business Organizational Chart Template Ppt PowerPoint Templates Backgrounds For Slides. Be the benchmark for others to follow.
Brand Advertising Strategic Workflow Chart Icon Topics Pdf
Showcasing this set of slides titled Brand Advertising Strategic Workflow Chart Icon Topics PdfA. The topics addressed in these templates are Brand Advertising Strategic, Workflow Chart, Icon. All the content presented in this PPT design is completely editable. Download it and make adjustments in color, background, font etc. as per your unique business setting. Our Brand Advertising Strategic Workflow Chart Icon Topics Pdf are topically designed to provide an attractive backdrop to any subject. Use them to look like a presentation pro.
Digital Lending Process Flow Chart Icon Demonstration Pdf
Showcasing this set of slides titled Digital Lending Process Flow Chart Icon Demonstration Pdf. The topics addressed in these templates are Digital Lending Process, Flow Chart Icon. All the content presented in this PPT design is completely editable. Download it and make adjustments in color, background, font etc. as per your unique business setting. Our Digital Lending Process Flow Chart Icon Demonstration Pdf are topically designed to provide an attractive backdrop to any subject. Use them to look like a presentation pro.
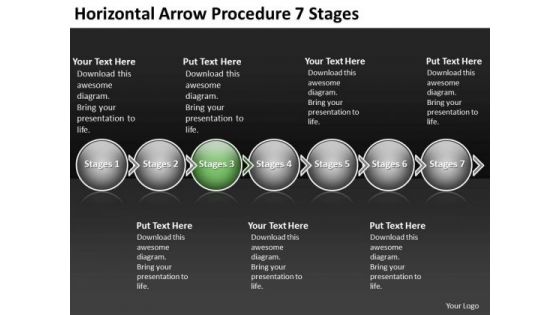
Horizontal Arrow Procedure 7 Stages Flow Chart PowerPoint Slides
We present our horizontal arrow procedure 7 stages flow chart PowerPoint Slides. Use our Leadership PowerPoint Templates because, explore the minutest detail of each concept and follow the trail to its conclusion. Use our Arrows PowerPoint Templates because, the foundation stones of many a life. Use our Circle Charts PowerPoint Templates because, discuss each one and slowly but surely move up the pyramid narrowing down to the best and most success oriented project. Use our Process and Flows PowerPoint Templates because, you know the path so show the way. Use our Shapes PowerPoint Templates because, are truly some of the wonders of our life. Use these PowerPoint slides for presentations relating to Arrow, business, circle, circular, collection, connection, cursor, decoration, design, dimensional, direction, element, icon, illustration, information, modern, motion, perspective, pointing, process, recycle, recycling, reflective, shape, shiny, sign, symbol, technology. The prominent colors used in the PowerPoint template are Green, White, and Gray The people behind our Horizontal Arrow Procedure 7 Stages Flow Chart PowerPoint Slides are an erudite lot. They are known to be very well read.
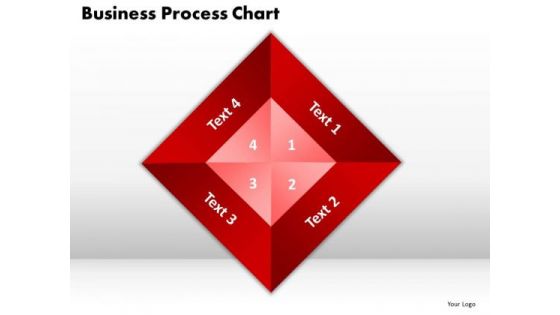
PowerPoint Template Business Process Chart Success Ppt Theme
PowerPoint Template Business Process Chart Success PPT Theme-This PowerPoint Diagram consists of Red Kite of four layers as shown. It portrays the concept of teamwork. These four layers combine to form one unique Design.-PowerPoint Template Business Process Chart Success PPT Theme Institute efficiency with our PowerPoint Template Business Process Chart Success Ppt Theme. Download without worries with our money back guaranteee.

Pie Chart Key Security PowerPoint Templates And PowerPoint Themes 0512
Pie Chart key Security PowerPoint Templates And PowerPoint Themes PPT designs-Microsoft Powerpoint Templates and Background with key in shape of pie chart Create an effective checklist with our Pie Chart Key Security PowerPoint Templates And PowerPoint Themes 0512. Put all the ticks in the right place.

Pie Chart Statistics Success PowerPoint Templates And PowerPoint Themes 0512
Pie Chart Statistics Success PowerPoint Templates And PowerPoint Themes PPT designs-Microsoft Powerpoint Templates and Background with key in shape of pie chart Banish the blues with our Pie Chart Statistics Success PowerPoint Templates And PowerPoint Themes 0512. Your thoughts will bring in the cheer.
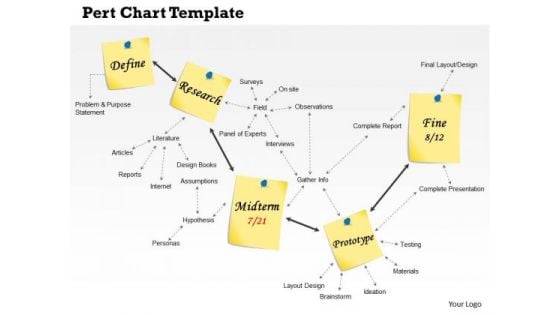
Business Framework Pert Chart Template Diagram PowerPoint Presentation
This business framework image slide displays Pert chart template. Use this image slide to depict PERT chart which is a project management tool used to schedule, organize, and coordinate tasks within a project. This image slide will enhance the quality of your presentations.

Timeline Demonstration Of Funnel Chart Sales Process Diagram 4 Stages
Our Timeline Demonstration Of Funnel Chart Sales Process Diagram 4 Stages offer you the needful to organize your thoughts. Use them to list out your views in a logical sequence. Our Timeline Demonstration Of Funnel Chart Sales Process Diagram 4 Stages are created by a hardworking bunch of busy bees. Always flitting around with solutions guaranteed to please.
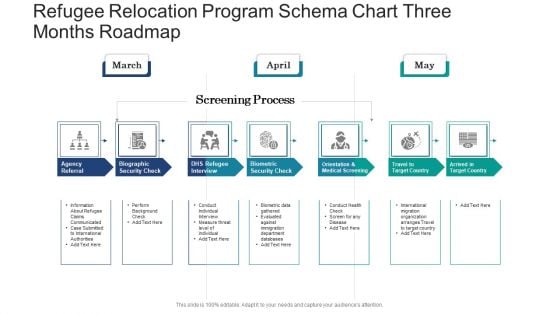
Refugee Relocation Program Schema Chart Three Months Roadmap Mockup
We present our refugee relocation program schema chart three months roadmap mockup. This PowerPoint layout is easy to edit so you can change the font size, font type, color, and shape conveniently. In addition to this, the PowerPoint layout is Google Slides compatible, so you can share it with your audience and give them access to edit it. Therefore, download and save this well researched refugee relocation program schema chart three months roadmap mockup in different formats like PDF, PNG, and JPG to smoothly execute your business plan.
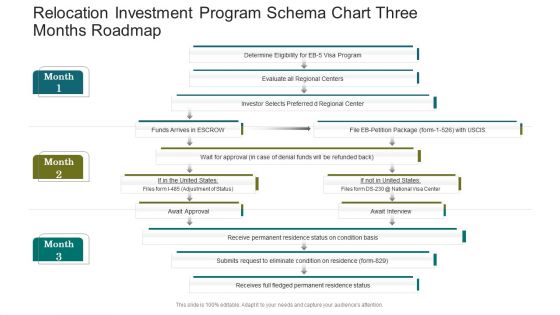
Relocation Investment Program Schema Chart Three Months Roadmap Background
We present our relocation investment program schema chart three months roadmap background. This PowerPoint layout is easy to edit so you can change the font size, font type, color, and shape conveniently. In addition to this, the PowerPoint layout is Google Slides compatible, so you can share it with your audience and give them access to edit it. Therefore, download and save this well researched relocation investment program schema chart three months roadmap background in different formats like PDF, PNG, and JPG to smoothly execute your business plan.
Business Development Process Flow Chart Ppt PowerPoint Presentation Icon Show
This is a business development process flow chart ppt powerpoint presentation icon show. This is a three stage process. The stages in this process are operational excellence, operational plan, operational process.
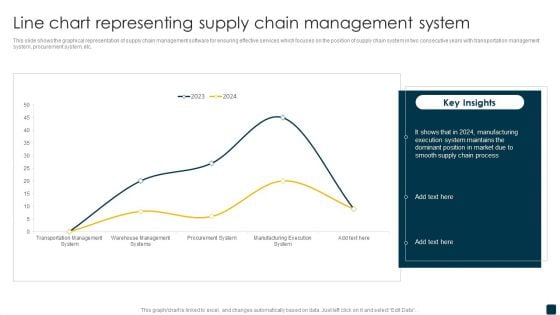
Line Chart Representing Supply Chain Management System Rules PDF
This slide shows the graphical representation of supply chain management software for ensuring effective services which focuses on the position of supply chain system in two consecutive years with transportation management system, procurement system, etc. Pitch your topic with ease and precision using this Line Chart Representing Supply Chain Management System Rules PDF. This layout presents information on Supply Chain Process, Manufacturing, Execution System. It is also available for immediate download and adjustment. So, changes can be made in the color, design, graphics or any other component to create a unique layout.
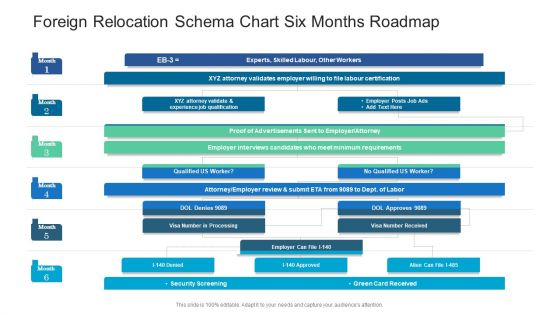
Foreign Relocation Schema Chart Six Months Roadmap Mockup
We present our foreign relocation schema chart six months roadmap mockup. This PowerPoint layout is easy to edit so you can change the font size, font type, color, and shape conveniently. In addition to this, the PowerPoint layout is Google Slides compatible, so you can share it with your audience and give them access to edit it. Therefore, download and save this well researched foreign relocation schema chart six months roadmap mockup in different formats like PDF, PNG, and JPG to smoothly execute your business plan.
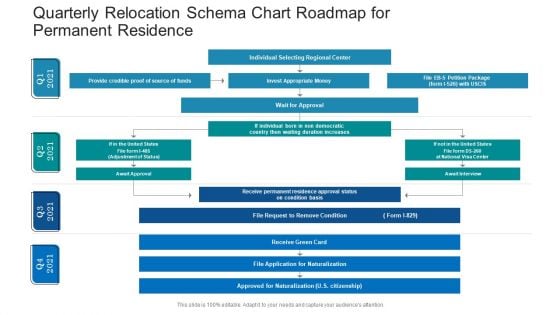
Quarterly Relocation Schema Chart Roadmap For Permanent Residence Clipart
We present our quarterly relocation schema chart roadmap for permanent residence clipart. This PowerPoint layout is easy to edit so you can change the font size, font type, color, and shape conveniently. In addition to this, the PowerPoint layout is Google Slides compatible, so you can share it with your audience and give them access to edit it. Therefore, download and save this well researched quarterly relocation schema chart roadmap for permanent residence clipart in different formats like PDF, PNG, and JPG to smoothly execute your business plan.
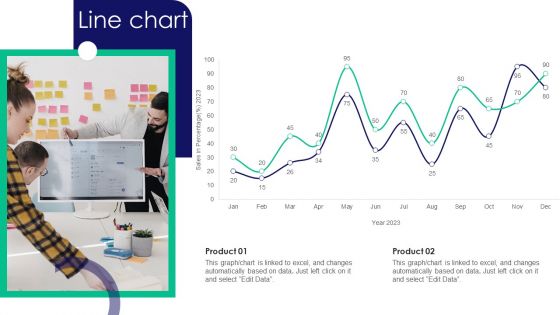
Guide To Business Customer Acquisition Line Chart Infographics PDF
Coming up with a presentation necessitates that the majority of the effort goes into the content and the message you intend to convey. The visuals of a PowerPoint presentation can only be effective if it supplements and supports the story that is being told. Keeping this in mind our experts created Guide To Business Customer Acquisition Line Chart Infographics PDF to reduce the time that goes into designing the presentation. This way, you can concentrate on the message while our designers take care of providing you with the right template for the situation.
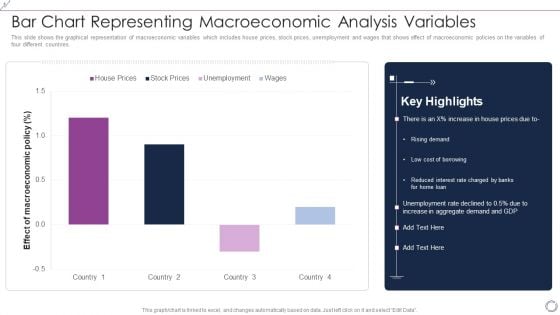
Bar Chart Representing Macroeconomic Analysis Variables Background PDF
This slide shows the graphical representation of macroeconomic variables which includes house prices, stock prices, unemployment and wages that shows effect of macroeconomic policies on the variables of four different countries. Showcasing this set of slides titled Bar Chart Representing Macroeconomic Analysis Variables Background PDF. The topics addressed in these templates are House Prices, Stock Prices, Unemployment, Wages. All the content presented in this PPT design is completely editable. Download it and make adjustments in color, background, font etc. as per your unique business setting.
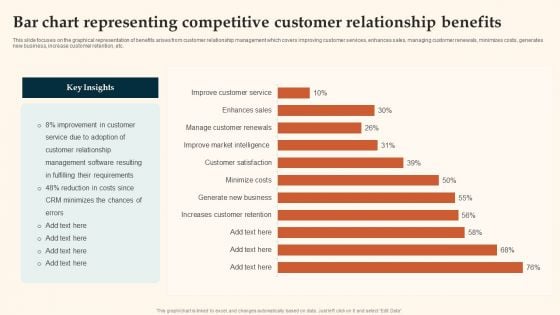
Bar Chart Representing Competitive Customer Relationship Benefits Demonstration PDF
This slide focuses on the graphical representation of benefits arises from customer relationship management which covers improving customer services, enhances sales, managing customer renewals, minimizes costs, generates new business, increase customer retention, etc. Showcasing this set of slides titled Bar Chart Representing Competitive Customer Relationship Benefits Demonstration PDF. The topics addressed in these templates are Management Software, Customer Relationship, Costs Since. All the content presented in this PPT design is completely editable. Download it and make adjustments in color, background, font etc. as per your unique business setting.
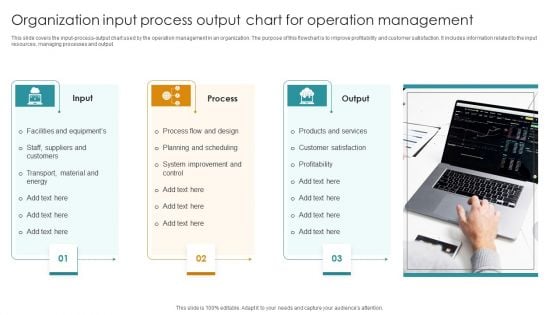
Organization Input Process Output Chart For Operation Management Designs PDF
This slide covers the input-process-output chart used by the operation management in an organization. The purpose of this flowchart is to improve profitability and customer satisfaction. It includes information related to the input resources, managing processes and output. Presenting Organization Input Process Output Chart For Operation Management Designs PDF to dispense important information. This template comprises Three stages. It also presents valuable insights into the topics including Process Flow And Design, Products And Services Transport, Material And Energy. This is a completely customizable PowerPoint theme that can be put to use immediately. So, download it and address the topic impactfully.
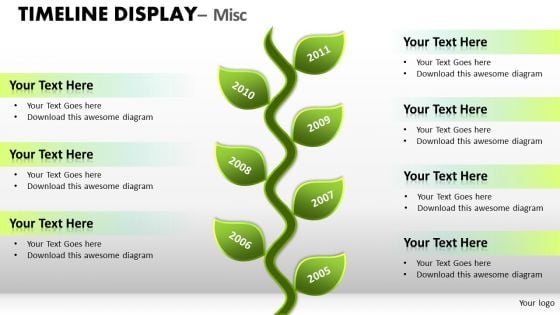
Growth Timeline Chart PowerPoint Slides And Time Ppt Templates
Growth Timeline Chart PowerPoint Slides and Time PPT TemplatesThese high quality powerpoint pre-designed slides and powerpoint templates have been carefully created by our professional team to help you impress your audience. All slides have been created and are 100% editable in powerpoint. Each and every property of any graphic - color, size, orientation, shading, outline etc. can be modified to help you build an effective powerpoint presentation. Any text can be entered at any point in the powerpoint template or slide. Simply DOWNLOAD, TYPE and PRESENT! Our Growth Timeline Chart PowerPoint Slides And Time Ppt Templates make many a feat feasible. They ease out all difficulties.
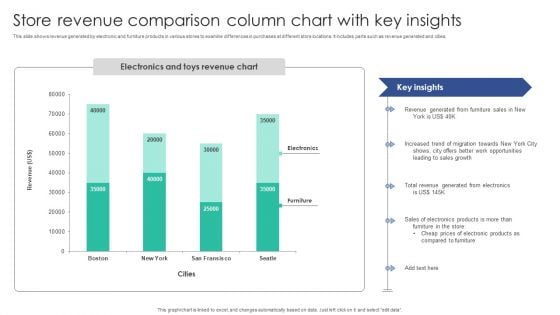
Store Revenue Comparison Column Chart With Key Insights Themes PDF
This slide shows revenue generated by electronic and furniture products in various stores to examine differences in purchases at different store locations. It includes parts such as revenue generated and cities. Showcasing this set of slides titled Store Revenue Comparison Column Chart With Key Insights Themes PDF. The topics addressed in these templates are Revenue Generated, Furniture Sales, Increased Trend. All the content presented in this PPT design is completely editable. Download it and make adjustments in color, background, font etc. as per your unique business setting.
Target Vs Accomplishment Evaluation Chart Of Sales Representatives Icons PDF
This slide showcases sales targets and achievements of sales presentative which helps track employee efficiency. It provides information regarding set targets for sales representatives which strategies and success factors. Showcasing this set of slides titled Target Vs Accomplishment Evaluation Chart Of Sales Representatives Icons PDF. The topics addressed in these templates are Effective Communication, Manage Sales Targets, Set Activity Goals. All the content presented in this PPT design is completely editable. Download it and make adjustments in color, background, font etc. as per your unique business setting.
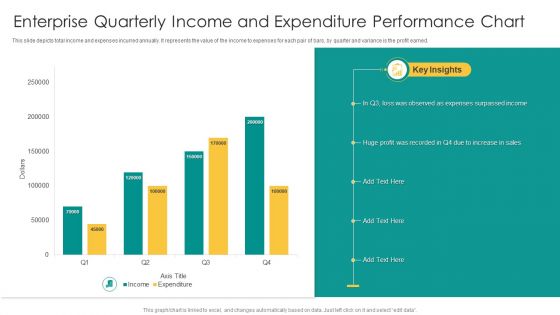
Enterprise Quarterly Income And Expenditure Performance Chart Graphics PDF
This slide depicts total income and expenses incurred annually. It represents the value of the income to expenses for each pair of bars, by quarter and variance is the profit earned. Pitch your topic with ease and precision using this Enterprise Quarterly Income And Expenditure Performance Chart Graphics PDF. This layout presents information on Expenses Surpassed Income, Sales, Huge Profit. It is also available for immediate download and adjustment. So, changes can be made in the color, design, graphics or any other component to create a unique layout.
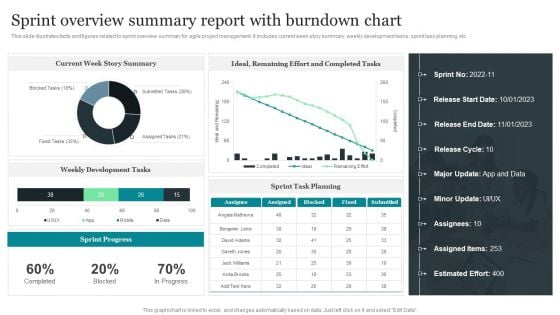
Sprint Overview Summary Report With Burndown Chart Rules PDF
This slide illustrates facts and figures related to sprint overview summary for agile project management. It includes current week story summary, weekly development tasks, sprint task planning, etc. Showcasing this set of slides titled Sprint Overview Summary Report With Burndown Chart Rules PDF. The topics addressed in these templates are Current Week Story Summary, Weekly Development Tasks, Sprint Task Planning. All the content presented in this PPT design is completely editable. Download it and make adjustments in color, background, font etc. as per your unique business setting.
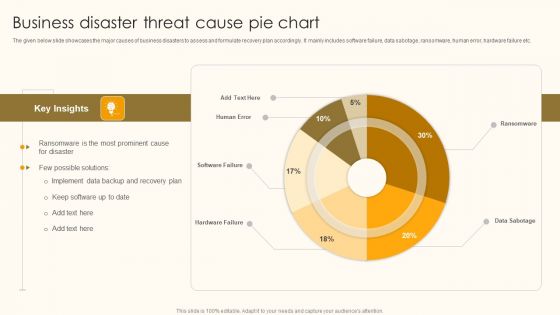
Business Disaster Threat Cause Pie Chart Ppt Pictures Gallery PDF
The given below slide showcases the major causes of business disasters to assess and formulate recovery plan accordingly. It mainly includes software failure, data sabotage, ransomware, human error, hardware failure etc. Showcasing this set of slides titled Business Disaster Threat Cause Pie Chart Ppt Pictures Gallery PDF. The topics addressed in these templates are Key Insights, Few Possible Solutions, Implement Data Backup. All the content presented in this PPT design is completely editable. Download it and make adjustments in color, background, font etc. as per your unique business setting.
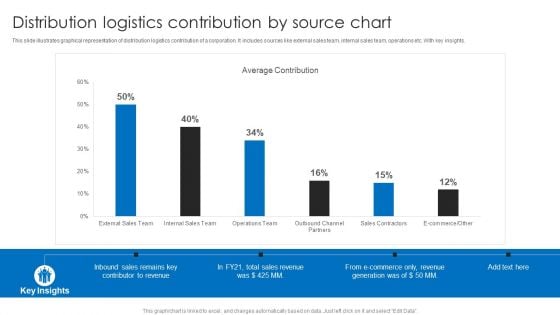
Distribution Logistics Contribution By Source Chart Ppt Model Guidelines PDF
This slide illustrates graphical representation of distribution logistics contribution of a corporation. It includes sources like external sales team, internal sales team, operations etc. With key insights. Showcasing this set of slides titled Distribution Logistics Contribution By Source Chart Ppt Model Guidelines PDF. The topics addressed in these templates are Average Contribution, Total Sales Revenue, E Commerce. All the content presented in this PPT design is completely editable. Download it and make adjustments in color, background, font etc. as per your unique business setting.
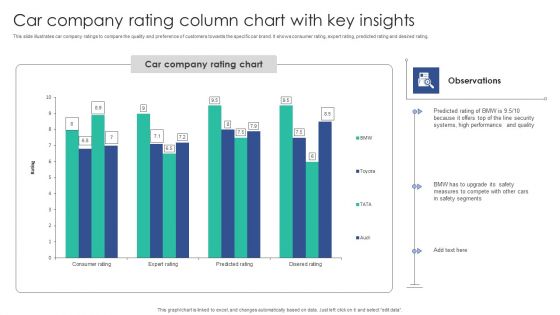
Car Company Rating Column Chart With Key Insights Structure PDF
This slide illustrates car company ratings to compare the quality and preference of customers towards the specific car brand. It shows consumer rating, expert rating, predicted rating and desired rating.Showcasing this set of slides titled Car Company Rating Column Chart With Key Insights Structure PDF. The topics addressed in these templates are Performance Quality, Top Security, Predicted Rating. All the content presented in this PPT design is completely editable. Download it and make adjustments in color, background, font etc. as per your unique business setting.
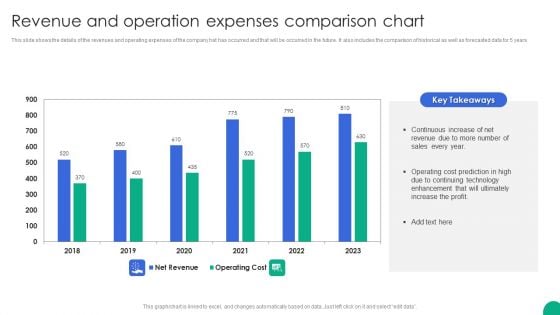
Revenue And Operation Expenses Comparison Chart Slides PDF
This slide shows the details of the revenues and operating expenses of the company hat has occurred and that will be occurred in the future. It also includes the comparison of historical as well as forecasted data for 5 years.Showcasing this set of slides titled Revenue And Operation Expenses Comparison Chart Slides PDF. The topics addressed in these templates are Continuous Increase, Operating Cost, Enhancement Ultimately. All the content presented in this PPT design is completely editable. Download it and make adjustments in color, background, font etc. as per your unique business setting.
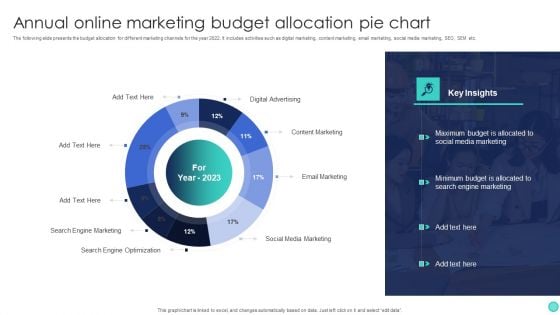
Annual Online Marketing Budget Allocation Pie Chart Pictures PDF
The following slide presents the budget allocation for different marketing channels for the year 2022. It includes activities such as digital marketing, content marketing, email marketing, social media marketing, SEO, SEM etc. Showcasing this set of slides titled Annual Online Marketing Budget Allocation Pie Chart Pictures PDF. The topics addressed in these templates are Digital Advertising, Content Marketing, Email Marketing, Social Media Marketing, Search Engine Optimization. All the content presented in this PPT design is completely editable. Download it and make adjustments in color, background, font etc. as per your unique business setting.
Outcomes Summary Of Company Revenues Using Pie Chart Icons PDF
This slide focuses on graphical representation of revenues earned by company which includes media such as print advertising, electronic-media, events, paid subscriptions , custom publishing, etc.Pitch your topic with ease and precision using this Outcomes Summary Of Company Revenues Using Pie Chart Icons PDF This layout presents information on Custom Publishing, Paid Subscriptions, Revenues Are Generated It is also available for immediate download and adjustment. So, changes can be made in the color, design, graphics or any other component to create a unique layout.
Six Months Business Valuation Chart Ppt Styles Icons PDF
This slide shows the 6 months graph to measure company valuation. It is representing that highest valuation of company was calculated in the month of June due to increase in sales. Pitch your topic with ease and precision using this Six Months Business Valuation Chart Ppt Styles Icons PDF. This layout presents information on Increase Sales, Company Valuation. It is also available for immediate download and adjustment. So, changes can be made in the color, design, graphics or any other component to create a unique layout.
Product Marketing And Promotional Budget Spends Pie Chart Icons PDF
This slide covers marketing expenditures from budget allotted. It includes percentages for online advertising, sales training, conventions, trade shows, print advertising, publications, radio advertisements, magazines, catalogues and brochures. Pitch your topic with ease and precision using this Product Marketing And Promotional Budget Spends Pie Chart Icons PDF. This layout presents information on Conventions Were Maximum, Drive Maximum, Profit And Sales. It is also available for immediate download and adjustment. So, changes can be made in the color, design, graphics or any other component to create a unique layout.
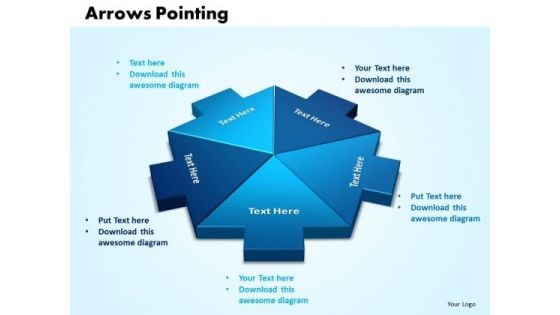
Business Company PowerPoint Templates Arrows Pointing Inwards Chart Ppt Slides
Business Company PowerPoint Templates arrows pointing inwards chart PPT Slides-Use this arrow pointing inward chart to determine your targets and sequence them as per your priorities. Unravel each one for your audience while setting key timelines as you go along-Business Company PowerPoint Templates arrows pointing inwards chart PPT Slides-This ppt can be used for concepts relating to-3d, Accounting, Arrow, Chart, Corporate, Data, Design, Diagram, Element, Graphic, Icon, Illustration etc. Our Business Company PowerPoint Templates Arrows Pointing Inwards Chart Ppt Slides are not a figment of imagination. They actually help in day to day aspects.
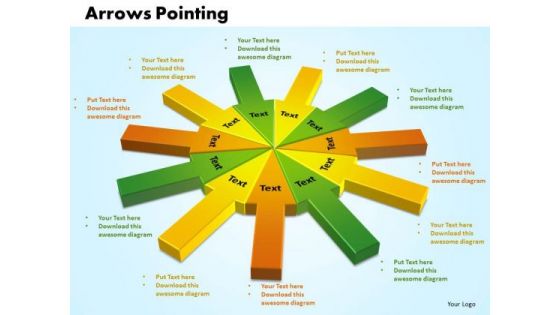
Business PowerPoint Templates Business Arrows Pointing Inwards Chart Ppt Slides
Business PowerPoint Templates Business Arrows pointing inwards chart PPT Slides-Use this arrow pointing inward chart to determine your targets and sequence them as per your priorities. Unravel each one for your audience while setting key timelines as you go along. -Business PowerPoint Templates Business Arrows pointing inwards chart PPT Slides-This ppt can be used for concepts relating to-3d, Accounting, Arrow, Blue, Button, Chart, Corporate, Crystal, Data, Design, Diagram, Element, Glass, Glowing, Graphic, Green, Icon, Illustration, Internet, Investment Etc Our Business PowerPoint Templates Business Arrows Pointing Inwards Chart Ppt Slides maintain equilibrium. Give your thoughts that balanced look.
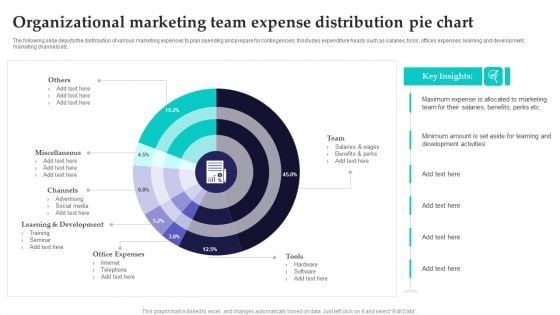
Organizational Marketing Team Expense Distribution Pie Chart Infographics PDF
The following slide depicts the distribution of various marketing expenses to plan spending and prepare for contingencies. It includes expenditure heads such as salaries, tools, offices expenses, learning and development, marketing channels etc. Pitch your topic with ease and precision using this Organizational Marketing Team Expense Distribution Pie Chart Infographics PDF. This layout presents information on Development, Office Expenses, Internet. It is also available for immediate download and adjustment. So, changes can be made in the color, design, graphics or any other component to create a unique layout.
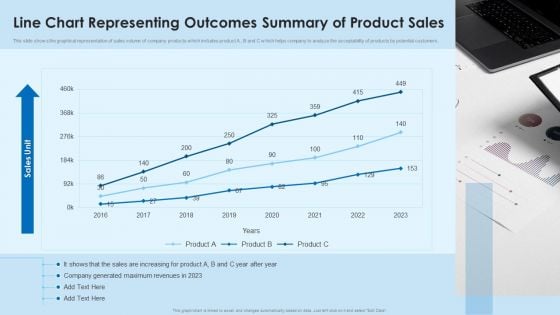
Line Chart Representing Outcomes Summary Of Product Sales Mockup PDF
This slide shows the graphical representation of sales volume of company products which includes product A , B and C which helps company to analyze the acceptability of products by potential customers.Pitch your topic with ease and precision using this Line Chart Representing Outcomes Summary Of Product Sales Mockup PDF This layout presents information on Company Generated, Maximum Revenues, Increasing For Product It is also available for immediate download and adjustment. So, changes can be made in the color, design, graphics or any other component to create a unique layout.
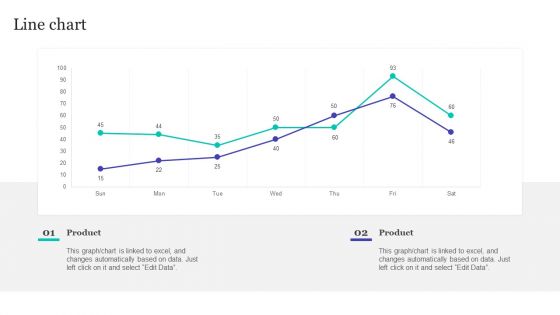
Strategic Brand Refreshing Actions Line Chart Information PDF
This Strategic Brand Refreshing Actions Line Chart Information PDF from Slidegeeks makes it easy to present information on your topic with precision. It provides customization options, so you can make changes to the colors, design, graphics, or any other component to create a unique layout. It is also available for immediate download, so you can begin using it right away. Slidegeeks has done good research to ensure that you have everything you need to make your presentation stand out. Make a name out there for a brilliant performance.
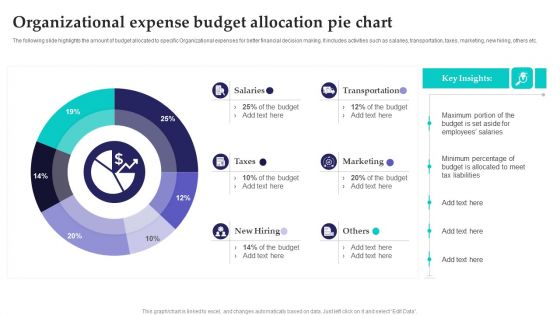
Organizational Expense Budget Allocation Pie Chart Inspiration PDF
The following slide highlights the amount of budget allocated to specific Organizational expenses for better financial decision making. It includes activities such as salaries, transportation, taxes, marketing, new hiring, others etc. Pitch your topic with ease and precision using this Organizational Expense Budget Allocation Pie Chart Inspiration PDF. This layout presents information on Transportation, Marketing, Budget. It is also available for immediate download and adjustment. So, changes can be made in the color, design, graphics or any other component to create a unique layout.
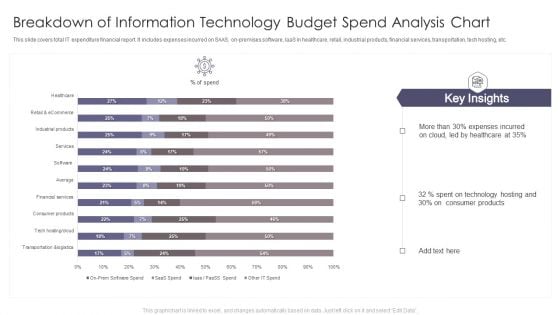
Breakdown Of Information Technology Budget Spend Analysis Chart Download PDF
This slide covers total IT expenditure financial report. It includes expenses incurred on SAAS, on-premises software, laaS in healthcare, retail, industrial products, financial services, transportation, tech hosting, etc. Pitch your topic with ease and precision using this Breakdown Of Information Technology Budget Spend Analysis Chart Download PDF. This layout presents information on Expenses Incurred, Technology Hosting, Consumer Products. It is also available for immediate download and adjustment. So, changes can be made in the color, design, graphics or any other component to create a unique layout.
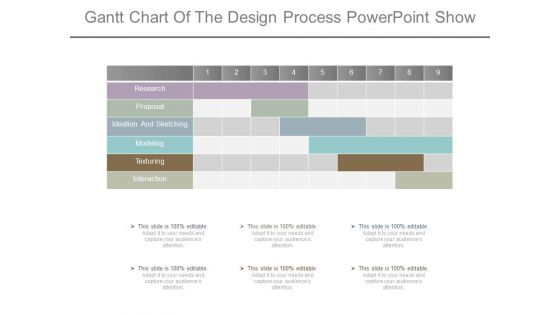
Gantt Chart Of The Design Process Powerpoint Show
This is a gantt chart of the design process powerpoint show. This is a one stage process. The stages in this process are research, proposal, ideation and sketching, modeling, texturing, interaction.
Management Organizational Chart Ppt PowerPoint Presentation Icon Background Images
This is a management organizational chart ppt powerpoint presentation icon background images. This is a three stage process. The stages in this process are marketing communication manager, marketing director, employee, bill durbin, robert fowler.
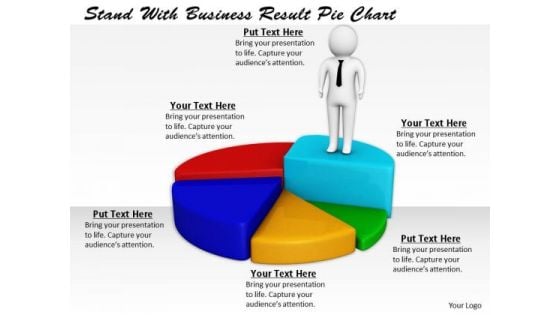
Business Strategy Execution Stand With Result Pie Chart Basic Concepts
Double The Impact With Our business strategy execution stand with result pie chart basic concepts Powerpoint Templates. Your Thoughts Will Have An Imposing Effect.
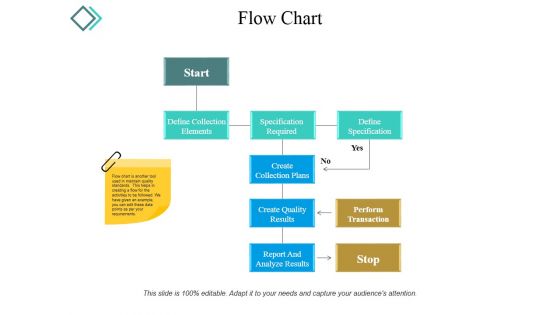
Flow Chart Ppt PowerPoint Presentation Styles Example Topics
This is a flow chart ppt powerpoint presentation styles example topics. This is a nine stage process. The stages in this process are start, create collection plans, define specification, specification required.
Flow Chart Ppt PowerPoint Presentation File Infographic Template
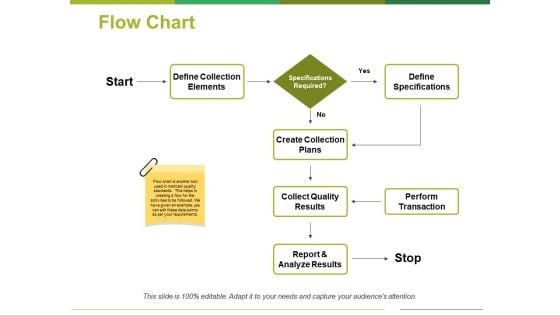
This is a flow chart ppt powerpoint presentation file infographic template. This is a seven stage process. The stages in this process are start, define specifications, perform transaction, create collection plans, report and analyze results.
Flow Chart Ppt PowerPoint Presentation File Layout Ideas
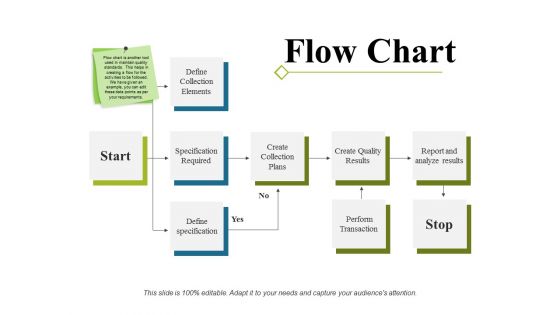
This is a flow chart ppt powerpoint presentation file layout ideas. This is a four stage process. The stages in this process are define collection elements, specification required, define specification, create collection plans, create quality results, perform transaction.
Departments And Teams Organizational Chart Sample Ppt Files
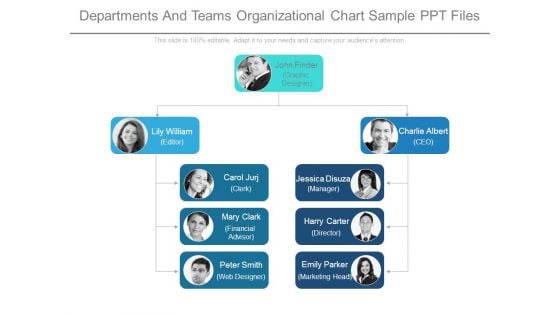
This is a departments and teams organizational chart sample ppt files. This is a three stage process. The stages in this process are john finder graphic designer, lily william editor, charlie albert ceo, carol jurj clerk, jessica disuza manager, mary clark financial advisor, harry carter director, peter smith web designer, emily parker marketing head.
Area Chart Contribution Ppt PowerPoint Presentation Gallery Structure
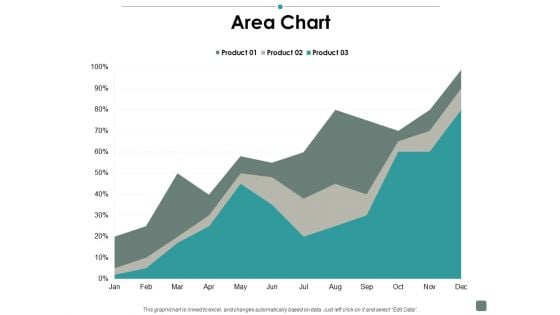
This is a area chart contribution ppt powerpoint presentation gallery structure. This is a three stage process. The stages in this process are business, management, strategy, analysis, marketing.
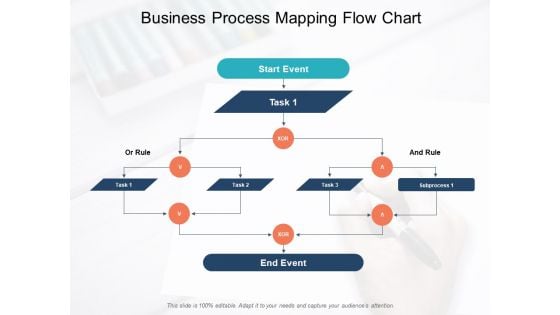
Business Process Mapping Flow Chart Ppt PowerPoint Presentation Professional Templates
This is a business process mapping flow chart ppt powerpoint presentation professional templates. This is a three stage process. The stages in this process are process management, end to end process, e2e process.
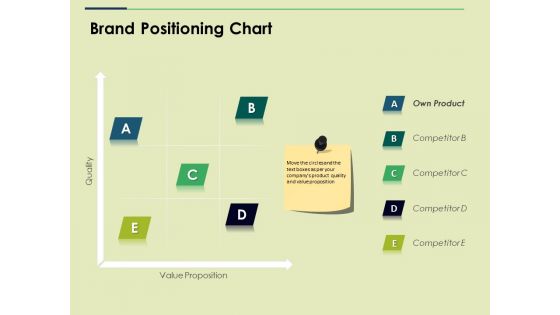
Brand Positioning Chart Ppt PowerPoint Presentation Show Example File
This is a brand positioning chart ppt powerpoint presentation show example file. This is a five stage process. The stages in this process are own product, business, marketing, strategy, analysis.
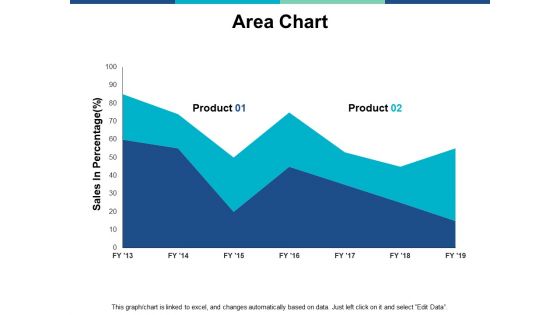
Area Chart Finance Ppt PowerPoint Presentation Summary Structure
This is a area chart finance ppt powerpoint presentation summary structure. This is a two stage process. The stages in this process are finance, marketing, management, investment, analysis.
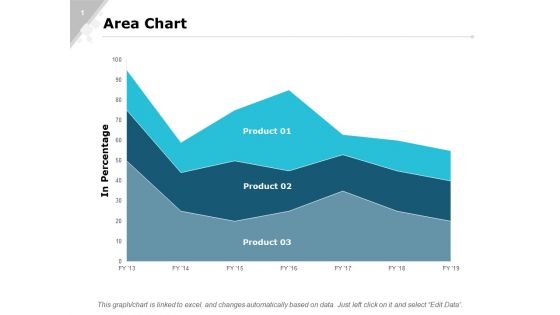
Area Chart Finance Ppt PowerPoint Presentation Outline Structure
This is a area chart finance ppt powerpoint presentation outline structure. This is a three stage process. The stages in this process are finance, marketing, analysis, investment, million.
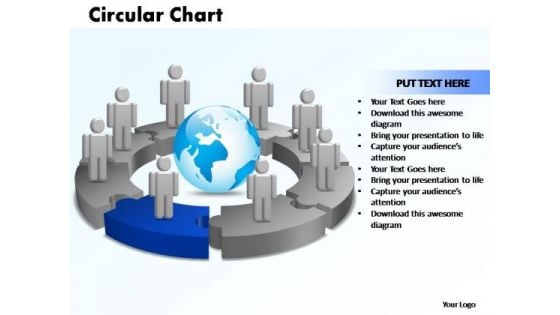
PowerPoint Designs Circular Chart With Globe Ppt Design
PowerPoint Designs Circular Chart With Globe PPT Design-The Circle of Life - a concept emmbedded in our minds and hence easy to comprehend. Life and Business is made up of processes comprising stages that flow from one to another. An excellent graphic to attract the attention of and understanding by your audience to improve earnings.-PowerPoint Designs Circular Chart With Globe PPT Design List your core competencies with our PowerPoint Designs Circular Chart With Globe Ppt Design. They will make you look good.
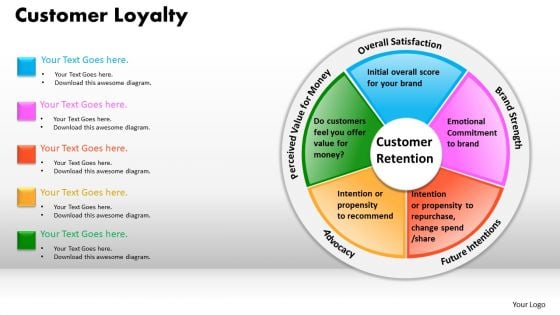
Editable Ppt Slides Circle Pie Chart Diagram PowerPoint Templates
Editable_PPT_Slides_Circle_Pie_Chart_Diagram_PowerPoint_templates-These high quality powerpoint pre-designed slides and powerpoint templates have been carefully created by our professional team to help you impress your audience. All slides have been created and are 100% editable in powerpoint. Each and every property of any graphic - color, size, orientation, shading, outline etc. can be modified to help you build an effective powerpoint presentation. Any text can be entered at any point in the powerpoint template or slide. Simply DOWNLOAD, TYPE and PRESENT! These PowerPoint presentation slides can be used to represent themes relating to - Your address will be the feature. Our Editable Ppt Slides Circle Pie Chart Diagram PowerPoint Templates will ensure the cheers.
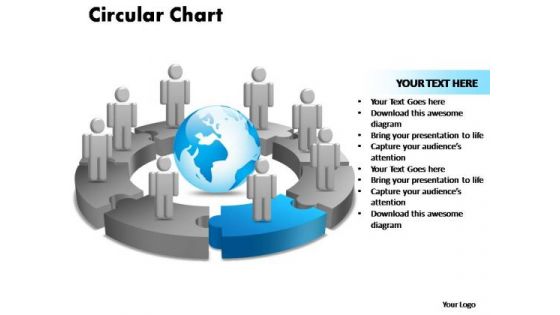
PowerPoint Designs Circular Chart With Globe Ppt Designs
PowerPoint Designs Circular Chart With Globe PPT Designs-The Circle of Life - a concept emmbedded in our minds and hence easy to comprehend. Life and Business is made up of processes comprising stages that flow from one to another. An excellent graphic to attract the attention of and understanding by your audience to improve earnings.-PowerPoint Designs Circular Chart With Globe PPT Designs Cater for the fallout from any mishap. Create an actionable plan with our PowerPoint Designs Circular Chart With Globe Ppt Designs.
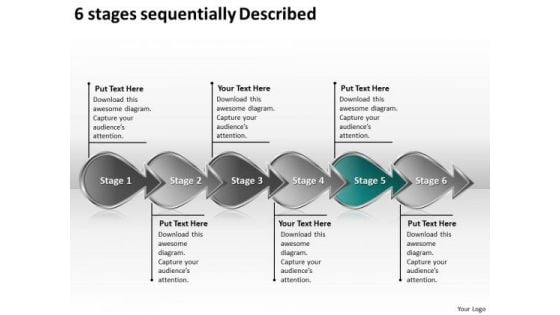
6 Stages Sequentially Described Strategic Planning Flow Chart PowerPoint Slides
We present our 6 stages sequentially described strategic planning flow chart PowerPoint Slides.Download and present our Arrows PowerPoint Templates because you can Refine them all as you take them through the numerous filtering stages of the funnel of your quality control process. Use our Business PowerPoint Templates because project your ideas to you colleagues and complete the full picture. Use our Competition PowerPoint Templates because it shows various choices to be made. Present our Design PowerPoint Templates because Our PowerPoint Templates and Slides will Embellish your thoughts. They will help you illustrate the brilliance of your ideas. Use our Shapes PowerPoint Templates because Our PowerPoint Templates and Slides offer you the needful to organise your thoughts. Use them to list out your views in a logical sequence.Use these PowerPoint slides for presentations relating to arrow, arrows, block, business, chart, design, development, diagram, direction, element, flow, flowchart, graph, linear, management, organization, process, program, section, sign, solution, symbol. The prominent colors used in the PowerPoint template are Green, Gray, Black. Professionals tell us our 6 stages sequentially described strategic planning flow chart PowerPoint Slides are Romantic. The feedback we get is that our business PowerPoint templates and PPT Slides are Festive. We assure you our 6 stages sequentially described strategic planning flow chart PowerPoint Slides are Attractive. Customers tell us our chart PowerPoint templates and PPT Slides will make you look like a winner. Presenters tell us our 6 stages sequentially described strategic planning flow chart PowerPoint Slides are Fun. People tell us our business PowerPoint templates and PPT Slides are topically designed to provide an attractive backdrop to any subject. Go aerial with our 6 Stages Sequentially Described Strategic Planning Flow Chart PowerPoint Slides. Give them a bird's eye view of the conditions.


 Continue with Email

 Home
Home


