stars
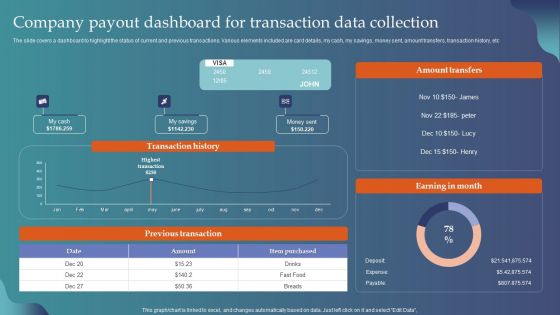
Company Payout Dashboard For Transaction Data Collection Themes PDF
The slide covers a dashboard to highlight the status of current and previous transactions. Various elements included are card details, my cash, my savings, money sent, amount transfers, transaction history, etc. Pitch your topic with ease and precision using this Company Payout Dashboard For Transaction Data Collection Themes PDF. This layout presents information on Amount Transfers, Earning Month, Previous Transaction. It is also available for immediate download and adjustment. So, changes can be made in the color, design, graphics or any other component to create a unique layout.
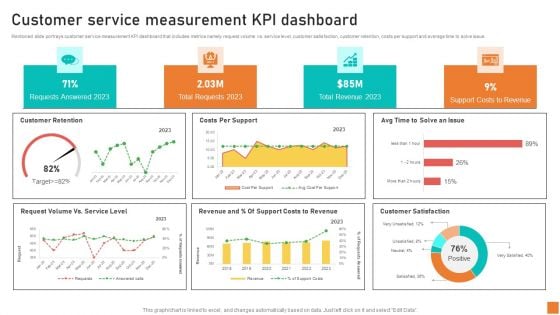
Customer Service Measurement KPI Dashboard Ppt Infographics Themes PDF
Mentioned slide portrays customer service measurement KPI dashboard that includes metrics namely request volume vs. service level, customer satisfaction, customer retention, costs per support and average time to solve issue. If your project calls for a presentation, then Slidegeeks is your go-to partner because we have professionally designed, easy-to-edit templates that are perfect for any presentation. After downloading, you can easily edit Customer Service Measurement KPI Dashboard Ppt Infographics Themes PDF and make the changes accordingly. You can rearrange slides or fill them with different images. Check out all the handy templates
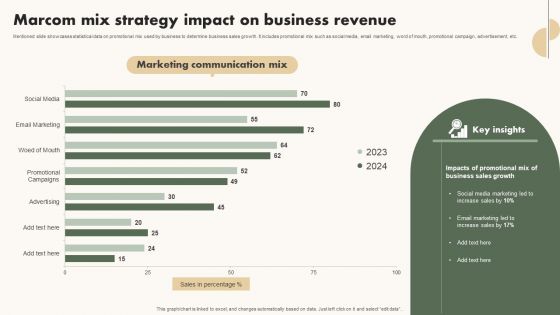
Marcom Mix Strategy Impact On Business Revenue Themes PDF
Mentioned slide showcases statistical data on promotional mix used by business to determine business sales growth. It includes promotional mix such as social media, email marketing, word of mouth, promotional campaign, advertisement, etc. Showcasing this set of slides titled Marcom Mix Strategy Impact On Business Revenue Themes PDF. The topics addressed in these templates are Social Media Marketing Led, Increase Sales, Email Marketing Led. All the content presented in this PPT design is completely editable. Download it and make adjustments in color, background, font etc. as per your unique business setting.
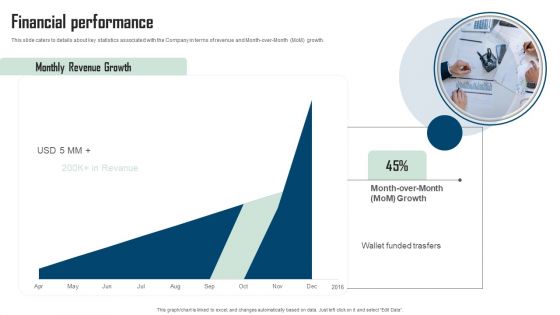
Remitbee Venture Capital Elevator Pitch Deck Financial Performance Themes PDF
This slide caters to details about key statistics associated with the Company in terms of revenue and Month over Month MoM growth. Make sure to capture your audiences attention in your business displays with our gratis customizable Remitbee Venture Capital Elevator Pitch Deck Financial Performance Themes PDF. These are great for business strategies, office conferences, capital raising or task suggestions. If you desire to acquire more customers for your tech business and ensure they stay satisfied, create your own sales presentation with these plain slides.
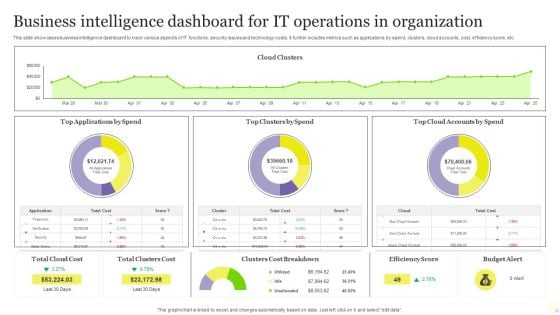
Business Intelligence Dashboard For It Operations In Organization Themes PDF
This slide showcases business intelligence dashboard to track various aspects of IT functions, security issues and technology costs. It further includes metrics such as applications by spend, clusters, cloud accounts, cost, efficiency score, etc. Showcasing this set of slides titled Business Intelligence Dashboard For It Operations In Organization Themes PDF. The topics addressed in these templates are Business Intelligence Dashboard, IT Operations, Organization. All the content presented in this PPT design is completely editable. Download it and make adjustments in color, background, font etc. as per your unique business setting.
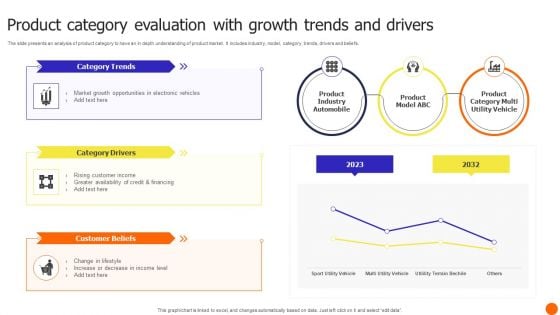
Product Category Evaluation With Growth Trends And Drivers Themes PDF
The slide presents an analysis of product category to have an in depth understanding of product market. It includes industry, model, category, trends, drivers and beliefs. Pitch your topic with ease and precision using this Product Category Evaluation With Growth Trends And Drivers Themes PDF. This layout presents information on Product Industry Automobile, Customer Beliefs, Category Drivers. It is also available for immediate download and adjustment. So, changes can be made in the color, design, graphics or any other component to create a unique layout.
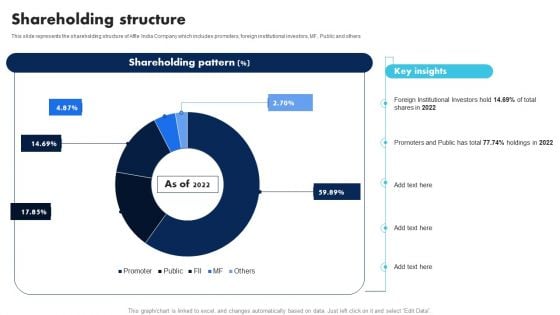
Information Technology Solutions Company Outline Shareholding Structure Themes PDF
This slide represents the shareholding structure of Affle India Company which includes promoters, foreign institutional investors, MF, Public and others Welcome to our selection of the Information Technology Solutions Company Outline Shareholding Structure Themes PDF. These are designed to help you showcase your creativity and bring your sphere to life. Planning and Innovation are essential for any business that is just starting out. This collection contains the designs that you need for your everyday presentations. All of our PowerPoints are 100 percent editable, so you can customize them to suit your needs. This multi purpose template can be used in various situations. Grab these presentation templates today.
Dashboard For Tracking Green Financing Activities Themes PDF
This slide presents a finance dashboard to track the progress of sustainability activities based on finance allocations. The key performing indicators are overall progress, energy usage by month, budget allocation and application etc. Showcasing this set of slides titled Dashboard For Tracking Green Financing Activities Themes PDF. The topics addressed in these templates are Activities, Application, Dashboard. All the content presented in this PPT design is completely editable. Download it and make adjustments in color, background, font etc. as per your unique business setting.

Emerging Investment Opportunities In Green Financing Themes PDF
This slide brings forth the emerging investment opportunities for financial brands to shift their operations to attract new customers and retain old ones while protecting the planet and ensuring sustainable operations. Key elements are customer needs gap analysis, communication gap and in demand financial products Showcasing this set of slides titled Emerging Investment Opportunities In Green Financing Themes PDF. The topics addressed in these templates are Trust, Products, Analysis. All the content presented in this PPT design is completely editable. Download it and make adjustments in color, background, font etc. as per your unique business setting.
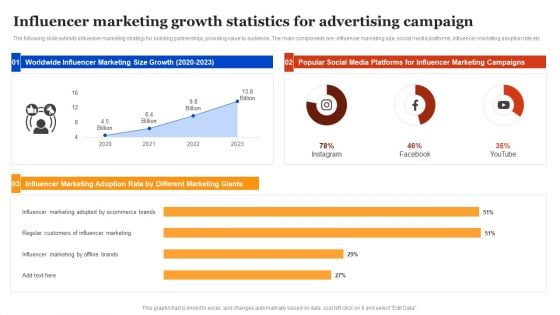
Influencer Marketing Growth Statistics For Advertising Campaign Themes PDF
The following slide exhibits influencer marketing strategy for building partnerships, providing value to audience. The main components are- influencer marketing size, social media platforms, influencer marketing adoption rate etc. Pitch your topic with ease and precision using this Influencer Marketing Growth Statistics For Advertising Campaign Themes PDF. This layout presents information on Marketing Giants, Campaign, Influencer. It is also available for immediate download and adjustment. So, changes can be made in the color, design, graphics or any other component to create a unique layout.
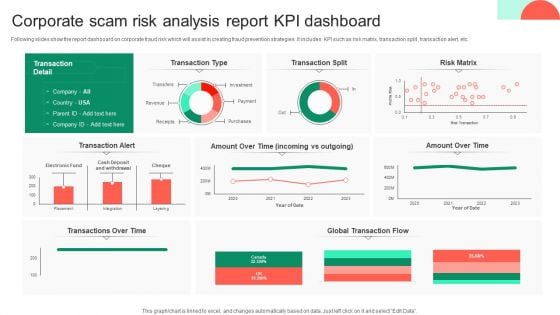
Corporate Scam Risk Analysis Report KPI Dashboard Themes PDF
Following slides show the report dashboard on corporate fraud risk which will assist in creating fraud prevention strategies .It includes KPI such as risk matrix, transaction split , transaction alert, etc. Pitch your topic with ease and precision using this Corporate Scam Risk Analysis Report KPI Dashboard Themes PDF. This layout presents information on Global Transaction Flow, Risk Matrix, Transaction Split, Analysis Report Kpi Dashboard. It is also available for immediate download and adjustment. So, changes can be made in the color, design, graphics or any other component to create a unique layout.
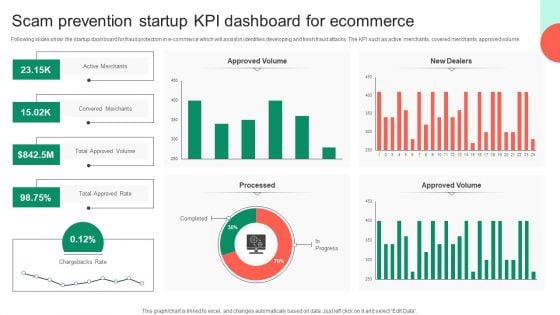
Scam Prevention Startup KPI Dashboard For Ecommerce Themes PDF
Following slides show the startup dashboard for fraud protection in e-commerce which will assist in identifies developing and fresh fraud attacks. The KPI such as active merchants, covered merchants, approved volume. Pitch your topic with ease and precision using this Scam Prevention Startup KPI Dashboard For Ecommerce Themes PDF. This layout presents information on Approved Volume, Chargebacks Rate, Kpi Dashboard For Ecommerce. It is also available for immediate download and adjustment. So, changes can be made in the color, design, graphics or any other component to create a unique layout.
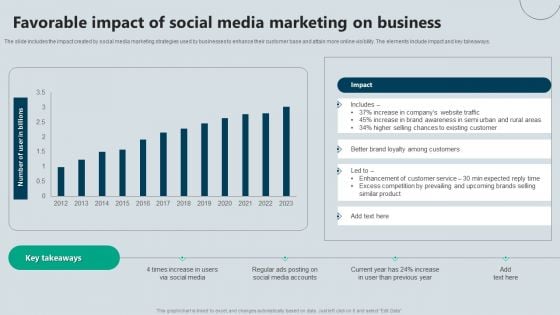
Favorable Impact Of Social Media Marketing On Business Themes PDF
The slide includes the impact created by social media marketing strategies used by businesses to enhance their customer base and attain more online visibility. The elements include impact and key takeaways. Pitch your topic with ease and precision using this Favorable Impact Of Social Media Marketing On Business Themes PDF. This layout presents information on Impact, Business, Existing Customer. It is also available for immediate download and adjustment. So, changes can be made in the color, design, graphics or any other component to create a unique layout.
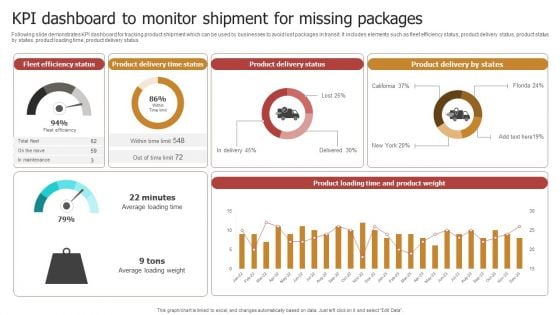
KPI Dashboard To Monitor Shipment For Missing Packages Themes PDF
Following slide demonstrates KPI dashboard for tracking product shipment which can be used by businesses to avoid lost packages in transit. It includes elements such as fleet efficiency status, product delivery status, product status by states, product loading time, product delivery status. Showcasing this set of slides titled KPI Dashboard To Monitor Shipment For Missing Packages Themes PDF. The topics addressed in these templates are Fleet Efficiency Status, Product Delivery Time Status, Product Delivery Status. All the content presented in this PPT design is completely editable. Download it and make adjustments in color, background, font etc. as per your unique business setting.
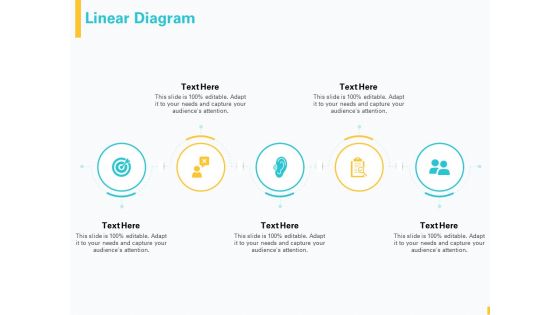
Designing Great Client Experience Action Plan Linear Diagram Ppt PowerPoint Presentation File Graphic Images PDF
Presenting designing great client experience action plan linear diagram ppt powerpoint presentation file graphic images pdf to provide visual cues and insights. Share and navigate important information on five stages that need your due attention. This template can be used to pitch topics like linear diagram. In addition, this PPT design contains high-resolution images, graphics, etc, that are easily editable and available for immediate download.
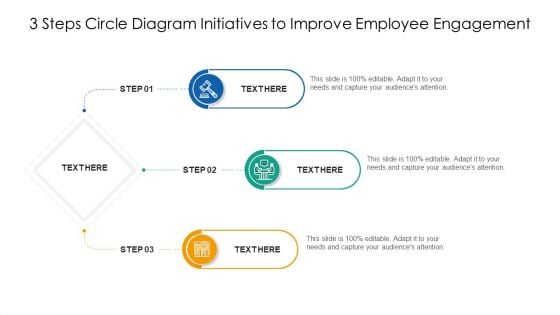
3 Steps Circle Diagram Initiatives To Improve Employee Engagement Structure PDF
Persuade your audience using this 3 steps circle diagram initiatives to improve employee engagement structure pdf. This PPT design covers three stages, thus making it a great tool to use. It also caters to a variety of topics including 3 steps circle diagram initiatives to improve employee engagement. Download this PPT design now to present a convincing pitch that not only emphasizes the topic but also showcases your presentation skills.
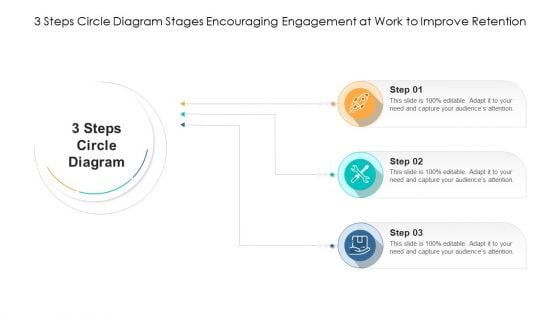
3 Steps Circle Diagram Stages Encouraging Engagement At Work To Improve Retention Background PDF
Persuade your audience using this 3 steps circle diagram stages encouraging engagement at work to improve retention background pdf. This PPT design covers three stages, thus making it a great tool to use. It also caters to a variety of topics including 3 steps circle diagram stages encouraging engagement at work to improve retention. Download this PPT design now to present a convincing pitch that not only emphasizes the topic but also showcases your presentation skills.
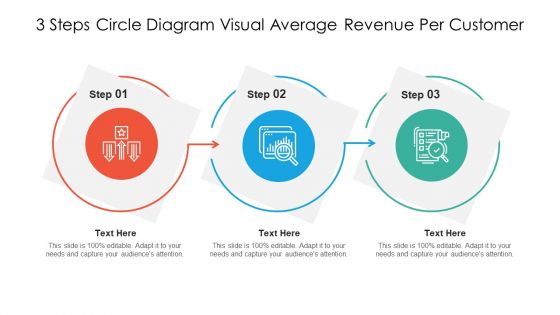
3 Steps Circle Diagram Visual Average Revenue Per Customer Formats PDF
Persuade your audience using this 3 steps circle diagram visual average revenue per customer formats pdf. This PPT design covers three stages, thus making it a great tool to use. It also caters to a variety of topics including 3 steps circle diagram visual average revenue per customer. Download this PPT design now to present a convincing pitch that not only emphasizes the topic but also showcases your presentation skills.
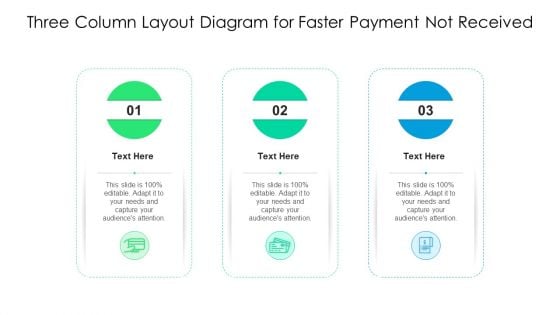
Three Column Layout Diagram For Faster Payment Not Received Ppt Show Background Images PDF
Persuade your audience using this three column layout diagram for faster payment not received ppt show background images pdf. This PPT design covers three stages, thus making it a great tool to use. It also caters to a variety of topics including three column layout diagram for faster payment not received. Download this PPT design now to present a convincing pitch that not only emphasizes the topic but also showcases your presentation skills.
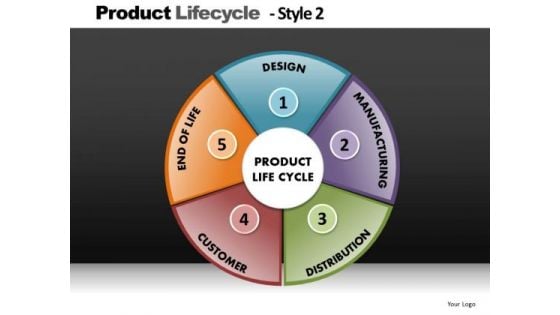
Product Lifecycle Pie Chart PowerPoint Slides Editable Ppt Slides
Product LifeCycle Pie Chart PowerPoint Slides Editable PPT Slides-These high quality powerpoint pre-designed slides and powerpoint templates have been carefully created by our professional team to help you impress your audience. All slides have been created and are 100% editable in powerpoint. Each and every property of any graphic - color, size, orientation, shading, outline etc. can be modified to help you build an effective powerpoint presentation. Any text can be entered at any point in the powerpoint template or slide. Simply DOWNLOAD, TYPE and PRESENT! These PowerPoint presentation slides can be used to represent themes relating to --Activities, business, clipart, commerce, concept, conceptual, customer, design, diagram, direction, distribution, guidelines, icon, illustration, integration, lifecycle, manage, management, manufacturing, marketing, mba, model, optimize, organization, performance, process, product, resentation, resource, sales, selling, steps, system, theoretical, theory, tool-Product LifeCycle Pie Chart PowerPoint Slides Editable PPT Slides Get all factions to act together. Our Product Lifecycle Pie Chart PowerPoint Slides Editable Ppt Slides can help achieve a common cause.

Ppt Circular PowerPoint Menu Template Process Cycle Diagram Free Templates
PPT circular powerpoint menu template process cycle diagram free Templates--PowerPoint presentations on Arrow, Background, Beautiful, Blue, Business, Button, Chart, Circle, Circular, Concept, Continous, Continuity, Continuous, Cycle, Diagram, Directional, Divisions, Graph, Icon, Illustration, Isolated, Modern, Multicolored, Presentation, Process, Profit, Progress, Recycle, Red, Research, Round, Segments, Sequence, Set, Sphere, Strategy, Success, Text, Trendy, Wheel-PPT circular powerpoint menu template process cycle diagram free Templates Expound on your field of study with our Ppt Circular PowerPoint Menu Template Process Cycle Diagram Free Templates. Familiarise them with what you have dug out.
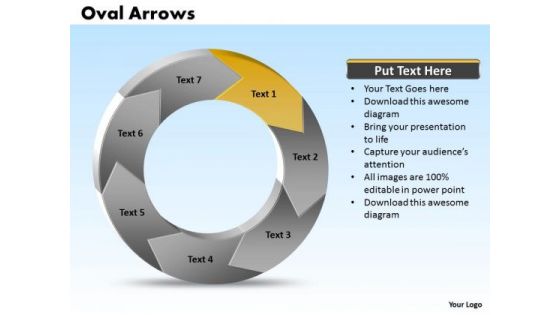
Ppt Oval Arrows PowerPoint 2010 7 State Diagram Templates
PPT oval arrows powerpoint 2010 7 state diagram Templates-Create visually amazing Microsoft office PPT Presentations with our above template. This premium graphics is especially suitable for chronologies, sequences. It provides the means to project your views.-PPT oval arrows powerpoint 2010 7 state diagram Templates-Arrow, Background, Beautiful, Blue, Business, Button, Chart, Circle, Circular, Concept, Continous, Continuity, Continuous, Cycle, Diagram, Directional, Divisions, Graph, Icon, Illustration, Isolated, Modern, Multicolored, Presentation, Process, Profit, Progress, Recycle, Red, Research, Round, Segments, Sequence, Set, Sphere, Strategy, Success, Text, Trendy, Wheel Our Ppt Oval Arrows PowerPoint 2010 7 State Diagram Templates designers have great aesthetic sense. They treat each slide as a work of art.
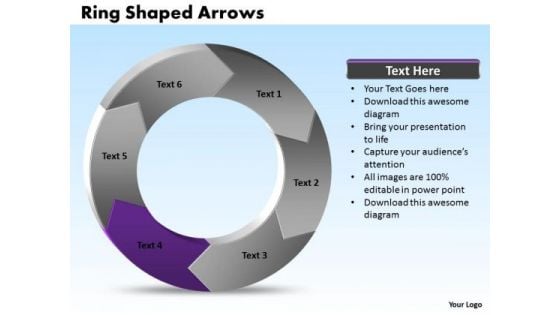
Ppt Plot Diagram PowerPoint Shaped Curved Arrows 2010 Multisteps Templates
PPT plot diagram powerpoint shaped curved arrows 2010 multisteps Templates-Use this digarm to have a general understanding of representing an information system process.This diagram will enhance the essence of your viable ideas-PPT plot diagram powerpoint shaped curved arrows 2010 multisteps Templates-Abstract, Around, Arrow, Arrow Circles, Chart, Circle, Circular, Circular Arrows, Circular Flow, Circulation, Cycle, Cyclic, Direction, Element, Flow, Icon, Illustration, Isolated, Motion, Movement, Refresh, Ring, Rotation, Round, Section, Set, Shape, Sign, Symbol With our Ppt Plot Diagram PowerPoint Shaped Curved Arrows 2010 Multisteps Templates there is no end. They will take you even further.
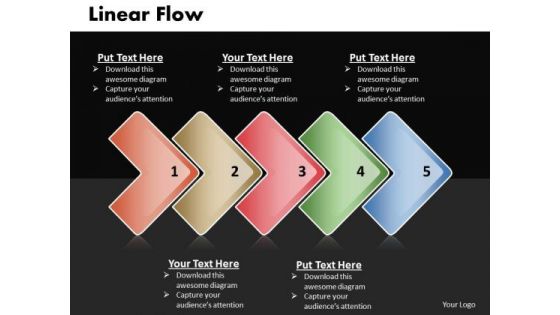
Ppt Linear Work Flow Chart PowerPoint 5 Stages Templates
PPT linear work flow chart powerpoint 5 stages Templates-Use this successive PowerPoint diagram to represent a series of interconnected ideas.-PPT linear work flow chart powerpoint 5 stages Templates-Abstract, Arrow, Arrow Chart, Business, Design, Development, Diagram, Direction, Element, Flow, Flow Chart, Flow Diagram, Flowchart, Graph, Linear, Management, Model, Motion, Organization, Plan, Process, Process Arrows, Process Chart, Process Diagram, Process Flow, Program, Section, Segment, Set, Sign, Solution, Strategy, Symbol, Technology There is nothing far fetched about our Ppt Linear Work Flow Chart PowerPoint 5 Stages Templates. Every aspect is correct and achievable.
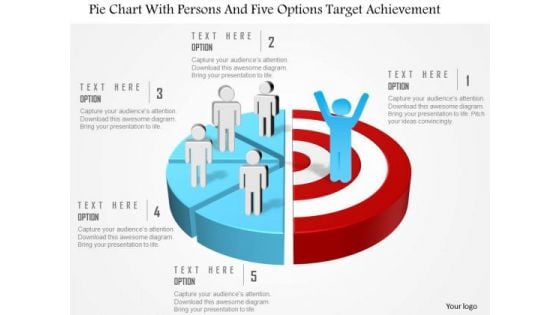
Business Diagram Pie Chart With Persons And Five Options Target Achievement Presentation Template
This power point template slide has been crafted with graphic of pie chart, persons and five options. This PPT contains the concept of option representation for target achievement. Use this PPT diagram for business and marketing targets related topics in any presentations.
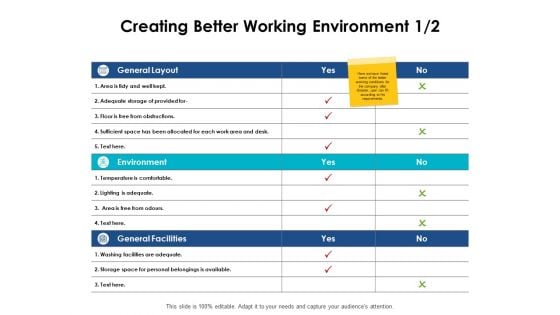
Creating Better Working Environment Storage Ppt PowerPoint Presentation Diagram Graph Charts
Presenting this set of slides with name creating better working environment storage ppt powerpoint presentation diagram graph charts. The topics discussed in these slides are strength, marketing, business, management, planning. This is a completely editable PowerPoint presentation and is available for immediate download. Download now and impress your audience.

Business Associate Shaking Hands After A Deal Ppt PowerPoint Presentation Diagram Graph Charts
Presenting this set of slides with name business associate shaking hands after a deal ppt powerpoint presentation diagram graph charts. This is a one stage process. The stage in this process is business associate shaking hands after a deal. This is a completely editable PowerPoint presentation and is available for immediate download. Download now and impress your audience.
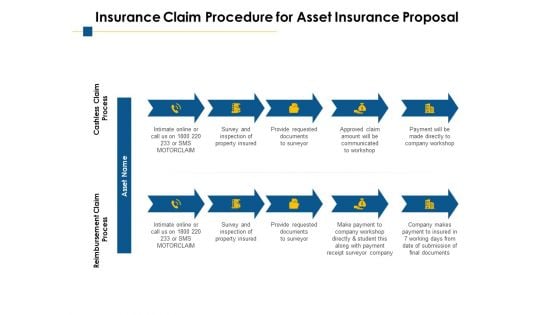
Insurance Claim Procedure For Asset Insurance Proposal Ppt PowerPoint Presentation Diagram Graph Charts
Presenting this set of slides with name insurance claim procedure for asset insurance proposal ppt powerpoint presentation diagram graph charts. This is a ten stage process. The stages in this process are reimbursement claim process, cashless claim process, asset. This is a completely editable PowerPoint presentation and is available for immediate download. Download now and impress your audience.

Our Team For Social Media Post Services Communication Ppt PowerPoint Presentation Diagram Graph Charts
Presenting this set of slides with name our team for social media post services communication ppt powerpoint presentation diagram graph charts. This is a one stage process. The stages in this process are our team, social media, post services. This is a completely editable PowerPoint presentation and is available for immediate download. Download now and impress your audience.
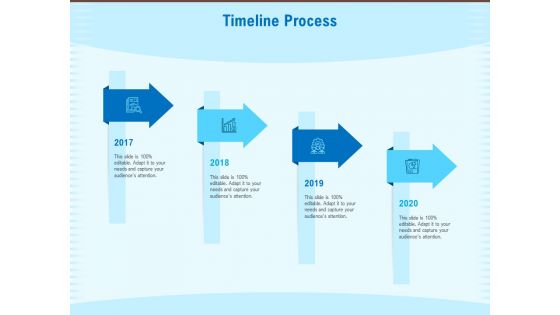
Artificial Surveillance Timeline Process Ppt PowerPoint Presentation Diagram Graph Charts PDF
Presenting this set of slides with name artificial surveillance timeline process ppt powerpoint presentation diagram graph charts pdf. This is a four stage process. The stages in this process are timeline, 2017 to 2020. This is a completely editable PowerPoint presentation and is available for immediate download. Download now and impress your audience.
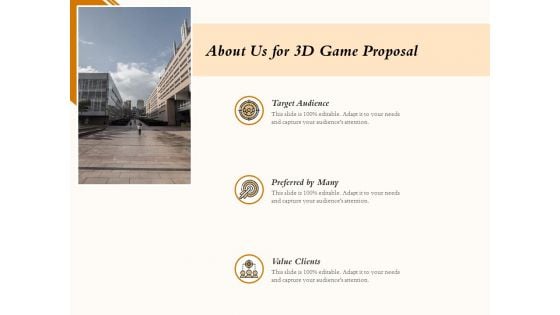
Three Dimensional Games Proposal About Us For 3D Game Proposal Target Ppt Diagram Graph Charts PDF
Presenting this set of slides with name three dimensional games proposal about us for 3d game proposal target ppt diagram graph charts pdf. This is a two stage process. The stages in this process are vision, mission, core values. This is a completely editable PowerPoint presentation and is available for immediate download. Download now and impress your audience.
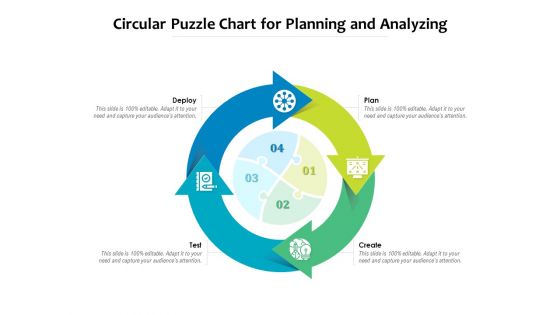
Circular Puzzle Chart For Planning And Analyzing Ppt PowerPoint Presentation Summary Diagrams PDF
Presenting this set of slides with name circular puzzle chart for planning and analyzing ppt powerpoint presentation summary diagrams pdf. This is a four stage process. The stages in this process are plan, create, test, deploy. This is a completely editable PowerPoint presentation and is available for immediate download. Download now and impress your audience.
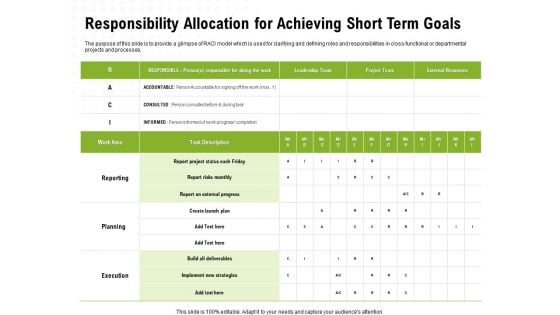
Strategic Growth Technique Responsibility Allocation For Achieving Short Term Goals Ppt Diagram Graph Charts PDF
Presenting this set of slides with name strategic growth technique responsibility allocation for achieving short term goals ppt diagram graph charts pdf. The topics discussed in these slides are implement, strategies, leadership team, external resources. This is a completely editable PowerPoint presentation and is available for immediate download. Download now and impress your audience.
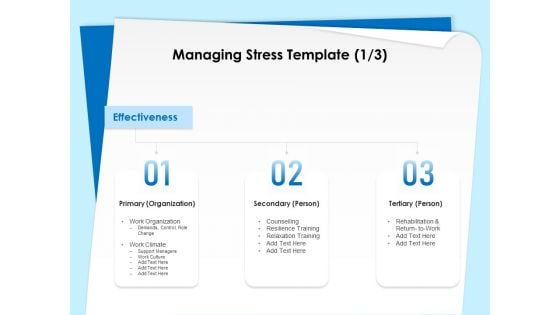
Executive Leadership Programs Managing Stress Template Primary Ppt PowerPoint Presentation Diagram Graph Charts PDF
Presenting this set of slides with name executive leadership programs managing stress template primary ppt powerpoint presentation diagram graph charts pdf. This is a three stage process. The stages in this process are primary organization, secondary person, tertiary person, work organization, resilience training, relaxation training. This is a completely editable PowerPoint presentation and is available for immediate download. Download now and impress your audience.
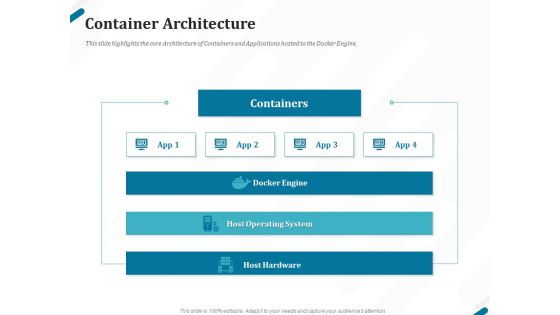
Kubernetes Containers Architecture Overview Container Architecture Ppt Diagram Graph Charts PDF
Presenting this set of slides with name kubernetes containers architecture overview container architecture ppt diagram graph charts pdf. The topics discussed in these slides are containers, docker engine, host operating system, host hardware. This is a completely editable PowerPoint presentation and is available for immediate download. Download now and impress your audience.

Lady Plucking Flowers From Agriculture Farm Ppt PowerPoint Presentation Diagram Graph Charts PDF
Presenting this set of slides with name lady plucking flowers from agriculture farm ppt powerpoint presentation diagram graph charts pdf. This is a one stage process. The stage in this process is lady plucking flowers from agriculture farm. This is a completely editable PowerPoint presentation and is available for immediate download. Download now and impress your audience.
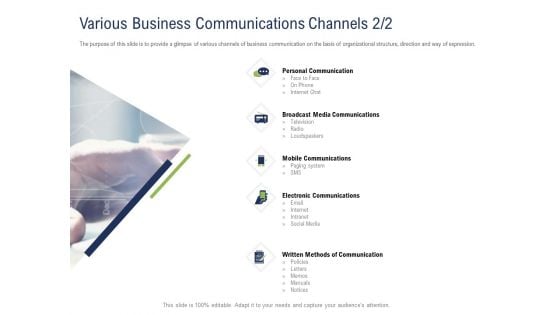
Incremental Decision Making Various Business Communications Channels Media Ppt Diagram Graph Charts PDF
Presenting this set of slides with name incremental decision making various business communications channels media ppt diagram graph charts pdf. This is a five stage process. The stages in this process are communication, broadcast media, mobile, electronic. This is a completely editable PowerPoint presentation and is available for immediate download. Download now and impress your audience.
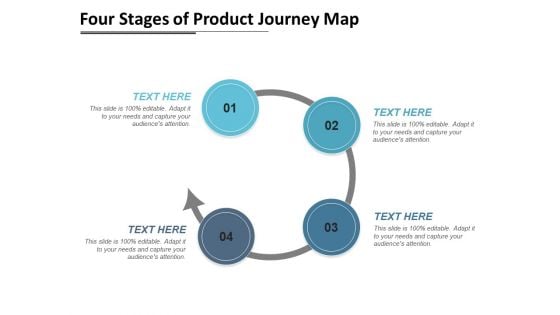
Four Stages Of Product Journey Map Ppt PowerPoint Presentation Diagram Graph Charts PDF
Presenting this set of slides with name four stages of product journey map ppt powerpoint presentation diagram graph charts pdf. This is a four stage process. The stages in this process are four stages of product journey map. This is a completely editable PowerPoint presentation and is available for immediate download. Download now and impress your audience.
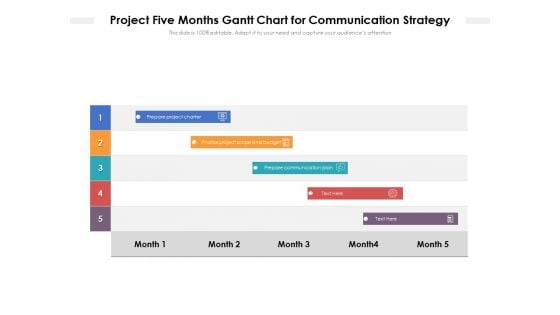
Project Five Months Gantt Chart For Communication Strategy Ppt PowerPoint Presentation Layouts Diagrams PDF
Showcasing this set of slides titled project five months gantt chart for communication strategy ppt powerpoint presentation layouts diagrams pdf. The topics addressed in these templates are prepare project charter, scope and budget, prepare communication plan. All the content presented in this PPT design is completely editable. Download it and make adjustments in color, background, font etc. as per your unique business setting.
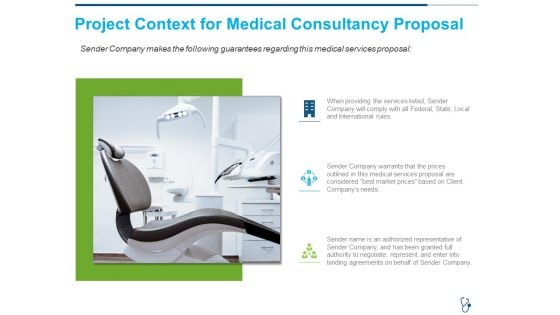
Project Context For Medical Consultancy Proposal Ppt Diagram Graph Charts PDF
Deliver and pitch your topic in the best possible manner with this project context for medical consultancy proposal ppt diagram graph charts pdf. Use them to share invaluable insights on project context for Medical Consultancy and impress your audience. This template can be altered and modified as per your expectations. So, grab it now.

White House Winter Image With Snow Ppt PowerPoint Presentation Diagram Graph Charts PDF
Pitch your topic with ease and precision using this white house winter image with snow ppt powerpoint presentation diagram graph charts pdf. This layout presents information on white house winter image with snow. It is also available for immediate download and adjustment. So, changes can be made in the color, design, graphics or any other component to create a unique layout.
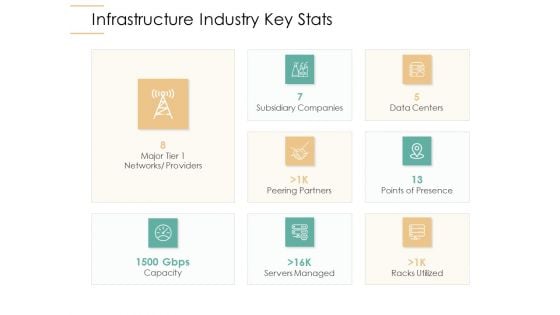
Infrastructure Strategies Infrastructure Industry Key Stats Ppt Diagram Graph Charts PDF
Deliver and pitch your topic in the best possible manner with this infrastructure strategies infrastructure industry key stats ppt diagram graph charts pdf. Use them to share invaluable insights on capacity, servers managed, racks utilized, peering partners, points of presence and impress your audience. This template can be altered and modified as per your expectations. So, grab it now.
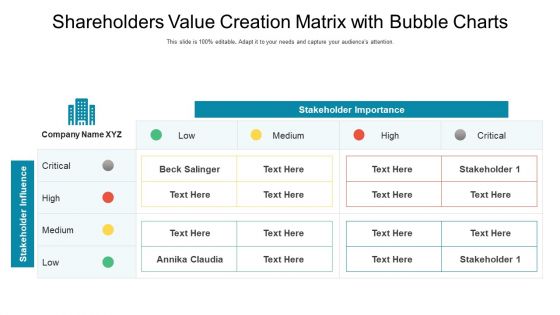
Shareholders Value Creation Matrix With Bubble Charts Ppt Slides Diagrams PDF
Showcasing this set of slides titled shareholders value creation matrix with bubble charts ppt slides diagrams pdf. The topics addressed in these templates are stakeholder importance, stakeholder influence. All the content presented in this PPT design is completely editable. Download it and make adjustments in color, background, font etc. as per your unique business setting.
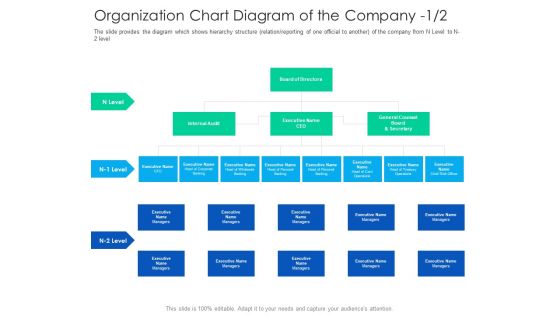
After Hours Trading Organization Chart Diagram Of The Company Directors Summary PDF
Deliver and pitch your topic in the best possible manner with this after hours trading organization chart diagram of the company directors summary pdf. Use them to share invaluable insights on internal audit, executive name managers general counsel board and secretary and impress your audience. This template can be altered and modified as per your expectations. So, grab it now.
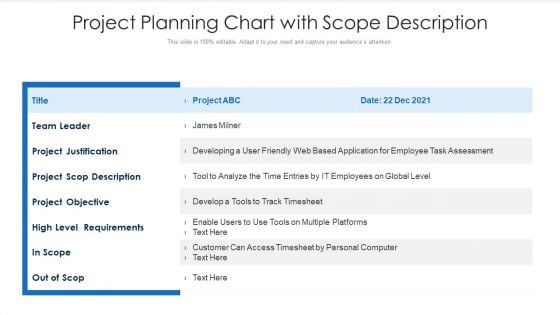
Project Planning Chart With Scope Description Ppt PowerPoint Presentation Show Diagrams PDF
Pitch your topic with ease and precision using this project planning chart with scope description ppt powerpoint presentation show diagrams pdf. This layout presents information on team leader, project justification, project scop description. It is also available for immediate download and adjustment. So, changes can be made in the color, design, graphics or any other component to create a unique layout.
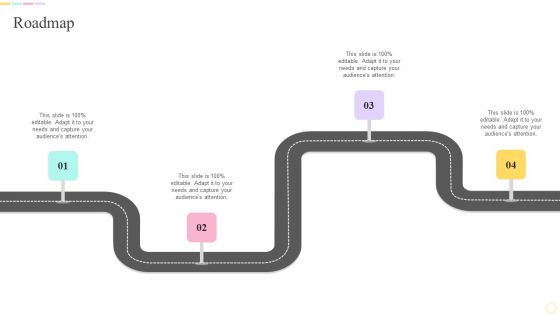
E Learning Playbook Roadmap Ppt PowerPoint Presentation Diagram Graph Charts PDF
This is a E Learning Playbook Roadmap Ppt PowerPoint Presentation Diagram Graph Charts PDF template with various stages. Focus and dispense information on four stages using this creative set, that comes with editable features. It contains large content boxes to add your information on topics like Puzzle. You can also showcase facts, figures, and other relevant content using this PPT layout. Grab it now.

Two Doctors Conducting Healthcare Surgery In Hospital Ppt PowerPoint Presentation Diagram Graph Charts PDF
Pitch your topic with ease and precision using this Two Doctors Conducting Healthcare Surgery In Hospital Ppt PowerPoint Presentation Diagram Graph Charts PDF. This layout presents information on Two Doctors, Conducting Healthcare, Surgery In Hospital. It is also available for immediate download and adjustment. So, changes can be made in the color, design, graphics or any other component to create a unique layout.
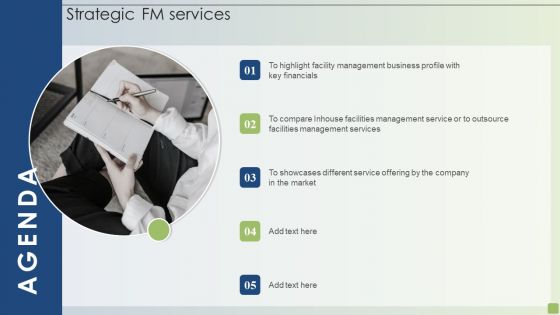
Agenda Strategic FM Services Ppt PowerPoint Presentation Diagram Graph Charts PDF
Find a pre designed and impeccable Agenda Strategic FM Services Ppt PowerPoint Presentation Diagram Graph Charts PDF. The templates can ace your presentation without additional effort. You can download these easy to edit presentation templates to make your presentation stand out from others. So, what are you waiting for Download the template from Slidegeeks today and give a unique touch to your presentation.
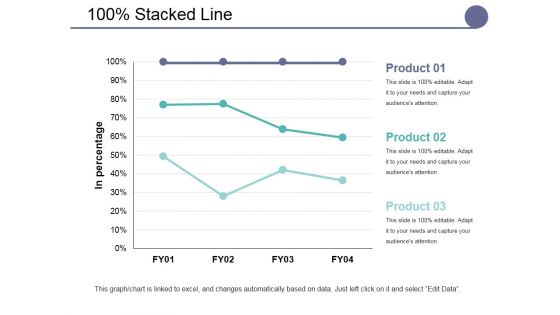
Stacked Line Ppt PowerPoint Presentation Summary Themes
This is a stacked line ppt powerpoint presentation summary themes. This is a three stage process. The stages in this process are business, marketing, strategy, management, finance.
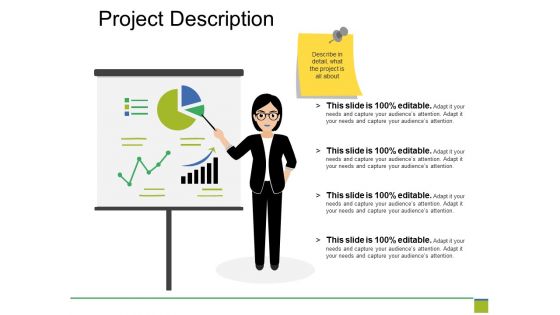
Project Description Ppt PowerPoint Presentation Layouts Themes
This is a project description ppt powerpoint presentation layouts themes. This is a four stage process. The stages in this process are business, marketing, strategy, planning, management.
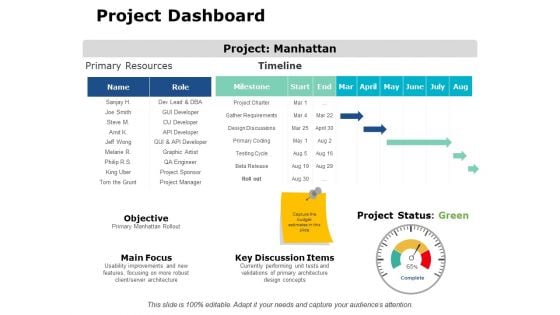
Project Dashboard Ppt PowerPoint Presentation Show Themes
This is a project dashboard ppt powerpoint presentation show themes. This is a eleven stage process. The stages in this process are finance, analysis, business, investment, marketing.
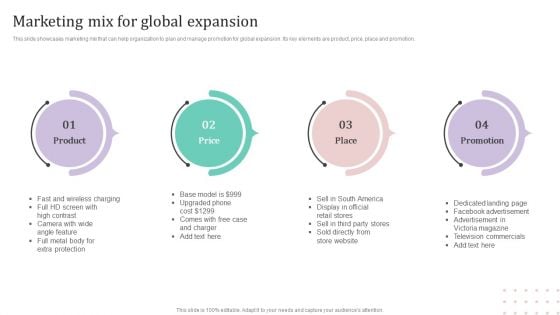
Marketing Mix For Global Expansion Ppt PowerPoint Presentation Diagram Graph Charts PDF
This slide showcases marketing mix that can help organization to plan and manage promotion for global expansion. Its key elements are product, price, place and promotion.If you are looking for a format to display your unique thoughts, then the professionally designed Marketing Mix For Global Expansion Ppt PowerPoint Presentation Diagram Graph Charts PDF is the one for you. You can use it as a Google Slides template or a PowerPoint template. Incorporate impressive visuals, symbols, images, and other charts. Modify or reorganize the text boxes as you desire. Experiment with shade schemes and font pairings. Alter, share or cooperate with other people on your work. Download Marketing Mix For Global Expansion Ppt PowerPoint Presentation Diagram Graph Charts PDF and find out how to give a successful presentation. Present a perfect display to your team and make your presentation unforgettable.
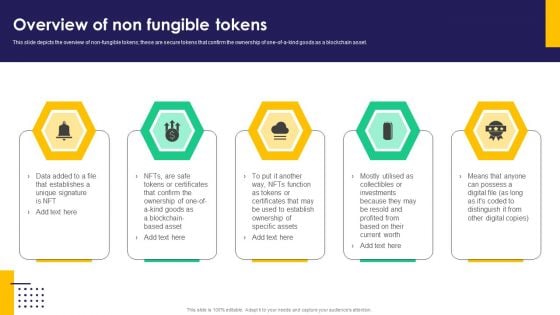
Overview Of Non Fungible Tokens Ppt PowerPoint Presentation Diagram Graph Charts PDF
This slide depicts the overview of non-fungible tokens these are secure tokens that confirm the ownership of one-of-a-kind goods as a blockchain asset. If you are looking for a format to display your unique thoughts, then the professionally designed Overview Of Non Fungible Tokens Ppt PowerPoint Presentation Diagram Graph Charts PDF is the one for you. You can use it as a Google Slides template or a PowerPoint template. Incorporate impressive visuals, symbols, images, and other charts. Modify or reorganize the text boxes as you desire. Experiment with shade schemes and font pairings. Alter, share or cooperate with other people on your work. Download Overview Of Non Fungible Tokens Ppt PowerPoint Presentation Diagram Graph Charts PDF and find out how to give a successful presentation. Present a perfect display to your team and make your presentation unforgettable.
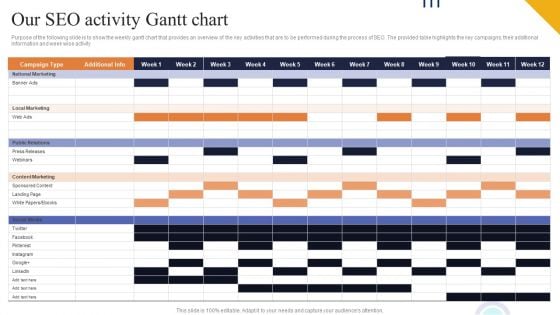
Our SEO Activity Gantt Chart Ppt PowerPoint Presentation Diagram Templates PDF
Purpose of the following slide is to show the weekly gantt chart that provides an overview of the key activities that are to be performed during the process of SEO. The provided table highlights the key campaigns, their additional information and week wise activity This Our SEO Activity Gantt Chart Ppt PowerPoint Presentation Diagram Templates PDF is perfect for any presentation, be it in front of clients or colleagues. It is a versatile and stylish solution for organizing your meetings. The Our SEO Activity Gantt Chart Ppt PowerPoint Presentation Diagram Templates PDF features a modern design for your presentation meetings. The adjustable and customizable slides provide unlimited possibilities for acing up your presentation. Slidegeeks has done all the homework before launching the product for you. So, do not wait, grab the presentation templates today
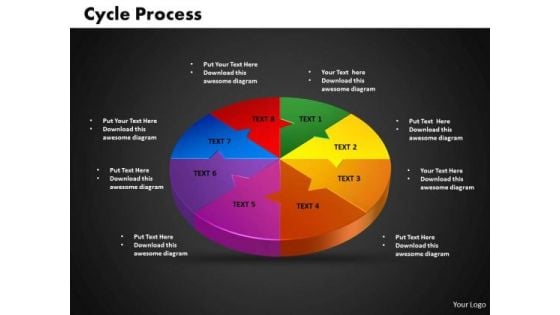
PowerPoint Cycle Process Diagram Ppt Backgrounds
PowerPoint Cycle Process Diagram PPT Backgrounds-This Cycle Diagram is a type of graphics that shows how items are related to one another in a repeating cycle. In a cycle diagram, you can explain the main events in the cycle, how they interact, and how the cycle repeats. -PowerPoint Cycle Process Diagram PPT Backgrounds-Business, Chart, Circle, Cycle, Marketing, Manage, Investment, Information, Growth, Graph, Flow, Process, Progress, Recycle, Rotation, Sequence, Sphere, Plan, Diagram, Direction Get in contention with our PowerPoint Cycle Process Diagram Ppt Backgrounds. The audience will add your name to the list.
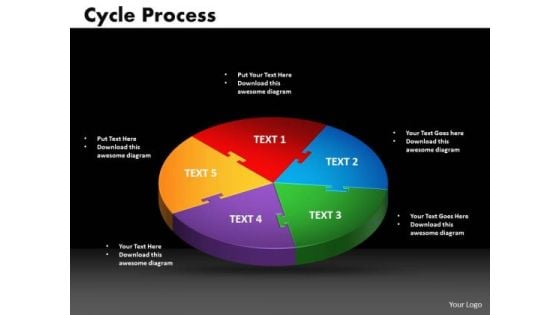
PowerPoint Slide Cycle Process Diagram Ppt Presentation
PowerPoint Slide Cycle Process Diagram PPT Presentation-Cycle Diagrams are a type of graphics that shows how items are related to one another in a repeating cycle. In a cycle diagram, you can explain the main events in the cycle, how they interact, and how the cycle repeats.-PowerPoint Slide Cycle Process Diagram PPT Presentation-Background, Business, Chart, Circle, Circular, Marketing, Management, Flow, Graph, Process, Round, Segmented, Sequence, Wheel, Diagram, Division, Continuity, Template, Web, Illustration Deal a decisive blow with our PowerPoint Slide Cycle Process Diagram Ppt Presentation. Get clearlyahead in a critical event.
IT Robotic Process Automation Software Analysis Checklist Icon Themes PDF
This slide outlines robotic process automation business cases aimed at making supply chain processes more efficient by utilizing technological elements. It covers three cases integrated data transmission, order management with returns and after sales handling Presenting IT Robotic Process Automation Software Analysis Checklist Icon Themes PDF to dispense important information. This template comprises three stages. It also presents valuable insights into the topics including Integrated Data Transmission, Order Management, Returns After Sales Handling . This is a completely customizable PowerPoint theme that can be put to use immediately. So, download it and address the topic impactfully.
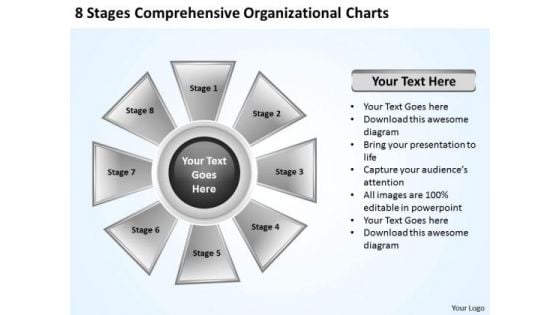
Business Marketing Strategy Comprehensive Organizational Charts Process
We present our business marketing strategy comprehensive organizational charts process.Present our Process and Flows PowerPoint Templates because It will mark the footprints of your journey. Illustrate how they will lead you to your desired destination. Download and present our Flow Charts PowerPoint Templates because Our PowerPoint Templates and Slides will let your team Walk through your plans. See their energy levels rise as you show them the way. Download and present our Shapes PowerPoint Templates because our PowerPoint Templates and Slides will give your ideas the shape. Present our Marketing PowerPoint Templates because You have gained great respect for your brilliant ideas. Use our PowerPoint Templates and Slides to strengthen and enhance your reputation. Download our Business PowerPoint Templates because Our PowerPoint Templates and Slides will let Your superior ideas hit the target always and everytime.Use these PowerPoint slides for presentations relating to Abstract, arrow, business, button, catalog, chart, circle, cross,demonstration, description, diagram, futuristic, glossy, goals, illustration,information, interface, internet, isolated, level, list, marketing, model, multiple,navigation, network, pattern, pie, presentation, registry, report, section, space,sphere, statement, statistics, steps, structure, target, template, text, vector, web,webdesign, wheel. The prominent colors used in the PowerPoint template are Gray, Black, White. Charge your account with our Business Marketing Strategy Comprehensive Organizational Charts Process. Earn the interest of your audience.
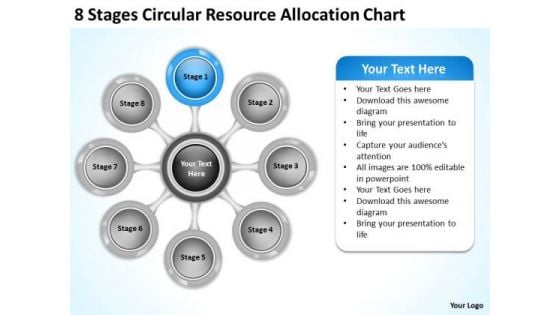
Business Strategy Implementation Resource Allocation Chart Internet
We present our business strategy implementation resource allocation chart internet.Use our Marketing PowerPoint Templates because You will get more than you ever bargained for. Use our Business PowerPoint Templates because Our PowerPoint Templates and Slides will let your words and thoughts hit bullseye everytime. Use our Circle Charts PowerPoint Templates because They will Put the wind in your sails. Skim smoothly over the choppy waters of the market. Download and present our Arrows PowerPoint Templates because Our PowerPoint Templates and Slides will bullet point your ideas. See them fall into place one by one. Present our Process and Flows PowerPoint Templates because Our PowerPoint Templates and Slides will definately Enhance the stature of your presentation. Adorn the beauty of your thoughts with their colourful backgrounds.Use these PowerPoint slides for presentations relating to 3d, Action, Analysis, Attitude, Brainstorming, Business, Chart, Classroom, Concept, Conceptual, Conference, Connection, Corporate, Design, Diagram, Direction, Element, Employee, Enhance, Financial, Formula, Future, Goal, Graphic, Guidelines, Idea, Link, Management, Market, Marketing, Mind, Mind Map, Organization, Organize, Plan, Process, Product, Relation, Render, Solutions, Strategy, Success, Successful, Tactic, Target, Text, Training, Unity. The prominent colors used in the PowerPoint template are Tan, Gray, Black. Color your presentation with success with our Business Strategy Implementation Resource Allocation Chart Internet. You will come out on top.

Ppt Theme Multicolored Sequential Flow Diagram Leadership Presentation PowerPoint 9 Graphic
We present our PPT Theme multicolored Sequential flow diagram leadership presentation power point 9 Graphic. Use our Business PowerPoint Templates because, the structure of our templates allows you to effectively highlight the key issues concerning the growth of your business. Use our Shapes PowerPoint Templates because, organize your thoughts and illuminate your ideas accordingly. Use our Design PowerPoint Templates because, The Venn graphic comprising interlinking circles geometrically demonstrate how various functions operating independently, to a large extent, are essentially interdependent. Use our Signs PowerPoint Templates because; now put it up there for all to see. Use our Process and Flows PowerPoint Templates because, to strive to give true form to your great dream. Use these PowerPoint slides for presentations relating to abstract, algorithm, arrow, business, chart, connection, design, development, diagram, direction, element, flow, graph, linear, linear diagram, management, organization, plan, process, section, segment, set, sign, solution, strategy, symbol, vector. The prominent colors used in the PowerPoint template are Blue navy, Gray, Black Impress a church with our Ppt Theme Multicolored Sequential Flow Diagram Leadership Presentation PowerPoint 9 Graphic. Just download, type and present.


 Continue with Email

 Home
Home


