AI PPT Maker
 Templates
 PPT Bundles
 Design Services
 Business PPTs
 Business Plan
 Management
 Strategy
 Introduction PPT
 Roadmap
 Self Introduction
 Timelines
 Process
 Marketing
 Agenda
 Technology
 Medical
 Startup Business Plan
 Cyber Security
 Dashboards
 SWOT
SWOT Proposals
 Education
 Pitch Deck
 Digital Marketing
 KPIs
KPIs Project Management
 Product Management
 Artificial Intelligence
 Target Market
 Communication
 Supply Chain
 Google Slides
 Research Services
 One Pagers
 All Categories
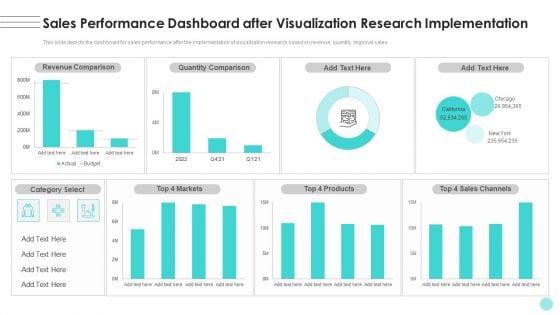
Branches For Visualization Research And Development Sales Performance Dashboard After Infographics PDF


Features of these PowerPoint presentation slides:
This slide depicts the dashboard for sales performance after the implementation of visualization research based on revenue, quantity, regional sales. Crafting an eye-catching presentation has never been more straightforward. Let your presentation shine with this tasteful yet straightforward Branches For Visualization Research And Development Sales Performance Dashboard After Infographics PDF template. It offers a minimalistic and classy look that is great for making a statement. The colors have been employed intelligently to add a bit of playfulness while still remaining professional. Construct the ideal Branches For Visualization Research And Development Sales Performance Dashboard After Infographics PDF that effortlessly grabs the attention of your audience Begin now and be certain to wow your customers.
People who downloaded this PowerPoint presentation also viewed the following :
Related Products
Branches For Visualization Research And Development Sales Performance Dashboard After Infographics PDF with all 2 slides: