AI PPT Maker
 Templates
 PPT Bundles
 Design Services
 Business PPTs
 Business Plan
 Management
 Strategy
 Introduction PPT
 Roadmap
 Self Introduction
 Timelines
 Process
 Marketing
 Agenda
 Technology
 Medical
 Startup Business Plan
 Cyber Security
 Dashboards
 SWOT
SWOT Proposals
 Education
 Pitch Deck
 Digital Marketing
 KPIs
KPIs Project Management
 Product Management
 Artificial Intelligence
 Target Market
 Communication
 Supply Chain
 Google Slides
 Research Services
 One Pagers
 All Categories
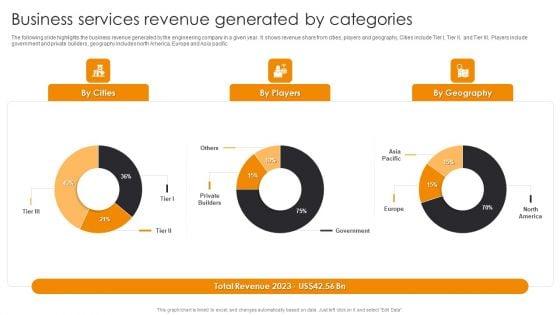
Business Services Revenue Generated By Categories Engineering Company Financial Analysis Report Graphics PDF


Features of these PowerPoint presentation slides:
The following slide highlights the business revenue generated by the engineering company in a given year. It shows revenue share from cities, players and geography, Cities include Tier I, Tier II, and Tier III, Players include government and private builders, geography includes north America, Europe and Asia pacific.If you are looking for a format to display your unique thoughts, then the professionally designed Business Services Revenue Generated By Categories Engineering Company Financial Analysis Report Graphics PDF is the one for you. You can use it as a Google Slides template or a PowerPoint template. Incorporate impressive visuals, symbols, images, and other charts. Modify or reorganize the text boxes as you desire. Experiment with shade schemes and font pairings. Alter, share or cooperate with other people on your work. Download Business Services Revenue Generated By Categories Engineering Company Financial Analysis Report Graphics PDF and find out how to give a successful presentation. Present a perfect display to your team and make your presentation unforgettable.
People who downloaded this PowerPoint presentation also viewed the following :
Keywords:
Related Products
Business Services Revenue Generated By Categories Engineering Company Financial Analysis Report Graphics PDF with all 2 slides: