AI PPT Maker
 Templates
 PPT Bundles
 Design Services
 Business PPTs
 Business Plan
 Management
 Strategy
 Introduction PPT
 Roadmap
 Self Introduction
 Timelines
 Process
 Marketing
 Agenda
 Technology
 Medical
 Startup Business Plan
 Cyber Security
 Dashboards
 SWOT
SWOT Proposals
 Education
 Pitch Deck
 Digital Marketing
 KPIs
KPIs Project Management
 Product Management
 Artificial Intelligence
 Target Market
 Communication
 Supply Chain
 Google Slides
 Research Services
 One Pagers
 All Categories
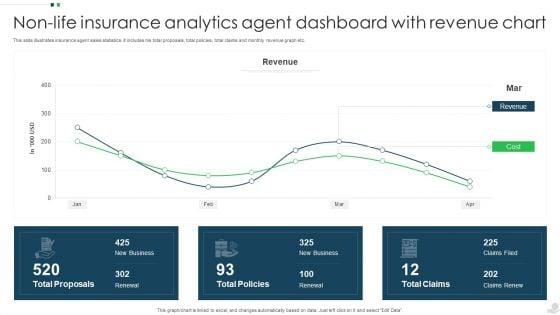
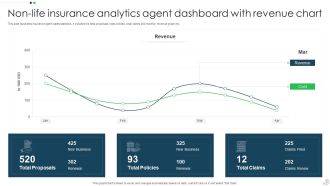
Non Life Insurance Analytics Agent Dashboard With Revenue Chart Infographics PDF


Features of these PowerPoint presentation slides:
This slide illustrates insurance agent sales statistics. It includes his total proposals, total policies, total claims and monthly revenue graph etc. Showcasing this set of slides titled Non Life Insurance Analytics Agent Dashboard With Revenue Chart Infographics PDF. The topics addressed in these templates are Revenue, Cost, Total Proposals. All the content presented in this PPT design is completely editable. Download it and make adjustments in color, background, font etc. as per your unique business setting.
People who downloaded this PowerPoint presentation also viewed the following :
Keywords:
Related Products
Non Life Insurance Analytics Agent Dashboard With Revenue Chart Infographics PDF with all 2 slides: