 AI PPT Maker
 Templates
 PPT Bundles
 Design Services
 Business PPTs
 Business Plan
 Management
 Strategy
 Introduction PPT
 Roadmap
 Self Introduction
 Timelines
 Process
 Marketing
 Agenda
 Technology
 Medical
 Startup Business Plan
 Cyber Security
 Dashboards
 SWOT
SWOT Proposals
 Education
 Pitch Deck
 Digital Marketing
 KPIs
KPIs Project Management
 Product Management
 Artificial Intelligence
 Target Market
 Communication
 Supply Chain
 Google Slides
 Research Services
 One Pagers
 All Categories
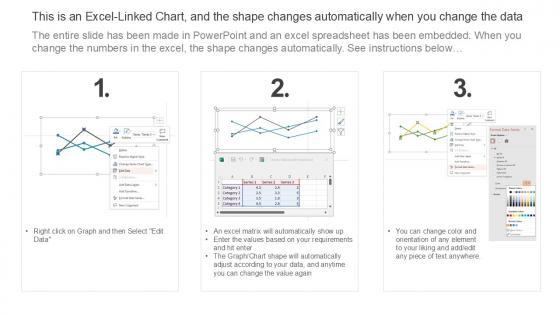
Charts and Graphs PowerPoint Templates
Are you looking to give your next presentation an edge? With our charts and graphs PowerPoint templates, you can easily create professional-looking presentations that will grab your audience's attention. These amazing PPT layouts will help you present the lengthy data and texts in a visually appealing way with self-explanatory diagrams and illustrations. Our charts and graphs PPT templates are designed to be versatile and easy to adapt, so you can fit them into any presentation style. These pre-designed PowerPoint presentation layouts will benefit you in discussing task duration, monitor and track progress, and much more. You can also use these brilliant PPT slides to plan your projects in an efficient and interesting way. With a range of high-quality graphics to choose from, you can find the perfect design for your data. And if you need to make some quick changes, our templates are fully customizable – so you can change the color, font, and font size to ensure an appealing and polished presentation. So grab these PowerPoint templates now to depict your data in an appealing way!
SHOW
- 60
- 120
- 180
DISPLAYING: 60 of 10000 Item(s)
Page


The following slide outlines historical revenue of company for last five years along with growth rate. Time period covered in this slide is from 2018-2022 along with key observations. Do you have to make sure that everyone on your team knows about any specific topic I yes, then you should give Implementing Scale AI Five Year Revenue Of Scale AI PPT Presentation AI SS V a try. Our experts have put a lot of knowledge and effort into creating this impeccable Implementing Scale AI Five Year Revenue Of Scale AI PPT Presentation AI SS V. You can use this template for your upcoming presentations, as the slides are perfect to represent even the tiniest detail. You can download these templates from the Slidegeeks website and these are easy to edit. So grab these today
This slide showcases the KPIs that would help to track the improvements with adoption of new sustainable agriculture practices. It includes current tasks, crops, harvest, todays weather, summary, etc. This Dashboard Analysis For Tracking Enhancing Productivity With Adoption PPT Presentation from Slidegeeks makes it easy to present information on your topic with precision. It provides customization options, so you can make changes to the colors, design, graphics, or any other component to create a unique layout. It is also available for immediate download, so you can begin using it right away. Slidegeeks has done good research to ensure that you have everything you need to make your presentation stand out. Make a name out there for a brilliant performance.


This slide provides glimpse about impact analysis of crop productivity after implementation of sustainable agriculture. It includes parameters such as usage of chemical fertilizers, share of forestry and fishing in overall agriculture, etc. If your project calls for a presentation, then Slidegeeks is your go-to partner because we have professionally designed, easy-to-edit templates that are perfect for any presentation. After downloading, you can easily edit Analyzing Impact Of New Practices Enhancing Productivity With Adoption PPT Sample and make the changes accordingly. You can rearrange slides or fill them with different images. Check out all the handy templates
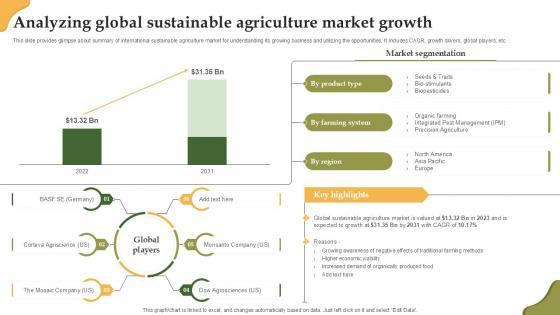

This slide provides glimpse about summary of international sustainable agriculture market for understanding its growing business and utilizing the opportunities. It includes CAGR, growth drivers, global players, etc. Find highly impressive Analyzing Global Sustainable Agriculture Enhancing Productivity With Adoption PPT Sample on Slidegeeks to deliver a meaningful presentation. You can save an ample amount of time using these presentation templates. No need to worry to prepare everything from scratch because Slidegeeks experts have already done a huge research and work for you. You need to download Analyzing Global Sustainable Agriculture Enhancing Productivity With Adoption PPT Sample for your upcoming presentation. All the presentation templates are 100 percent editable and you can change the color and personalize the content accordingly. Download now
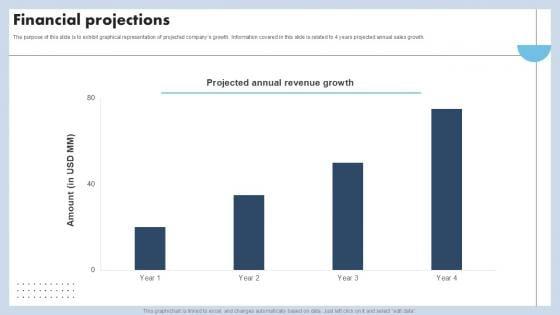

The purpose of this slide is to exhibit graphical representation of projected companys growth. Information covered in this slide is related to 4 years projected annual sales growth. Present like a pro with Financial Projections Capital Raising Pitch Deck For Advertising Services PPT Presentation. Create beautiful presentations together with your team, using our easy-to-use presentation slides. Share your ideas in real-time and make changes on the fly by downloading our templates. So whether you are in the office, on the go, or in a remote location, you can stay in sync with your team and present your ideas with confidence. With Slidegeeks presentation got a whole lot easier. Grab these presentations today.
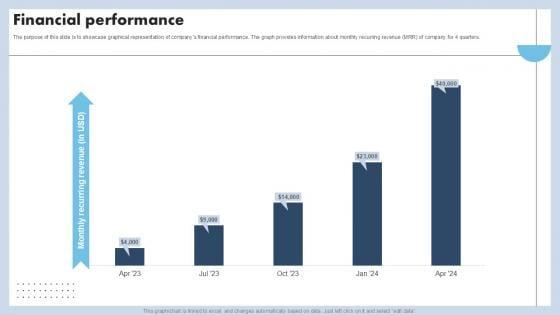

The purpose of this slide is to showcase graphical representation of companys financial performance. The graph provides information about monthly recurring revenue MRR of company for 4 quarters. From laying roadmaps to briefing everything in detail, our templates are perfect for you. You can set the stage with your presentation slides. All you have to do is download these easy-to-edit and customizable templates. Financial Performance Capital Raising Pitch Deck For Advertising Services PPT Sample will help you deliver an outstanding performance that everyone would remember and praise you for. Do download this presentation today.
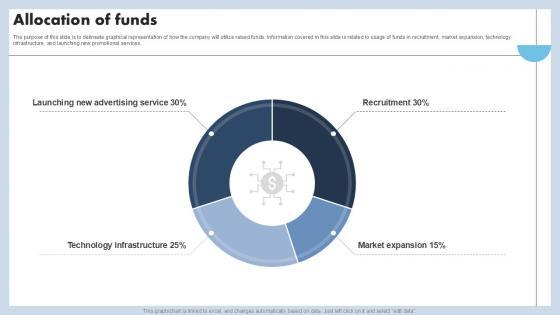

The purpose of this slide is to delineate graphical representation of how the company will utilize raised funds. Information covered in this slide is related to usage of funds in recruitment, market expansion, technology infrastructure, and launching new promotional services. Find a pre-designed and impeccable Allocation Of Funds Capital Raising Pitch Deck For Advertising Services PPT PowerPoint. The templates can ace your presentation without additional effort. You can download these easy-to-edit presentation templates to make your presentation stand out from others. So, what are you waiting for Download the template from Slidegeeks today and give a unique touch to your presentation.
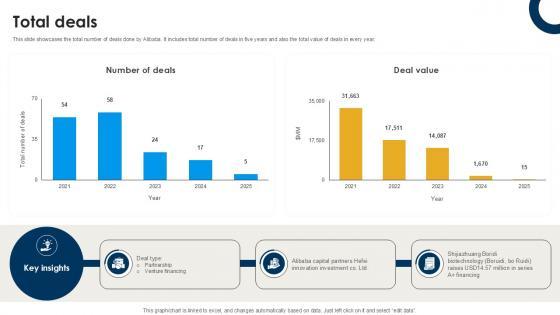

This slide showcases the total number of deals done by Alibaba. It includes total number of deals in five years and also the total value of deals in every year. There are so many reasons you need a Total Deals International Trade Of Products And Services PPT Sample CP SS V. The first reason is you can not spend time making everything from scratch, Thus, Slidegeeks has made presentation templates for you too. You can easily download these templates from our website easily.


This slide showcases the combined shareholding pattern of Alibaba. It includes shareholders such as Individual stakeholders, Institutional investors and mutual fund holders. It also includes top ten shareholders. Take your projects to the next level with our ultimate collection of Shareholding Pattern International Trade Of Products And Services PPT PowerPoint CP SS V. Slidegeeks has designed a range of layouts that are perfect for representing task or activity duration, keeping track of all your deadlines at a glance. Tailor these designs to your exact needs and give them a truly corporate look with your own brand colors they will make your projects stand out from the rest


This slide showcases the revenue of Alibaba. Total revenue is total amount of money that a company earns through the selling of its goods and services, over a time period. This Revenue International Trade Of Products And Services PPT Slide CP SS V from Slidegeeks makes it easy to present information on your topic with precision. It provides customization options, so you can make changes to the colors, design, graphics, or any other component to create a unique layout. It is also available for immediate download, so you can begin using it right away. Slidegeeks has done good research to ensure that you have everything you need to make your presentation stand out. Make a name out there for a brilliant performance.
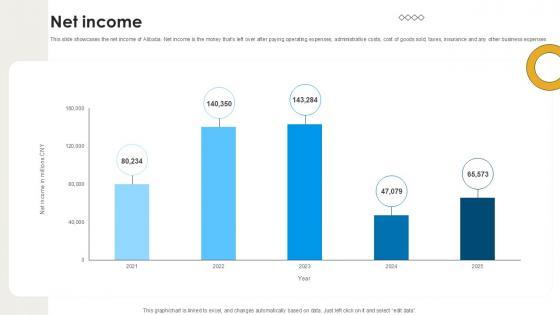

This slide showcases the net income of Alibaba. Net income is the money that s left over after paying operating expenses, administrative costs, cost of goods sold, taxes, insurance and any other business expenses. Slidegeeks has constructed Net Income International Trade Of Products And Services PPT Sample CP SS V after conducting extensive research and examination. These presentation templates are constantly being generated and modified based on user preferences and critiques from editors. Here, you will find the most attractive templates for a range of purposes while taking into account ratings and remarks from users regarding the content. This is an excellent jumping-off point to explore our content and will give new users an insight into our top-notch PowerPoint Templates.
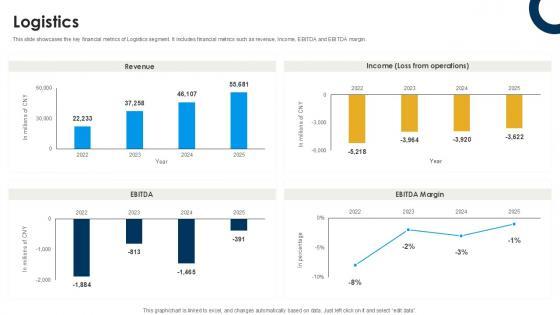

This slide showcases the key financial metrics of Logistics segment. It includes financial metrics such as revenue, Income, EBITDA and EBITDA margin. Explore a selection of the finest Logistics International Trade Of Products And Services PPT Sample CP SS V here. With a plethora of professionally designed and pre-made slide templates, you can quickly and easily find the right one for your upcoming presentation. You can use our Logistics International Trade Of Products And Services PPT Sample CP SS V to effectively convey your message to a wider audience. Slidegeeks has done a lot of research before preparing these presentation templates. The content can be personalized and the slides are highly editable. Grab templates today from Slidegeeks.


This slide showcases the key financial metrics of Local consumer services segment. It includes financial metrics such as revenue, Income, EBITDA and EBITDA margin. Welcome to our selection of the Local Consumer Services International Trade Of Products And Services PPT Example CP SS V. These are designed to help you showcase your creativity and bring your sphere to life. Planning and Innovation are essential for any business that is just starting out. This collection contains the designs that you need for your everyday presentations. All of our PowerPoints are 100Percent editable, so you can customize them to suit your needs. This multi-purpose template can be used in various situations. Grab these presentation templates today.
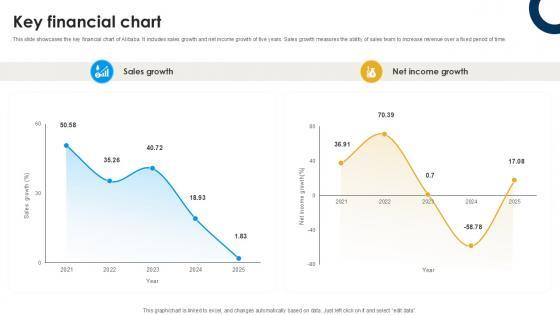
This slide showcases the key financial chart of Alibaba. It includes sales growth and net income growth of five years. Sales growth measures the ability of sales team to increase revenue over a fixed period of time. This modern and well-arranged Key Financial Chart International Trade Of Products And Services PPT Template CP SS V provides lots of creative possibilities. It is very simple to customize and edit with the Powerpoint Software. Just drag and drop your pictures into the shapes. All facets of this template can be edited with Powerpoint, no extra software is necessary. Add your own material, put your images in the places assigned for them, adjust the colors, and then you can show your slides to the world, with an animated slide included.


This slide showcases the key financial metrics of International commerce segment. It includes financial metrics such as revenue, Income, EBITDA and EBITDA margin. Coming up with a presentation necessitates that the majority of the effort goes into the content and the message you intend to convey. The visuals of a PowerPoint presentation can only be effective if it supplements and supports the story that is being told. Keeping this in mind our experts created International Commerce International Trade Of Products And Services PPT Presentation CP SS V to reduce the time that goes into designing the presentation. This way, you can concentrate on the message while our designers take care of providing you with the right template for the situation.
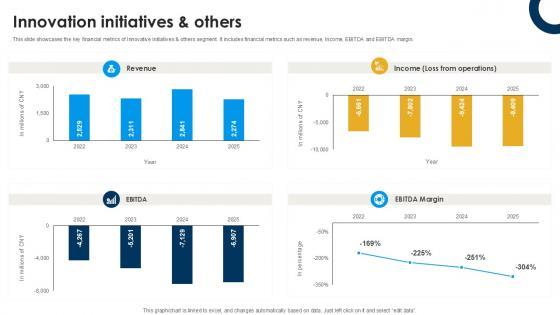
This slide showcases the key financial metrics of Innovative initiatives and others segment. It includes financial metrics such as revenue, Income, EBITDA and EBITDA margin. Formulating a presentation can take up a lot of effort and time, so the content and message should always be the primary focus. The visuals of the PowerPoint can enhance the presenters message, so our Innovation Initiatives And Others International Trade Of Products And Services PPT Example CP SS V was created to help save time. Instead of worrying about the design, the presenter can concentrate on the message while our designers work on creating the ideal templates for whatever situation is needed. Slidegeeks has experts for everything from amazing designs to valuable content, we have put everything into Innovation Initiatives And Others International Trade Of Products And Services PPT Example CP SS V


This slide showcases the Global statistical data of expenses of Alibaba. It showcases an expense of Sales and marketing, General and administrative expenses and Income from operations. If you are looking for a format to display your unique thoughts, then the professionally designed Expenses International Trade Of Products And Services PPT Slide CP SS V is the one for you. You can use it as a Google Slides template or a PowerPoint template. Incorporate impressive visuals, symbols, images, and other charts. Modify or reorganize the text boxes as you desire. Experiment with shade schemes and font pairings. Alter, share or cooperate with other people on your work. Download Expenses International Trade Of Products And Services PPT Slide CP SS V and find out how to give a successful presentation. Present a perfect display to your team and make your presentation unforgettable.
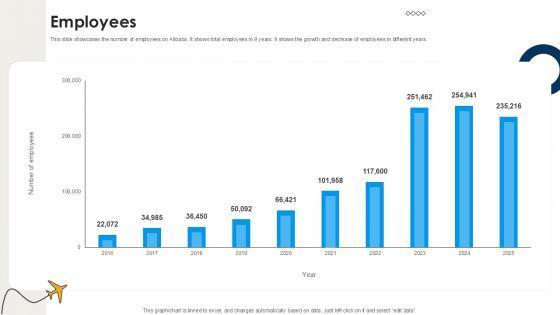

This slide showcases the number of employees on Alibaba. It shows total employees in 9 years. It shows the growth and decrease of employees in different years. Find highly impressive Employees International Trade Of Products And Services PPT Sample CP SS V on Slidegeeks to deliver a meaningful presentation. You can save an ample amount of time using these presentation templates. No need to worry to prepare everything from scratch because Slidegeeks experts have already done a huge research and work for you. You need to download Employees International Trade Of Products And Services PPT Sample CP SS V for your upcoming presentation. All the presentation templates are 100 percent editable and you can change the color and personalize the content accordingly. Download now


This slide showcases the key financial metrics of Digital media and entertainment commerce segment. It includes financial metrics such as revenue, Income, EBITDA and EBITDA margin. Whether you have daily or monthly meetings, a brilliant presentation is necessary. Digital Media And Entertainment International Trade Of Products And Services PPT Example CP SS V can be your best option for delivering a presentation. Represent everything in detail using Digital Media And Entertainment International Trade Of Products And Services PPT Example CP SS V and make yourself stand out in meetings. The template is versatile and follows a structure that will cater to your requirements. All the templates prepared by Slidegeeks are easy to download and edit. Our research experts have taken care of the corporate themes as well. So, give it a try and see the results.
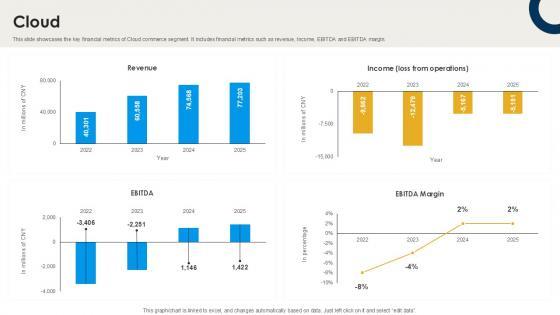

This slide showcases the key financial metrics of Cloud commerce segment. It includes financial metrics such as revenue, Income, EBITDA and EBITDA margin. Do you have to make sure that everyone on your team knows about any specific topic I yes, then you should give Cloud International Trade Of Products And Services PPT Sample CP SS V a try. Our experts have put a lot of knowledge and effort into creating this impeccable Cloud International Trade Of Products And Services PPT Sample CP SS V. You can use this template for your upcoming presentations, as the slides are perfect to represent even the tiniest detail. You can download these templates from the Slidegeeks website and these are easy to edit. So grab these today
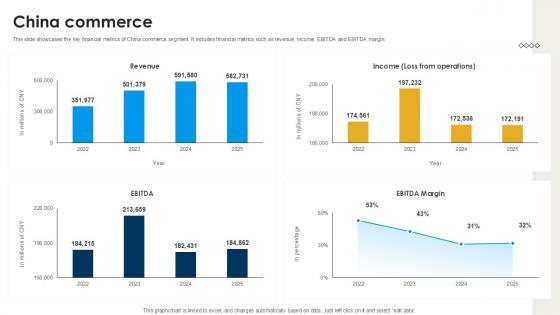

This slide showcases the key financial metrics of China commerce segment. It includes financial metrics such as revenue, Income, EBITDA and EBITDA margin. There are so many reasons you need a China Commerce International Trade Of Products And Services PPT Template CP SS V. The first reason is you can not spend time making everything from scratch, Thus, Slidegeeks has made presentation templates for you too. You can easily download these templates from our website easily.
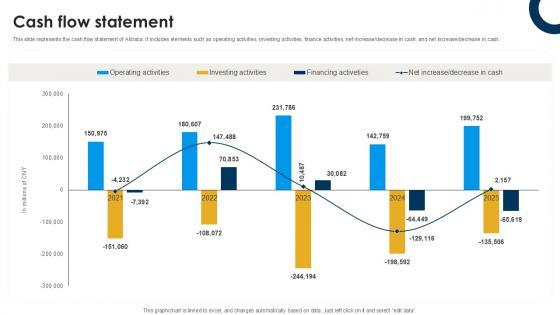
This slide represents the cash flow statement of Alibaba. It includes elements such as operating activities, investing activities, finance activities, net increasedecrease in cash, and net increasedecrease in cash. Want to ace your presentation in front of a live audience Our Cash Flow Statement International Trade Of Products And Services PPT Template CP SS V can help you do that by engaging all the users towards you. Slidegeeks experts have put their efforts and expertise into creating these impeccable powerpoint presentations so that you can communicate your ideas clearly. Moreover, all the templates are customizable, and easy-to-edit and downloadable. Use these for both personal and commercial use.
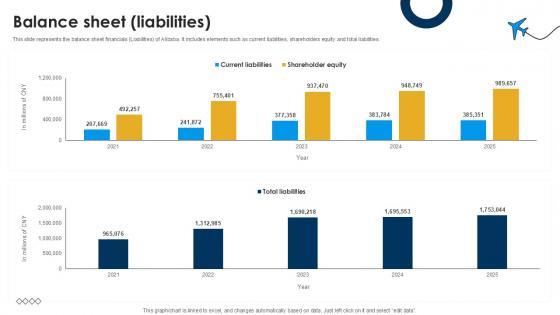

This slide represents the balance sheet financials Liabilities of Alibaba. It includes elements such as current liabilities, shareholders equity and total liabilities. Create an editable Balance Sheet Liabilities International Trade Of Products And Services PPT Presentation CP SS V that communicates your idea and engages your audience. Whether you are presenting a business or an educational presentation, pre-designed presentation templates help save time. Balance Sheet Liabilities International Trade Of Products And Services PPT Presentation CP SS V is highly customizable and very easy to edit, covering many different styles from creative to business presentations. Slidegeeks has creative team members who have crafted amazing templates. So, go and get them without any delay.
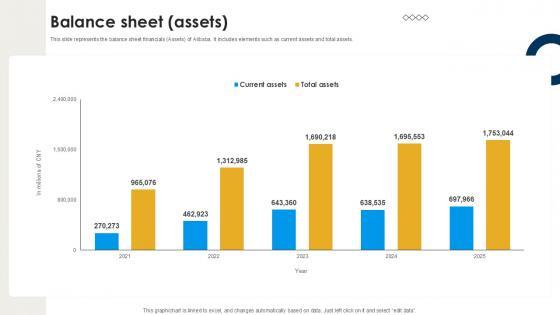

This slide represents the balance sheet financials Assets of Alibaba. It includes elements such as current assets and total assets. Boost your pitch with our creative Balance Sheet Assets International Trade Of Products And Services PPT Presentation CP SS V. Deliver an awe-inspiring pitch that will mesmerize everyone. Using these presentation templates you will surely catch everyones attention. You can browse the ppts collection on our website. We have researchers who are experts at creating the right content for the templates. So you do not have to invest time in any additional work. Just grab the template now and use them.
This slide presents project dashboard for tracking task status or phases of project, that would help to monitor progress. It includes information on ongoing phase, budget, risks, pending tasks etc. Presenting this PowerPoint presentation, titled Project Dashboard For Tracking Schedule Management Techniques PPT Presentation, with topics curated by our researchers after extensive research. This editable presentation is available for immediate download and provides attractive features when used. Download now and captivate your audience. Presenting this Project Dashboard For Tracking Schedule Management Techniques PPT Presentation. Our researchers have carefully researched and created these slides with all aspects taken into consideration. This is a completely customizable Project Dashboard For Tracking Schedule Management Techniques PPT Presentation that is available for immediate downloading. Download now and make an impact on your audience. Highlight the attractive features available with our PPTs.


This slide presents project cost and performance analysis dashboard, that highlights effectiveness of scheduling on output. It provides information on project cost, performance, stages and resource capacity compared with time. Slidegeeks has constructed Project Cost And Performance Schedule Management Techniques PPT Example after conducting extensive research and examination. These presentation templates are constantly being generated and modified based on user preferences and critiques from editors. Here, you will find the most attractive templates for a range of purposes while taking into account ratings and remarks from users regarding the content. This is an excellent jumping-off point to explore our content and will give new users an insight into our top-notch PowerPoint Templates.
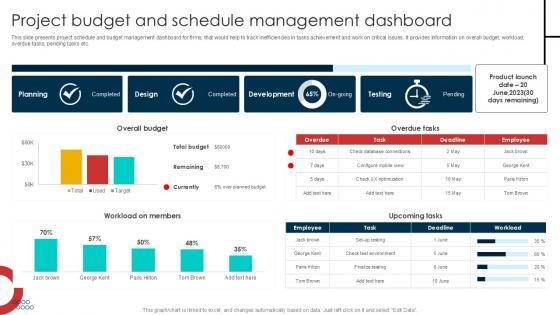

This slide presents project schedule and budget management dashboard for firms, that would help to track inefficiencies in tasks achievement and work on critical issues. It provides information on overall budget, workload, overdue tasks, pending tasks etc. Retrieve professionally designed Project Budget And Schedule Management Techniques PPT Slide to effectively convey your message and captivate your listeners. Save time by selecting pre-made slideshows that are appropriate for various topics, from business to educational purposes. These themes come in many different styles, from creative to corporate, and all of them are easily adjustable and can be edited quickly. Access them as PowerPoint templates or as Google Slides themes. You do not have to go on a hunt for the perfect presentation because Slidegeeks got you covered from everywhere.


This slide presents impact of poor project scheduling on organisation, helpful in determining critical consequences such as project cost overruns, schedule delays and organisational sustainability risks. This Impact Of Poor Project Scheduling On Schedule Management Techniques PPT Example is perfect for any presentation, be it in front of clients or colleagues. It is a versatile and stylish solution for organizing your meetings. The Impact Of Poor Project Scheduling On Schedule Management Techniques PPT Example features a modern design for your presentation meetings. The adjustable and customizable slides provide unlimited possibilities for acing up your presentation. Slidegeeks has done all the homework before launching the product for you. So, do not wait, grab the presentation templates today


This slide presents positive impact of project schedule management on organisation, helpful in delivering projects on time and with minimum budgetary issues. It includes impacts on deadlines, feedback, resource allocation and cost performance index. This modern and well-arranged Impact Of Good Project Scheduling On Schedule Management Techniques PPT Template provides lots of creative possibilities. It is very simple to customize and edit with the Powerpoint Software. Just drag and drop your pictures into the shapes. All facets of this template can be edited with Powerpoint, no extra software is necessary. Add your own material, put your images in the places assigned for them, adjust the colors, and then you can show your slides to the world, with an animated slide included.
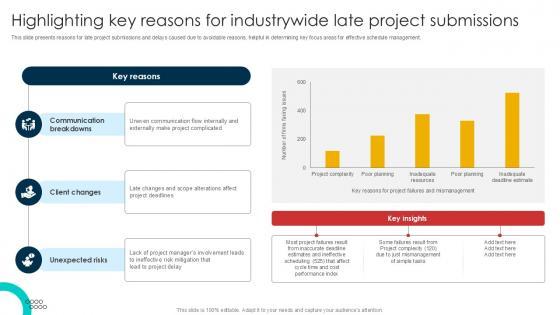

This slide presents reasons for late project submissions and delays caused due to avoidable reasons, helpful in determining key focus areas for effective schedule management. If you are looking for a format to display your unique thoughts, then the professionally designed Highlighting Key Reasons For Schedule Management Techniques PPT Presentation is the one for you. You can use it as a Google Slides template or a PowerPoint template. Incorporate impressive visuals, symbols, images, and other charts. Modify or reorganize the text boxes as you desire. Experiment with shade schemes and font pairings. Alter, share or cooperate with other people on your work. Download Highlighting Key Reasons For Schedule Management Techniques PPT Presentation and find out how to give a successful presentation. Present a perfect display to your team and make your presentation unforgettable.


This slide presents cost analysis with overall budget measurement of multiple projects handled by firm. It provides information on planned budget, actual cost incurred, profit and overall improvement in performance from similar projects handled earlier. From laying roadmaps to briefing everything in detail, our templates are perfect for you. You can set the stage with your presentation slides. All you have to do is download these easy-to-edit and customizable templates. Cost Analysis With Overall Budget Schedule Management Techniques PPT PowerPoint will help you deliver an outstanding performance that everyone would remember and praise you for. Do download this presentation today.
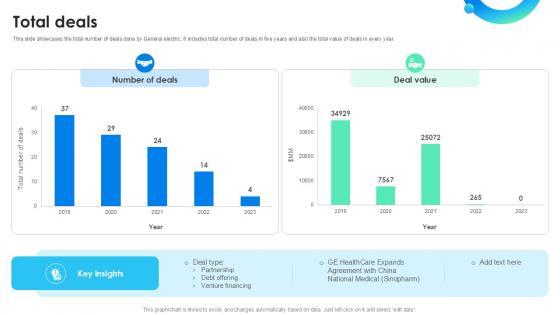

This slide showcases the total number of deals done by General electric. It includes total number of deals in five years and also the total value of deals in every year. Slidegeeks is here to make your presentations a breeze with Total Deals Global Energy Company Profile PPT Example CP SS V With our easy-to-use and customizable templates, you can focus on delivering your ideas rather than worrying about formatting. With a variety of designs to choose from, you are sure to find one that suits your needs. And with animations and unique photos, illustrations, and fonts, you can make your presentation pop. So whether you are giving a sales pitch or presenting to the board, make sure to check out Slidegeeks first


This slide showcases the revenue of General electric. Total revenue is total amount of money that a company earns through the selling of its goods and services, over a time period. Want to ace your presentation in front of a live audience Our Revenue Global Energy Company Profile PPT Sample CP SS V can help you do that by engaging all the users towards you. Slidegeeks experts have put their efforts and expertise into creating these impeccable powerpoint presentations so that you can communicate your ideas clearly. Moreover, all the templates are customizable, and easy-to-edit and downloadable. Use these for both personal and commercial use.


This slide showcases the revenueby segment of General electric. Total revenue is total amount of money that a company earns through the selling of its goods and services, over a time period. Slidegeeks is one of the best resources for PowerPoint templates. You can download easily and regulate Revenue By Segment Global Energy Company Profile PPT Slide CP SS V for your personal presentations from our wonderful collection. A few clicks is all it takes to discover and get the most relevant and appropriate templates. Use our Templates to add a unique zing and appeal to your presentation and meetings. All the slides are easy to edit and you can use them even for advertisement purposes.
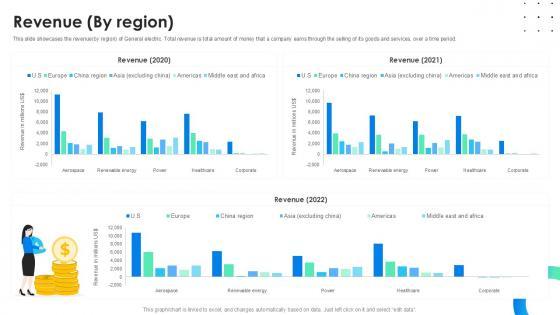
This slide showcases the revenueby region of General electric. Total revenue is total amount of money that a company earns through the selling of its goods and services, over a time period. Create an editable Revenue By Region Global Energy Company Profile PPT Sample CP SS V that communicates your idea and engages your audience. Whether you are presenting a business or an educational presentation, pre-designed presentation templates help save time. Revenue By Region Global Energy Company Profile PPT Sample CP SS V is highly customizable and very easy to edit, covering many different styles from creative to business presentations. Slidegeeks has creative team members who have crafted amazing templates. So, go and get them without any delay.


This slide showcases the Global statistical data of operating expenses of General electric. It showcases an expense that a business incurs through its normal business operations. Here you can discover an assortment of the finest PowerPoint and Google Slides templates. With these templates, you can create presentations for a variety of purposes while simultaneously providing your audience with an eye-catching visual experience. Download Operating Expenses Global Energy Company Profile PPT Slide CP SS V to deliver an impeccable presentation. These templates will make your job of preparing presentations much quicker, yet still, maintain a high level of quality. Slidegeeks has experienced researchers who prepare these templates and write high-quality content for you. Later on, you can personalize the content by editing the Operating Expenses Global Energy Company Profile PPT Slide CP SS V.
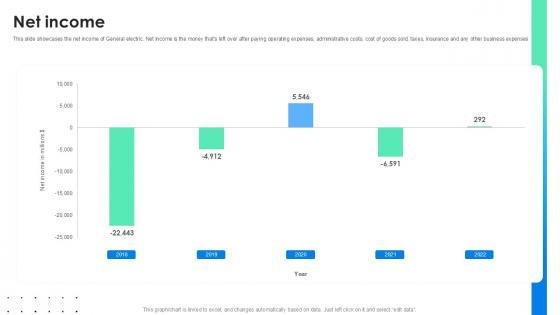

This slide showcases the net income of General electric. Net income is the money thats left over after paying operating expenses, administrative costs, cost of goods sold, taxes, insurance and any other business expenses. Slidegeeks has constructed Net Income Global Energy Company Profile PPT Sample CP SS V after conducting extensive research and examination. These presentation templates are constantly being generated and modified based on user preferences and critiques from editors. Here, you will find the most attractive templates for a range of purposes while taking into account ratings and remarks from users regarding the content. This is an excellent jumping-off point to explore our content and will give new users an insight into our top-notch PowerPoint Templates.

This slide showcases the sales of General electric. It includes sales growth of five years. Sales growth measures the ability of sales team to increase revenue over a fixed period of time and also depicts net income growth. Explore a selection of the finest Key Financial Chart Global Energy Company Profile PPT Example CP SS V here. With a plethora of professionally designed and pre-made slide templates, you can quickly and easily find the right one for your upcoming presentation. You can use our Key Financial Chart Global Energy Company Profile PPT Example CP SS V to effectively convey your message to a wider audience. Slidegeeks has done a lot of research before preparing these presentation templates. The content can be personalized and the slides are highly editable. Grab templates today from Slidegeeks.


This slides showcases the financial analysis of renewable energy segment. It includes financial statements such as revenue, profit, segment FCF and orders and backlog. Crafting an eye-catching presentation has never been more straightforward. Let your presentation shine with this tasteful yet straightforward Financial Statement Renewable Energy Global Energy Company Profile PPT Slide CP SS V template. It offers a minimalistic and classy look that is great for making a statement. The colors have been employed intelligently to add a bit of playfulness while still remaining professional. Construct the ideal Financial Statement Renewable Energy Global Energy Company Profile PPT Slide CP SS V that effortlessly grabs the attention of your audience Begin now and be certain to wow your customers
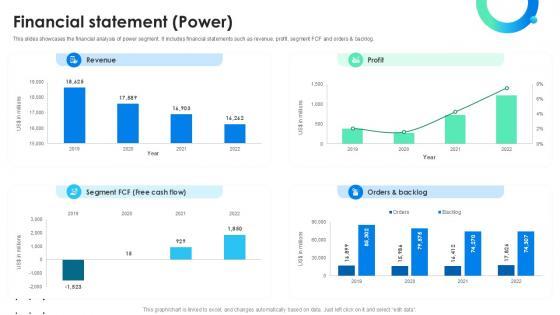

This slides showcases the financial analysis of power segment. It includes financial statements such as revenue, profit, segment FCF and orders and backlog. Are you in need of a template that can accommodate all of your creative concepts This one is crafted professionally and can be altered to fit any style. Use it with Google Slides or PowerPoint. Include striking photographs, symbols, depictions, and other visuals. Fill, move around, or remove text boxes as desired. Test out color palettes and font mixtures. Edit and save your work, or work with colleagues. Download Financial Statement Power Global Energy Company Profile PPT Presentation CP SS V and observe how to make your presentation outstanding. Give an impeccable presentation to your group and make your presentation unforgettable.


This slides showcases the financial analysis of Healthcare segment. It includes financial statements such as revenue, profit, segment FCF and orders and backlog. If you are looking for a format to display your unique thoughts, then the professionally designed Financial Statement Healthcare Global Energy Company Profile PPT Template CP SS V is the one for you. You can use it as a Google Slides template or a PowerPoint template. Incorporate impressive visuals, symbols, images, and other charts. Modify or reorganize the text boxes as you desire. Experiment with shade schemes and font pairings. Alter, share or cooperate with other people on your work. Download Financial Statement Healthcare Global Energy Company Profile PPT Template CP SS V and find out how to give a successful presentation. Present a perfect display to your team and make your presentation unforgettable.
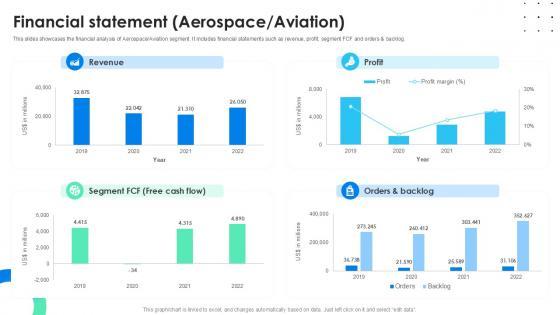

This slides showcases the financial analysis of Aerospace Aviation segment. It includes financial statements such as revenue, profit, segment FCF and orders and backlog. If your project calls for a presentation, then Slidegeeks is your go-to partner because we have professionally designed, easy-to-edit templates that are perfect for any presentation. After downloading, you can easily edit Financial Statement Aerospace Aviation Global Energy Company Profile PPT Presentation CP SS V and make the changes accordingly. You can rearrange slides or fill them with different images. Check out all the handy templates
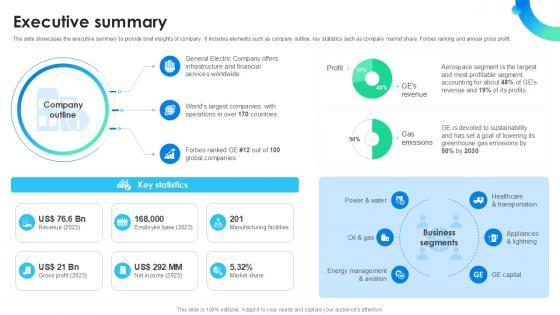

The slide showcases the executive summary to provide brief insights of company. It includes elements such as company outline, key statistics such as company market share, Forbes ranking and annual gross profit. Whether you have daily or monthly meetings, a brilliant presentation is necessary. Executive Summary Global Energy Company Profile PPT Slide CP SS V can be your best option for delivering a presentation. Represent everything in detail using Executive Summary Global Energy Company Profile PPT Slide CP SS V and make yourself stand out in meetings. The template is versatile and follows a structure that will cater to your requirements. All the templates prepared by Slidegeeks are easy to download and edit. Our research experts have taken care of the corporate themes as well. So, give it a try and see the results.
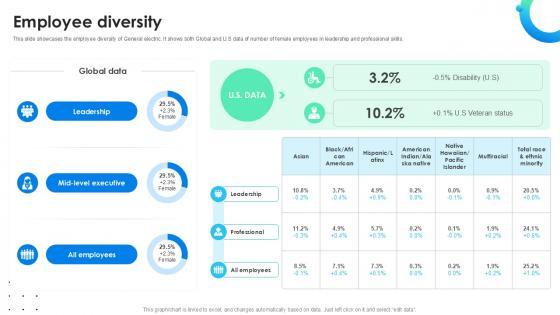

This slide showcases the employee diversity of General electric. It shows both Global and U.S data of number of female employees in leadership and professional skills. Do you have an important presentation coming up Are you looking for something that will make your presentation stand out from the rest Look no further than Employee Diversity Global Energy Company Profile PPT Sample CP SS V. With our professional designs, you can trust that your presentation will pop and make delivering it a smooth process. And with Slidegeeks, you can trust that your presentation will be unique and memorable. So why wait Grab Employee Diversity Global Energy Company Profile PPT Sample CP SS V today and make your presentation stand out from the rest


This slide showcases the earning per share of General electric. It includes earning per share of both basic and diluted. Slidegeeks is here to make your presentations a breeze with Earning Per Share Global Energy Company Profile PPT Example CP SS V With our easy-to-use and customizable templates, you can focus on delivering your ideas rather than worrying about formatting. With a variety of designs to choose from, you are sure to find one that suits your needs. And with animations and unique photos, illustrations, and fonts, you can make your presentation pop. So whether you are giving a sales pitch or presenting to the board, make sure to check out Slidegeeks first
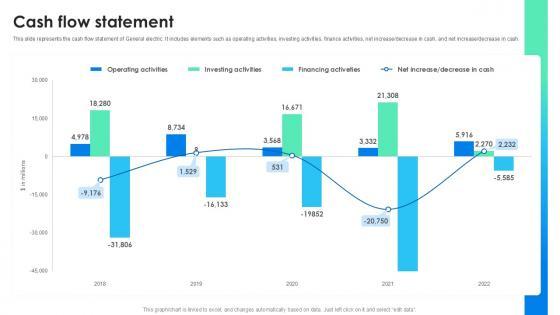

This slide represents the cash flow statement of General electric. It includes elements such as operating activities, investing activities, finance activities, net increase decrease in cash, and net increase decrease in cash. There are so many reasons you need a Cash Flow Statement Global Energy Company Profile PPT Presentation CP SS V. The first reason is you can not spend time making everything from scratch, Thus, Slidegeeks has made presentation templates for you too. You can easily download these templates from our website easily.


This slide represents the balance sheet financials Liabilities of General electric. It includes elements such as shareholders equity and total liabilities. Slidegeeks is one of the best resources for PowerPoint templates. You can download easily and regulate Balance Sheet Liabilities Global Energy Company Profile PPT PowerPoint CP SS V for your personal presentations from our wonderful collection. A few clicks is all it takes to discover and get the most relevant and appropriate templates. Use our Templates to add a unique zing and appeal to your presentation and meetings. All the slides are easy to edit and you can use them even for advertisement purposes.
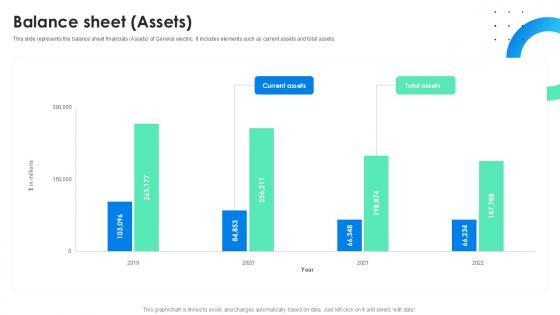

This slide represents the balance sheet financials Assets of General electric. It includes elements such as current assets and total assets. Create an editable Balance Sheet Assets Global Energy Company Profile PPT Slide CP SS V that communicates your idea and engages your audience. Whether you are presenting a business or an educational presentation, pre-designed presentation templates help save time. Balance Sheet Assets Global Energy Company Profile PPT Slide CP SS V is highly customizable and very easy to edit, covering many different styles from creative to business presentations. Slidegeeks has creative team members who have crafted amazing templates. So, go and get them without any delay.


Following slide depicts dashboard that includes metrics helping managers to identify sales patterns and overall performance of company. Welcome to our selection of the KPI Dashboard To Track Current Sales Sample Pitch Deck For Video Ppt Example. These are designed to help you showcase your creativity and bring your sphere to life. Planning and Innovation are essential for any business that is just starting out. This collection contains the designs that you need for your everyday presentations. All of our PowerPoints are 100Percent editable, so you can customize them to suit your needs. This multi-purpose template can be used in various situations. Grab these presentation templates today.
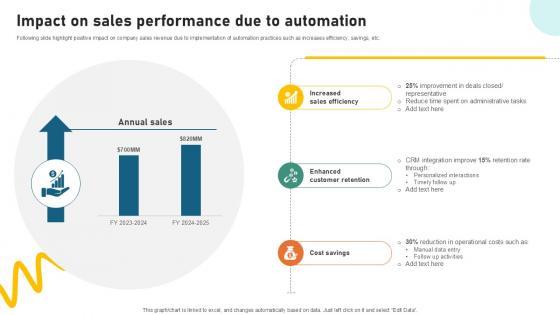

Following slide highlight positive impact on company sales revenue due to implementation of automation practices such as increases efficiency, savings, etc. If you are looking for a format to display your unique thoughts, then the professionally designed Impact On Sales Performance Due Sample Pitch Deck For Video Ppt Powerpoint is the one for you. You can use it as a Google Slides template or a PowerPoint template. Incorporate impressive visuals, symbols, images, and other charts. Modify or reorganize the text boxes as you desire. Experiment with shade schemes and font pairings. Alter, share or cooperate with other people on your work. Download Impact On Sales Performance Due Sample Pitch Deck For Video Ppt Powerpoint and find out how to give a successful presentation. Present a perfect display to your team and make your presentation unforgettable.


Following slide highlights major problems faced by sales department of company due to outdated and inefficient processes. Present like a pro with Determining Challenges Faced Sample Pitch Deck For Video Ppt Sample. Create beautiful presentations together with your team, using our easy-to-use presentation slides. Share your ideas in real-time and make changes on the fly by downloading our templates. So whether you are in the office, on the go, or in a remote location, you can stay in sync with your team and present your ideas with confidence. With Slidegeeks presentation got a whole lot easier. Grab these presentations today.
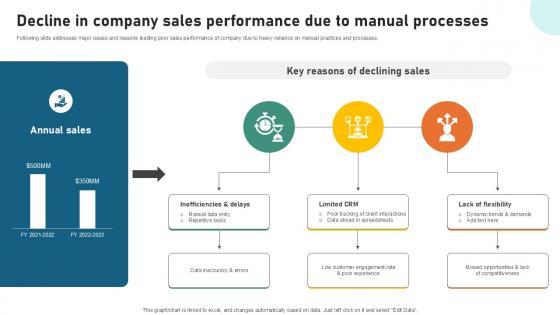

Following slide addresses major issues and reasons leading poor sales performance of company due to heavy reliance on manual practices and processes. From laying roadmaps to briefing everything in detail, our templates are perfect for you. You can set the stage with your presentation slides. All you have to do is download these easy-to-edit and customizable templates. Decline In Company Sales Sample Pitch Deck For Video Ppt Sample will help you deliver an outstanding performance that everyone would remember and praise you for. Do download this presentation today.
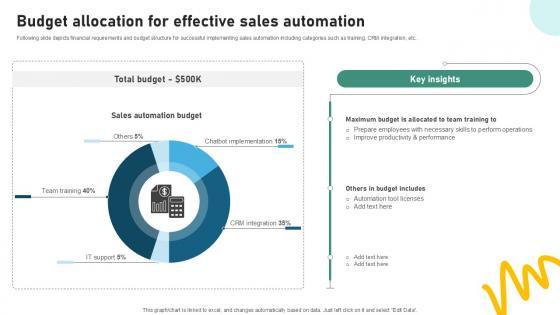

Following slide depicts financial requirements and budget structure for successful implementing sales automation including categories such as training, CRM integration, etc. Want to ace your presentation in front of a live audience Our Budget Allocation For Effective Sample Pitch Deck For Video Ppt Presentation can help you do that by engaging all the users towards you. Slidegeeks experts have put their efforts and expertise into creating these impeccable powerpoint presentations so that you can communicate your ideas clearly. Moreover, all the templates are customizable, and easy-to-edit and downloadable. Use these for both personal and commercial use.


This slide highlights graphs that can help organization to determine ideal time and day for cold calling customers. Identifying ideal time for cold calling can help to increase the conversation sales of inside sales strategy. Formulating a presentation can take up a lot of effort and time, so the content and message should always be the primary focus. The visuals of the PowerPoint can enhance the presenters message, so our Ideal Time For Customer Cold Calling Inside Vs Outside Sales PPT Example Strategy SS V was created to help save time. Instead of worrying about the design, the presenter can concentrate on the message while our designers work on creating the ideal templates for whatever situation is needed. Slidegeeks has experts for everything from amazing designs to valuable content, we have put everything into Ideal Time For Customer Cold Calling Inside Vs Outside Sales PPT Example Strategy SS V


This slide showcases ideal time and day that can help organization to send cold emails to customers and generate sales. Sending email on ideal day and time can help to increase the lead conversion rate for sales department. Whether you have daily or monthly meetings, a brilliant presentation is necessary. Determining Ideal Time To Send Cold Inside Vs Outside Sales PPT Slide Strategy SS V can be your best option for delivering a presentation. Represent everything in detail using Determining Ideal Time To Send Cold Inside Vs Outside Sales PPT Slide Strategy SS V and make yourself stand out in meetings. The template is versatile and follows a structure that will cater to your requirements. All the templates prepared by Slidegeeks are easy to download and edit. Our research experts have taken care of the corporate themes as well. So, give it a try and see the results.
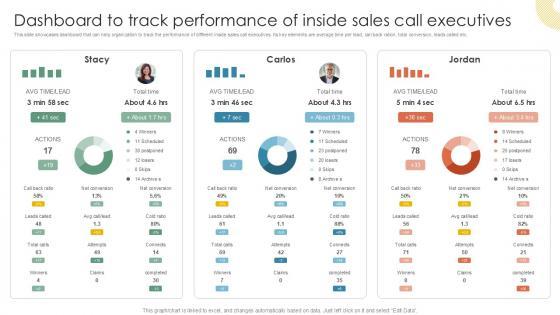
This slide showcases dashboard that can help organization to track the performance of different inside sales call executives. Its key elements are average time per lead, call back ration, total conversion, leads called etc. Do you have an important presentation coming up Are you looking for something that will make your presentation stand out from the rest Look no further than Dashboard To Track Performance Of Inside Vs Outside Sales PPT PowerPoint Strategy SS V. With our professional designs, you can trust that your presentation will pop and make delivering it a smooth process. And with Slidegeeks, you can trust that your presentation will be unique and memorable. So why wait Grab Dashboard To Track Performance Of Inside Vs Outside Sales PPT PowerPoint Strategy SS V today and make your presentation stand out from the rest


This slide showcases dashboard that can help business to track the performance of cold email marketing. Its key components are campaign performance, list subscribers, average unsubscribe rate and conversion rate. Slidegeeks is here to make your presentations a breeze with Dashboard To Track Cold Email Inside Vs Outside Sales PPT Example Strategy SS V With our easy-to-use and customizable templates, you can focus on delivering your ideas rather than worrying about formatting. With a variety of designs to choose from, you are sure to find one that suits your needs. And with animations and unique photos, illustrations, and fonts, you can make your presentation pop. So whether you are giving a sales pitch or presenting to the board, make sure to check out Slidegeeks first
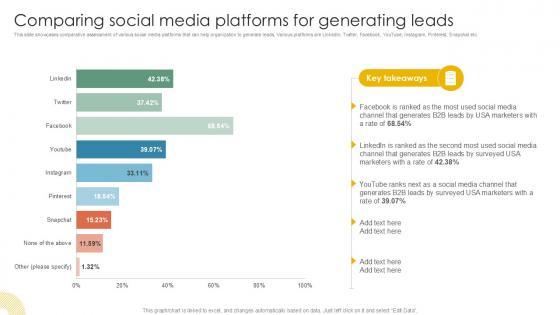
This slide showcases comparative assessment of various social media platforms that can help organization to generate leads, Various platforms are LinkedIn, Twitter, Facebook, YouTube, Instagram, Pinterest, Snapchat etc. Get a simple yet stunning designed Comparing Social Media Platforms Inside Vs Outside Sales PPT Slide Strategy SS V. It is the best one to establish the tone in your meetings. It is an excellent way to make your presentations highly effective. So, download this PPT today from Slidegeeks and see the positive impacts. Our easy-to-edit Comparing Social Media Platforms Inside Vs Outside Sales PPT Slide Strategy SS V can be your go-to option for all upcoming conferences and meetings. So, what are you waiting for Grab this template today.


This slide represents the security in Infrastructure as Code tracking dashboard. The key components include container image, misconfigured workload, risk assets, failed codes by credentials, transit, valuable public interface, etc. Here you can discover an assortment of the finest PowerPoint and Google Slides templates. With these templates, you can create presentations for a variety of purposes while simultaneously providing your audience with an eye-catching visual experience. Download Infrastructure As Code Security IAC Tools For Performance Analysis PPT Slide to deliver an impeccable presentation. These templates will make your job of preparing presentations much quicker, yet still, maintain a high level of quality. Slidegeeks has experienced researchers who prepare these templates and write high-quality content for you. Later on, you can personalize the content by editing the Infrastructure As Code Security IAC Tools For Performance Analysis PPT Slide.


This slide depicts the global market analysis of infrastructure as code. The purpose of this slide is to highlight market size by components, global market by approaches, global market by end users, etc. The Global Market Analysis Of Infrastructure IAC Tools For Performance Analysis PPT Presentation is a compilation of the most recent design trends as a series of slides. It is suitable for any subject or industry presentation, containing attractive visuals and photo spots for businesses to clearly express their messages. This template contains a variety of slides for the user to input data, such as structures to contrast two elements, bullet points, and slides for written information. Slidegeeks is prepared to create an impression.
SHOW
- 60
- 120
- 180
DISPLAYING: 60 of 10000 Item(s)
Page