AI PPT Maker
 Templates
 PPT Bundles
 Design Services
 Business PPTs
 Business Plan
 Management
 Strategy
 Introduction PPT
 Roadmap
 Self Introduction
 Timelines
 Process
 Marketing
 Agenda
 Technology
 Medical
 Startup Business Plan
 Cyber Security
 Dashboards
 SWOT
SWOT Proposals
 Education
 Pitch Deck
 Digital Marketing
 KPIs
KPIs Project Management
 Product Management
 Artificial Intelligence
 Target Market
 Communication
 Supply Chain
 Google Slides
 Research Services
 One Pagers
 All Categories
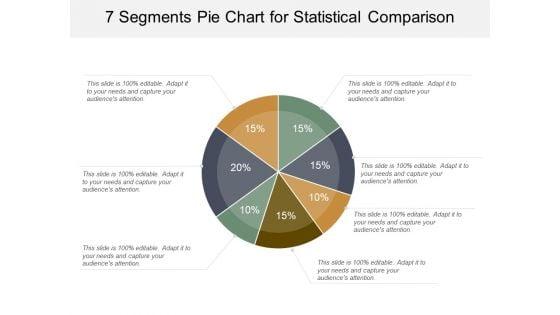
7 Segments Pie Chart For Statistical Comparison Ppt PowerPoint Presentation Gallery Visual Aids


Features of these PowerPoint presentation slides:
This is a 7 segments pie chart for statistical comparison ppt powerpoint presentation gallery visual aids. This is a seven stage process. The stages in this process are 6 piece pie chart, 6 segment pie chart, 6 parts pie chart.
People who downloaded this PowerPoint presentation also viewed the following :
Keywords:
Related Products
7 Segments Pie Chart For Statistical Comparison Ppt PowerPoint Presentation Gallery Visual Aids with all 6 slides: