- Sign up
- Sign In
 AI PPT Maker
 Templates
 PPT Bundles
 Design Services
 Business PPTs
 Business Plan
 Management
 Strategy
 Introduction PPT
 Roadmap
 Self Introduction
 Timelines
 Process
 Marketing
 Agenda
 Technology
 Medical
 Startup Business Plan
 Cyber Security
 Dashboards
 SWOT
SWOT Proposals
 Education
 Pitch Deck
 Digital Marketing
 KPIs
KPIs Project Management
 Product Management
 Artificial Intelligence
 Target Market
 Communication
 Supply Chain
 Google Slides
 Research Services
 One Pagers
 All Categories
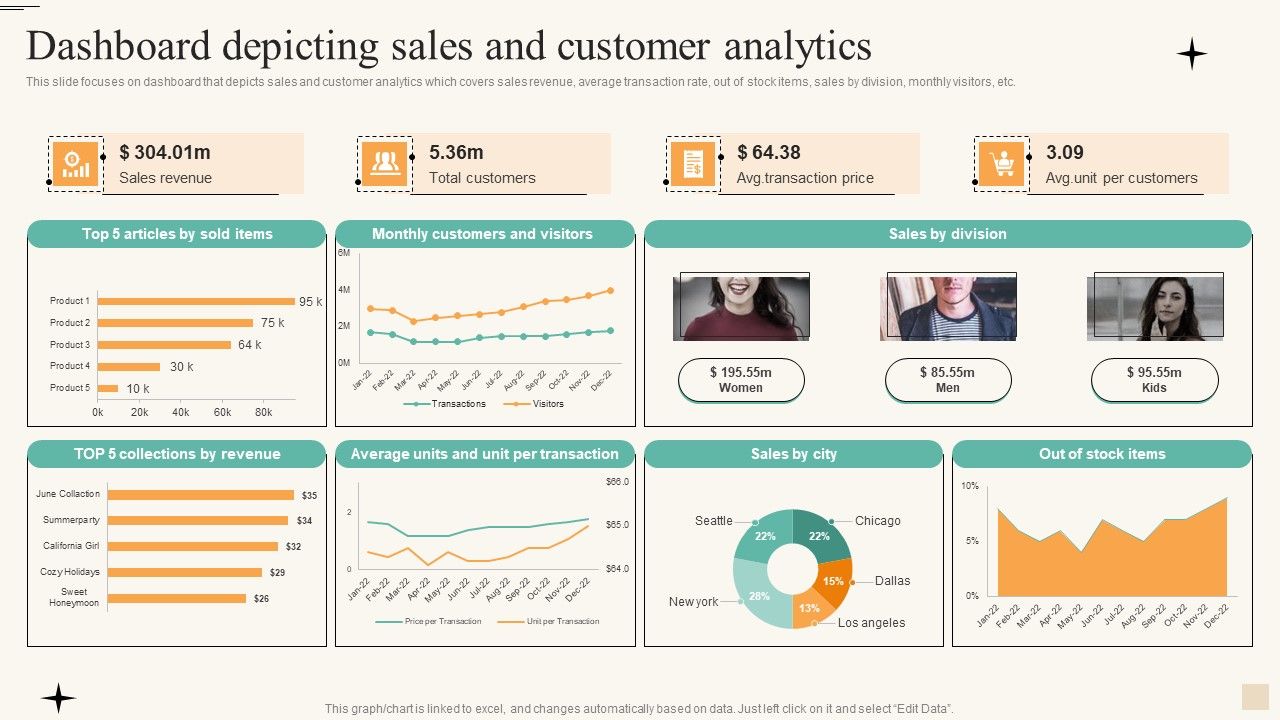
Dashboard Depicting Sales And Customer Analytics Infographics PDF


Features of these PowerPoint presentation slides:
This slide focuses on dashboard that depicts sales and customer analytics which covers sales revenue, average transaction rate, out of stock items, sales by division, monthly visitors, etc. If you are looking for a format to display your unique thoughts, then the professionally designed Dashboard Depicting Sales And Customer Analytics Infographics PDF is the one for you. You can use it as a Google Slides template or a PowerPoint template. Incorporate impressive visuals, symbols, images, and other charts. Modify or reorganize the text boxes as you desire. Experiment with shade schemes and font pairings. Alter, share or cooperate with other people on your work. Download Dashboard Depicting Sales And Customer Analytics Infographics PDF and find out how to give a successful presentation. Present a perfect display to your team and make your presentation unforgettable.
People who downloaded this PowerPoint presentation also viewed the following :
Related Products
Dashboard Depicting Sales And Customer Analytics Infographics PDF with all 2 slides: