AI PPT Maker
Templates
PPT Bundles
Design Services
Business PPTs
Business Plan
Management
Strategy
Introduction PPT
Roadmap
Self Introduction
Timelines
Process
Marketing
Agenda
Technology
Medical
Startup Business Plan
Cyber Security
Dashboards
SWOT
Proposals
Education
Pitch Deck
Digital Marketing
KPIs
Project Management
Product Management
Artificial Intelligence
Target Market
Communication
Supply Chain
Google Slides
Research Services
 One Pagers
All Categories
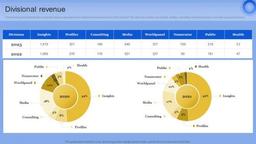
The following slide highlights the comparative revenue generated from multiple business divisions for 2020 and 2021. The divisions included are insights, profiles, consulting, media, world panel, numerator and public services
Features of these PowerPoint presentation slides:
The following slide highlights the comparative revenue generated from multiple business divisions for 2020 and 2021. The divisions included are insights, profiles, consulting, media, world panel, numerator and public services From laying roadmaps to briefing everything in detail, our templates are perfect for you. You can set the stage with your presentation slides. All you have to do is download these easy-to-edit and customizable templates. Divisional Revenue Data Analytics Company Outline Pictures PDF will help you deliver an outstanding performance that everyone would remember and praise you for. Do download this presentation today. The following slide highlights the comparative revenue generated from multiple business divisions for 2020 and 2021. The divisions included are insights, profiles, consulting, media, world panel, numerator and public services
People who downloaded this PowerPoint presentation also viewed the following :
Keywords:
Related Products
Divisional Revenue Data Analytics Company Outline Pictures PDF with all 10 slides:
Use our Divisional Revenue Data Analytics Company Outline Pictures PDF to effectively help you save your valuable time. They are readymade to fit into any presentation structure.
Ratings and Reviews
4.5
- ★53
- ★41
- ★30
- ★20
- ★10
Write a review
Most Relevant Reviews
by Clint Perry
January 30, 2024
Very well designed and informative templates.by Michael Allen
January 29, 2024
Great designs, really helpful.by Jacob Wilson
January 29, 2024
Innovative and attractive designs.by Earl Contreras
January 29, 2024
The content is very helpful from business point of view.
View per page:
10


