 AI PPT Maker
 Templates
 PPT Bundles
 Design Services
 Business PPTs
 Business Plan
 Management
 Strategy
 Introduction PPT
 Roadmap
 Self Introduction
 Timelines
 Process
 Marketing
 Agenda
 Technology
 Medical
 Startup Business Plan
 Cyber Security
 Dashboards
 SWOT
SWOT Proposals
 Education
 Pitch Deck
 Digital Marketing
 KPIs
KPIs Project Management
 Product Management
 Artificial Intelligence
 Target Market
 Communication
 Supply Chain
 Google Slides
 Research Services
 One Pagers
 All Categories
Excel templates PowerPoint Templates
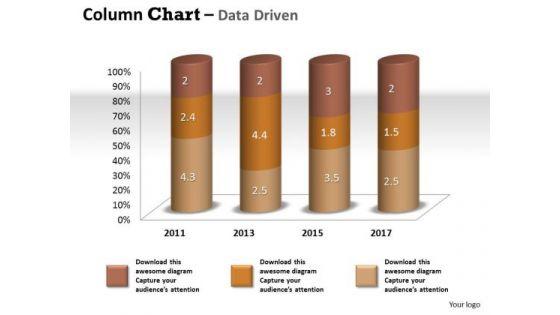
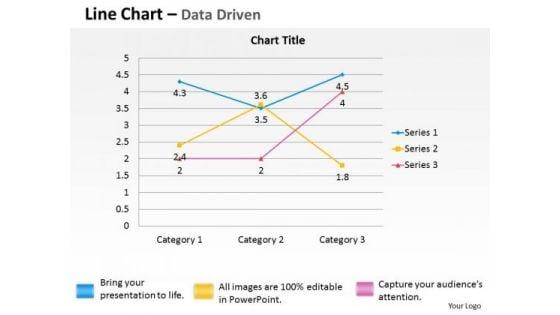
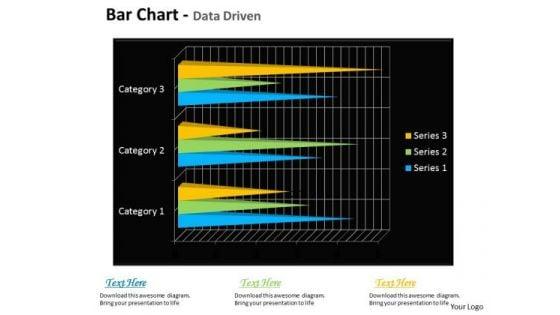
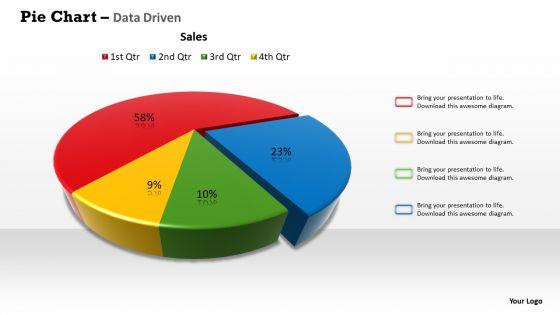
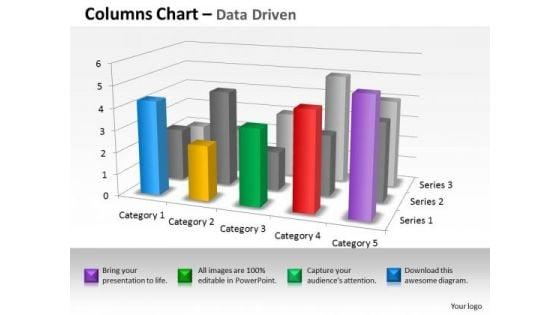
Excel is a remarkably effective tool, and we have a professionally designed collection of PowerPoint templates that you can use in your presentation. Using our PPT presentation slides, you can demonstrate to your audience how it can help them improve their productivity, track and monitor the progress of a project, and more. With the help of our amazing layouts, you will be able to present crucial data in ways that make sense, with charts and graphs that contextualize reports and make them more effective for internal communication. Even if you manage a team of different professionals, our set of PowerPoint templates can help you keep everyone informed and monitor project progress. You can deploy these eye-catching layout designs to showcase an event's timeline. Our pre-designed PPT layouts are easy to modify, so you can create presentations that fit the needs of your target audience. So if you want to create an impressive business presentation, why not give these brilliant templates a try?
SHOW
- 60
- 120
- 180
DISPLAYING: 60 of 180 Item(s)
Page


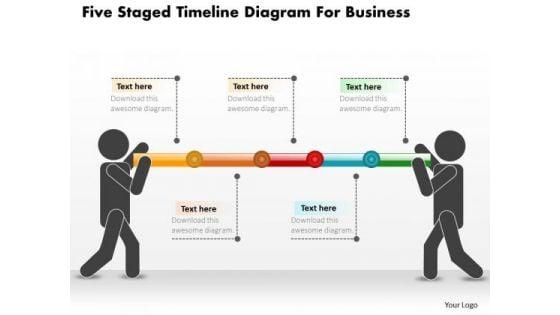

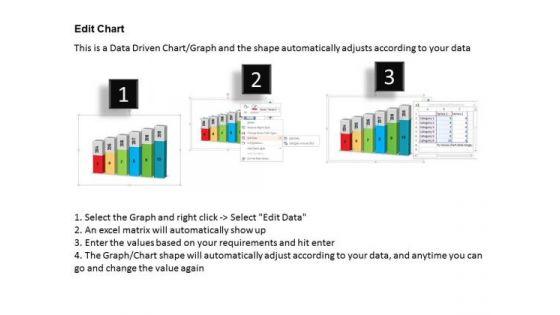
This PowerPoint template displays five points timeline diagram. This business diagram has been designed with graphic of timeline with five points, text space and start, end points. Use this diagram, in your presentations to display process steps, stages, timelines and business management. Make wonderful presentations using this business slide.


SHOW
- 60
- 120
- 180
DISPLAYING: 60 of 180 Item(s)
Page