 AI PPT Maker
 Templates
 PPT Bundles
 Design Services
 Business PPTs
 Business Plan
 Management
 Strategy
 Introduction PPT
 Roadmap
 Self Introduction
 Timelines
 Process
 Marketing
 Agenda
 Technology
 Medical
 Startup Business Plan
 Cyber Security
 Dashboards
 SWOT
SWOT Proposals
 Education
 Pitch Deck
 Digital Marketing
 KPIs
KPIs Project Management
 Product Management
 Artificial Intelligence
 Target Market
 Communication
 Supply Chain
 Google Slides
 Research Services
 One Pagers
 All Categories
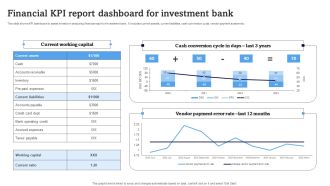
Financial KPI Report Dashboard For Investment Bank Structure Pdf
This slide shows KPI dashboard to assist investor in analyzing financial report of investment bank. It includes current assets, current liabilities, cash conversion cycle, vendor payment system etc.


Features of these PowerPoint presentation slides:
This slide shows KPI dashboard to assist investor in analyzing financial report of investment bank. It includes current assets, current liabilities, cash conversion cycle, vendor payment system etc. Showcasing this set of slides titled Financial KPI Report Dashboard For Investment Bank Structure Pdf. The topics addressed in these templates are Current Working Capital, Cash Conversion Cycle Days, Vendor Payment Error Rate. All the content presented in this PPT design is completely editable. Download it and make adjustments in color, background, font etc. as per your unique business setting. This slide shows KPI dashboard to assist investor in analyzing financial report of investment bank. It includes current assets, current liabilities, cash conversion cycle, vendor payment system etc.
People who downloaded this PowerPoint presentation also viewed the following :
Related Products
Financial KPI Report Dashboard For Investment Bank Structure Pdf with all 10 slides:


