- Sign up
- Sign In
 AI PPT Maker
 Templates
 PPT Bundles
 Design Services
 Business PPTs
 Business Plan
 Management
 Strategy
 Introduction PPT
 Roadmap
 Self Introduction
 Timelines
 Process
 Marketing
 Agenda
 Technology
 Medical
 Startup Business Plan
 Cyber Security
 Dashboards
 SWOT
SWOT Proposals
 Education
 Pitch Deck
 Digital Marketing
 KPIs
KPIs Project Management
 Product Management
 Artificial Intelligence
 Target Market
 Communication
 Supply Chain
 Google Slides
 Research Services
 One Pagers
 All Categories
Graphical Representation Of Research IT D3 Data Driven Documents Infographics PDF

Features of these PowerPoint presentation slides:
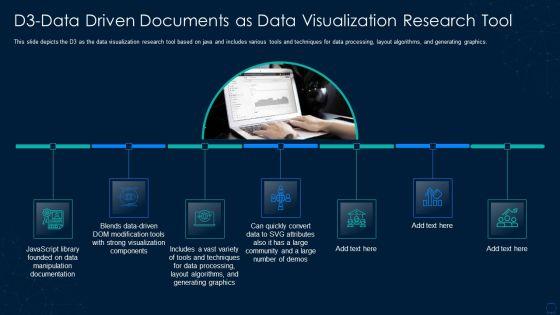
This slide depicts the D3 as the data visualization research tool based on java and includes various tools and techniques for data processing, layout algorithms, and generating graphics. Presenting graphical representation of research it d3 data driven documents infographics pdf to provide visual cues and insights. Share and navigate important information on seven stages that need your due attention. This template can be used to pitch topics like documentation, graphics, techniques, community. In addtion, this PPT design contains high resolution images, graphics, etc, that are easily editable and available for immediate download.
People who downloaded this PowerPoint presentation also viewed the following :
Graphical Representation Of Research IT D3 Data Driven Documents Infographics PDF with all 2 slides: