AI PPT Maker
 Templates
 PPT Bundles
 Design Services
 Business PPTs
 Business Plan
 Management
 Strategy
 Introduction PPT
 Roadmap
 Self Introduction
 Timelines
 Process
 Marketing
 Agenda
 Technology
 Medical
 Startup Business Plan
 Cyber Security
 Dashboards
 SWOT
SWOT Proposals
 Education
 Pitch Deck
 Digital Marketing
 KPIs
KPIs Project Management
 Product Management
 Artificial Intelligence
 Target Market
 Communication
 Supply Chain
 Google Slides
 Research Services
 One Pagers
 All Categories
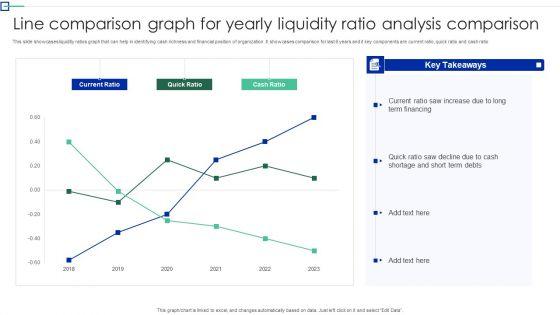
Line Comparison Graph For Yearly Liquidity Ratio Analysis Comparison Topics PDF


Features of these PowerPoint presentation slides:
This slide showcases liquidity ratios graph that can help in identifying cash richness and financial position of organization. It showcases comparison for last 6 years and it key components are current ratio, quick ratio and cash ratio. Showcasing this set of slides titled Line Comparison Graph For Yearly Liquidity Ratio Analysis Comparison Topics PDF. The topics addressed in these templates are Term Financing, Cash Shortage, Cash Ratio. All the content presented in this PPT design is completely editable. Download it and make adjustments in color, background, font etc. as per your unique business setting.
People who downloaded this PowerPoint presentation also viewed the following :
Related Products
Line Comparison Graph For Yearly Liquidity Ratio Analysis Comparison Topics PDF with all 2 slides: