 AI PPT Maker
 Templates
 PPT Bundles
 Design Services
 Business PPTs
 Business Plan
 Management
 Strategy
 Introduction PPT
 Roadmap
 Self Introduction
 Timelines
 Process
 Marketing
 Agenda
 Technology
 Medical
 Startup Business Plan
 Cyber Security
 Dashboards
 SWOT
SWOT Proposals
 Education
 Pitch Deck
 Digital Marketing
 KPIs
KPIs Project Management
 Product Management
 Artificial Intelligence
 Target Market
 Communication
 Supply Chain
 Google Slides
 Research Services
 One Pagers
 All Categories
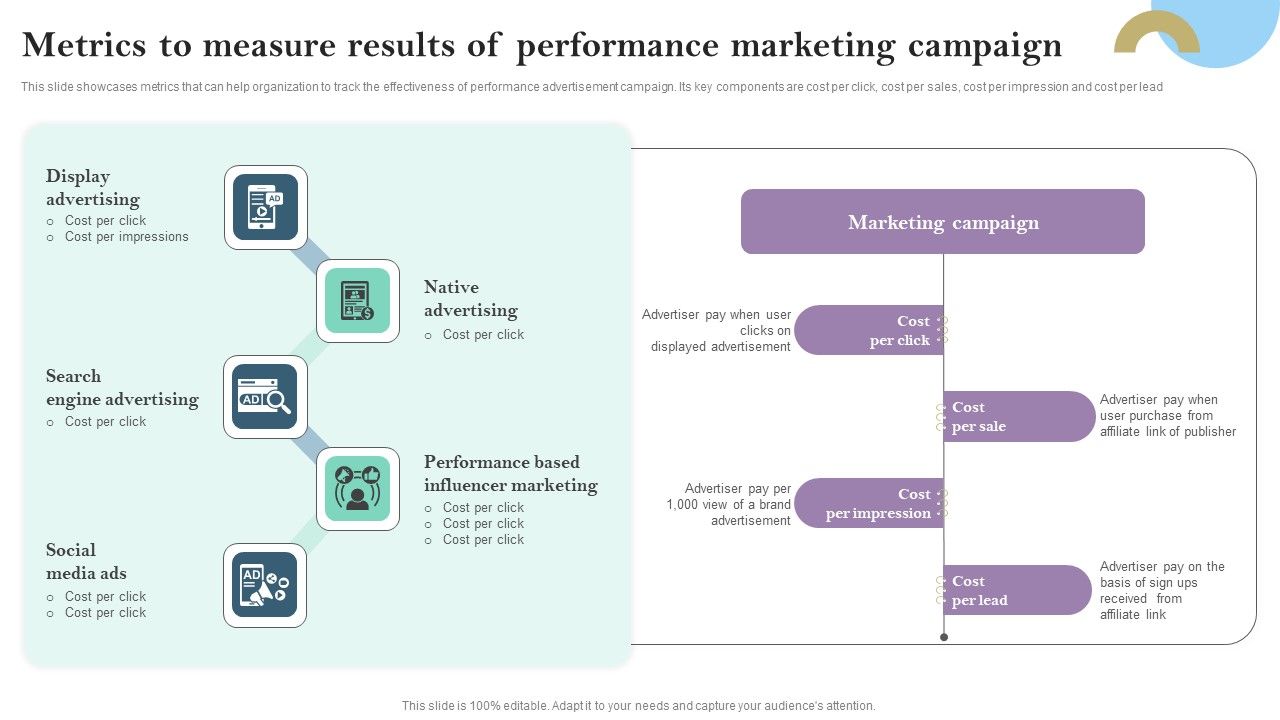
Metrics To Measure Results Of Performance Marketing Campaign Ppt PowerPoint Presentation Diagram Graph Charts PDF


Features of these PowerPoint presentation slides:
This slide showcases metrics that can help organization to track the effectiveness of performance advertisement campaign. Its key components are cost per click, cost per sales, cost per impression and cost per lead Presenting this PowerPoint presentation, titled Metrics To Measure Results Of Performance Marketing Campaign Ppt PowerPoint Presentation Diagram Graph Charts PDF, with topics curated by our researchers after extensive research. This editable presentation is available for immediate download and provides attractive features when used. Download now and captivate your audience. Presenting this Metrics To Measure Results Of Performance Marketing Campaign Ppt PowerPoint Presentation Diagram Graph Charts PDF. Our researchers have carefully researched and created these slides with all aspects taken into consideration. This is a completely customizable Metrics To Measure Results Of Performance Marketing Campaign Ppt PowerPoint Presentation Diagram Graph Charts PDF that is available for immediate downloading. Download now and make an impact on your audience. Highlight the attractive features available with our PPTs.
People who downloaded this PowerPoint presentation also viewed the following :
Related Products
Metrics To Measure Results Of Performance Marketing Campaign Ppt PowerPoint Presentation Diagram Graph Charts PDF with all 9 slides:


