AI PPT Maker
 Templates
 PPT Bundles
 Design Services
 Business PPTs
 Business Plan
 Management
 Strategy
 Introduction PPT
 Roadmap
 Self Introduction
 Timelines
 Process
 Marketing
 Agenda
 Technology
 Medical
 Startup Business Plan
 Cyber Security
 Dashboards
 SWOT
SWOT Proposals
 Education
 Pitch Deck
 Digital Marketing
 KPIs
KPIs Project Management
 Product Management
 Artificial Intelligence
 Target Market
 Communication
 Supply Chain
 Google Slides
 Research Services
 One Pagers
 All Categories
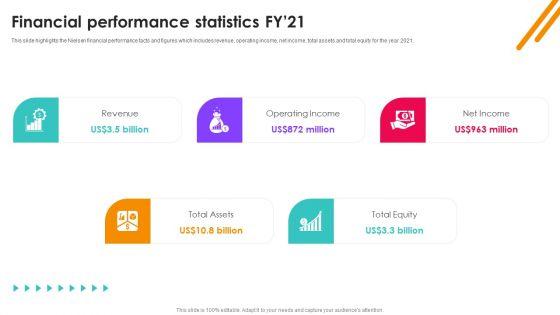
Nielsen Business Profile Financial Performance Statistics Fy21 Ppt PowerPoint Presentation Diagram PDF


Features of these PowerPoint presentation slides:
This slide highlights the Nielsen financial performance facts and figures which includes revenue, operating income, net income, total assets and total equity for the year 2021. Do you have to make sure that everyone on your team knows about any specific topic I yes, then you should give Nielsen Business Profile Financial Performance Statistics Fy21 Ppt PowerPoint Presentation Diagram PDF a try. Our experts have put a lot of knowledge and effort into creating this impeccable Nielsen Business Profile Financial Performance Statistics Fy21 Ppt PowerPoint Presentation Diagram PDF. You can use this template for your upcoming presentations, as the slides are perfect to represent even the tiniest detail. You can download these templates from the Slidegeeks website and these are easy to edit. So grab these today.
People who downloaded this PowerPoint presentation also viewed the following :
Keywords:
Related Products
Nielsen Business Profile Financial Performance Statistics Fy21 Ppt PowerPoint Presentation Diagram PDF with all 9 slides: