 AI PPT Maker
 Templates
 PPT Bundles
 Design Services
 Business PPTs
 Business Plan
 Management
 Strategy
 Introduction PPT
 Roadmap
 Self Introduction
 Timelines
 Process
 Marketing
 Agenda
 Technology
 Medical
 Startup Business Plan
 Cyber Security
 Dashboards
 SWOT
SWOT Proposals
 Education
 Pitch Deck
 Digital Marketing
 KPIs
KPIs Project Management
 Product Management
 Artificial Intelligence
 Target Market
 Communication
 Supply Chain
 Google Slides
 Research Services
 One Pagers
 All Categories
Line-graphs PowerPoint Presentation Templates and Google Slides
26 Item(s)


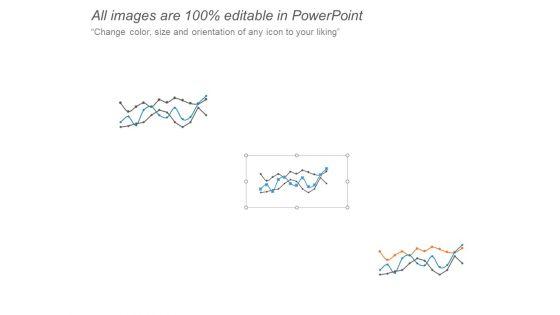
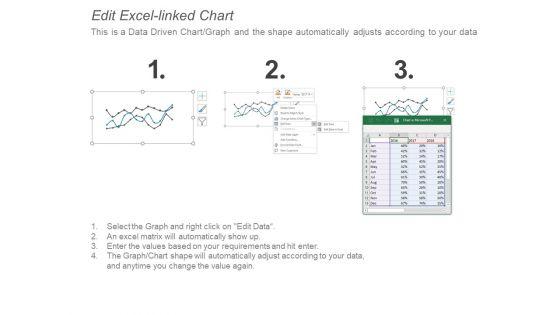
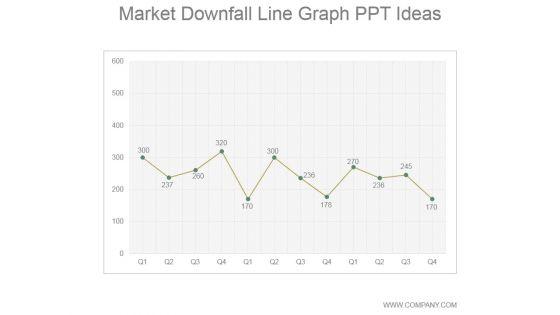
Presenting this set of slides with name stacked line graph ppt powerpoint presentation portfolio brochure. The topics discussed in these slides are marketing, business, management, planning, strategy. This is a completely editable PowerPoint presentation and is available for immediate download. Download now and impress your audience.
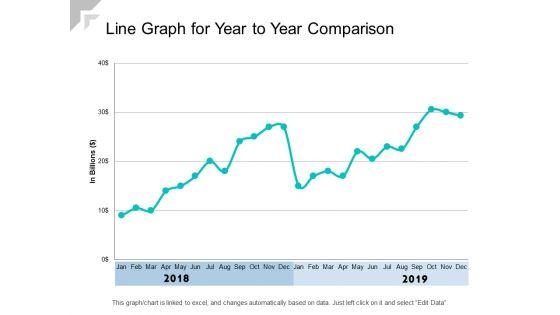


Presenting this set of slides with name line graph for year to year comparison ppt powerpoint presentation show graphics example. The topics discussed in these slides are revenue trend, bar chart, financial. This is a completely editable PowerPoint presentation and is available for immediate download. Download now and impress your audience.
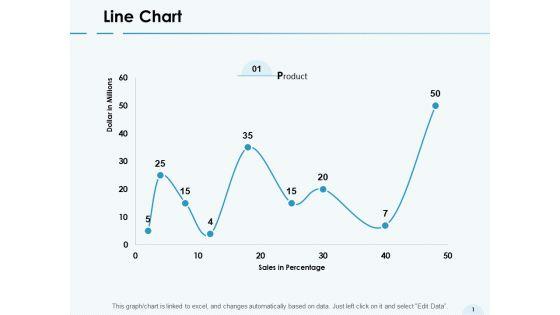


Presenting this set of slides with name line chart graph ppt powerpoint presentation gallery structure. The topics discussed in these slides are marketing, business, management, planning, strategy. This is a completely editable PowerPoint presentation and is available for immediate download. Download now and impress your audience.
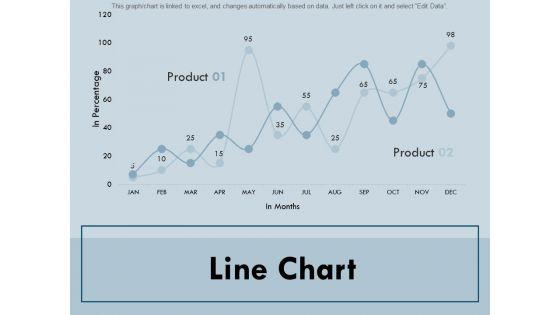


Presenting this set of slides with name line chart graph bar ppt powerpoint presentation gallery layout. The topics discussed in these slides are marketing, business, management, planning, strategy. This is a completely editable PowerPoint presentation and is available for immediate download. Download now and impress your audience.
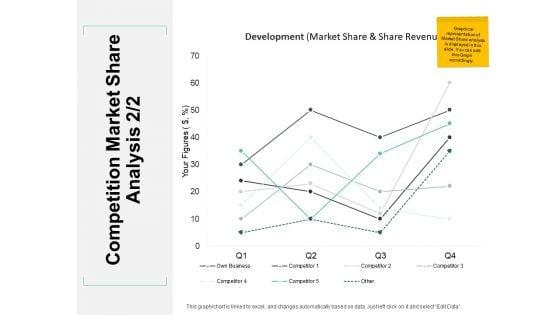


Presenting this set of slides with name competition market share analysis line graph ppt powerpoint presentation portfolio layouts. The topics discussed in these slides are marketing, business, management, planning, strategy. This is a completely editable PowerPoint presentation and is available for immediate download. Download now and impress your audience.
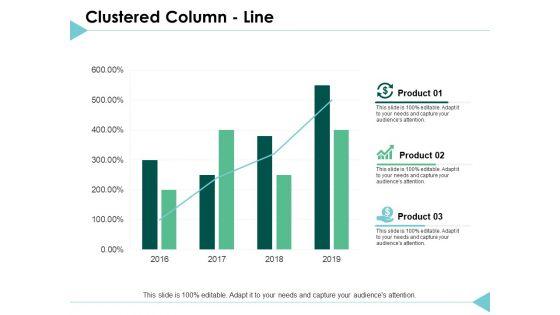
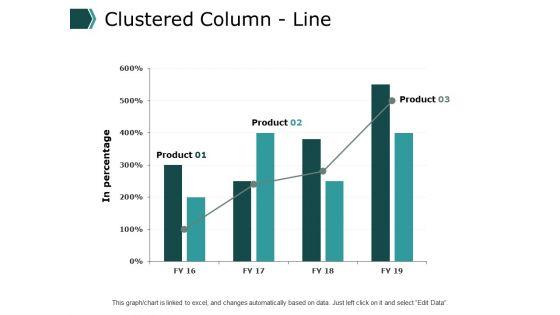
Presenting this set of slides with name clustered column line graph ppt powerpoint presentation icon show. The topics discussed in these slides are business, planning, strategy, marketing, management. This is a completely editable PowerPoint presentation and is available for immediate download. Download now and impress your audience.


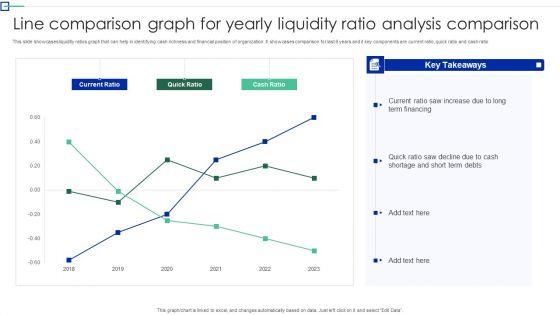

This slide showcases liquidity ratios graph that can help in identifying cash richness and financial position of organization. It showcases comparison for last 6 years and it key components are current ratio, quick ratio and cash ratio. Showcasing this set of slides titled Line Comparison Graph For Yearly Liquidity Ratio Analysis Comparison Topics PDF. The topics addressed in these templates are Term Financing, Cash Shortage, Cash Ratio. All the content presented in this PPT design is completely editable. Download it and make adjustments in color, background, font etc. as per your unique business setting.

This slide shows the line graph representing the budget and innovation sprint trends. It shows the average budget spent on innovation and the upcoming trends in the innovation sprint. Pitch your topic with ease and precision using this Budget Line Graph For Innovation Sprint In Safe Trends Diagrams PDF. This layout presents information on Budget Line Graph, For Innovation Sprint, In Safe Trends. It is also available for immediate download and adjustment. So, changes can be made in the color, design, graphics or any other component to create a unique layout.
Persuade your audience using this Line Graph Icon Representing Growth In Internet Trend Rules PDF This PPT design covers Four stages, thus making it a great tool to use. It also caters to a variety of topics including Line Graph, Icon Representing, Growth Internet Trend Download this PPT design now to present a convincing pitch that not only emphasizes the topic but also showcases your presentation skills.
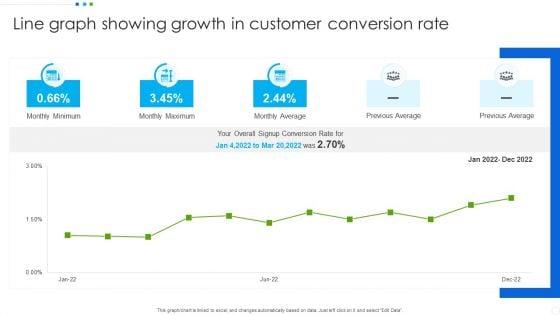

Pitch your topic with ease and precision using this Line Graph Showing Growth In Customer Conversion Rate Inspiration PDF. This layout presents information on Monthly Average, Customer Conversion Rate, Previous Average. It is also available for immediate download and adjustment. So, changes can be made in the color, design, graphics or any other component to create a unique layout.
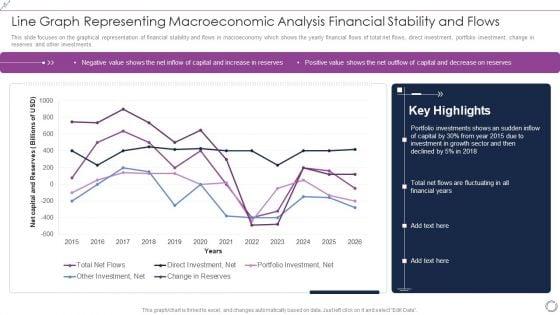

This slide focuses on the graphical representation of financial stability and flows in macroeconomy which shows the yearly financial flows of total net flows, direct investment, portfolio investment, change in reserves and other investments. Showcasing this set of slides titled Line Graph Representing Macroeconomic Analysis Financial Stability And Flows Rules PDF. The topics addressed in these templates are Total Net Flows, Direct Investment, Net, Portfolio Investment, Net. All the content presented in this PPT design is completely editable. Download it and make adjustments in color, background, font etc. as per your unique business setting.

Pitch your topic with ease and precision using this line graph representing hike in price forecast by manufacturing company ppt powerpoint presentation file skills pdf. This layout presents information on manufacturing, price, price rate decreases. It is also available for immediate download and adjustment. So, changes can be made in the color, design, graphics or any other component to create a unique layout.


Showcasing this set of slides titled earnings before interest taxes depreciation and amortization line graph ppt powerpoint presentation layouts aids pdf. The topics addressed in these templates are earnings before interest taxes depreciation and amortization line graph. All the content presented in this PPT design is completely editable. Download it and make adjustments in color, background, font etc. as per your unique business setting.
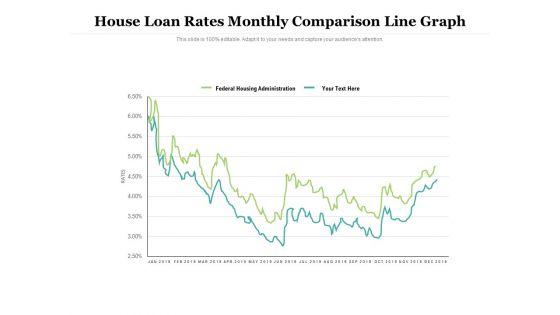

Showcasing this set of slides titled house loan rates monthly comparison line graph ppt powerpoint presentation slides graphics pictures pdf. The topics addressed in these templates are federal housing administration, house loan rates, line graph. All the content presented in this PPT design is completely editable. Download it and make adjustments in color, background, font etc. as per your unique business setting.

Showcasing this set of slides titled line graph indicating quarter wise hospital readmission ppt powerpoint presentation gallery layouts pdf. The topics addressed in these templates are line graph indicating quarter wise hospital readmission. All the content presented in this PPT design is completely editable. Download it and make ajustments in color, background, font etc. as per your unique business setting.
Presenting this set of slides with name line graph icon for business statistical analysis ppt powerpoint presentation gallery clipart images pdf. The topics discussed in these slide is line graph icon for business statistical analysis. This is a completely editable PowerPoint presentation and is available for immediate download. Download now and impress your audience.
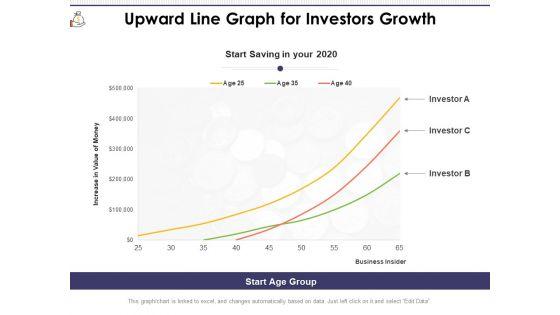
Presenting this set of slides with name upward line graph for investors growth ppt powerpoint presentation gallery topics pdf. The topics discussed in these slide is upward line graph for investors growth. This is a completely editable PowerPoint presentation and is available for immediate download. Download now and impress your audience.
Presenting this set of slides with name financial line graph vector icon ppt powerpoint presentation infographic template mockup. This is a three stage process. The stages in this process are financial line graph vector icon. This is a completely editable PowerPoint presentation and is available for immediate download. Download now and impress your audience.
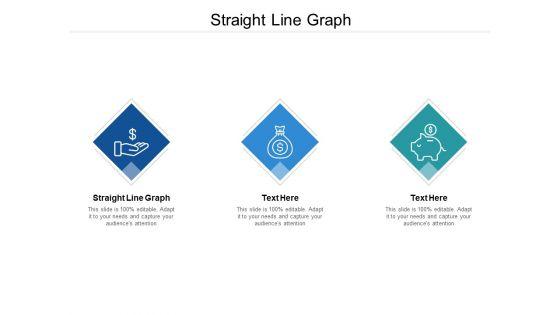
Presenting this set of slides with name straight line graph ppt powerpoint presentation visual aids inspiration cpb. This is an editable Powerpoint three stages graphic that deals with topics like straight line graph to help convey your message better graphically. This product is a premium product available for immediate download and is 100 percent editable in Powerpoint. Download this now and use it in your presentations to impress your audience.
26 Item(s)