 AI PPT Maker
 Templates
 PPT Bundles
 Design Services
 Business PPTs
 Business Plan
 Management
 Strategy
 Introduction PPT
 Roadmap
 Self Introduction
 Timelines
 Process
 Marketing
 Agenda
 Technology
 Medical
 Startup Business Plan
 Cyber Security
 Dashboards
 SWOT
SWOT Proposals
 Education
 Pitch Deck
 Digital Marketing
 KPIs
KPIs Project Management
 Product Management
 Artificial Intelligence
 Target Market
 Communication
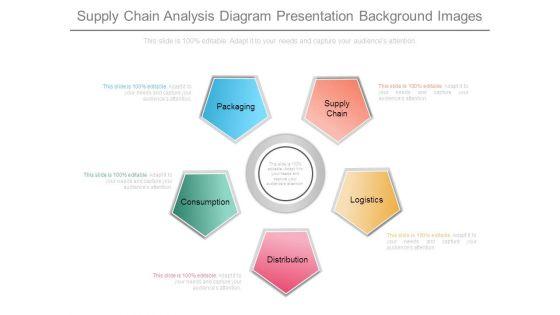
 Supply Chain
 Google Slides
 Research Services
 One Pagers
 All Categories
Analysis Diagram PowerPoint Presentation Templates and Google Slides
SHOW
- 60
- 120
- 180
DISPLAYING: 60 of 371 Item(s)
Page


Presenting this set of slides with name example of data management and analysis process diagram slides. This is a six stage process. The stages in this process are data governance, data structure, data architecture, master data and metadata, data security, data quality. This is a completely editable PowerPoint presentation and is available for immediate download. Download now and impress your audience.


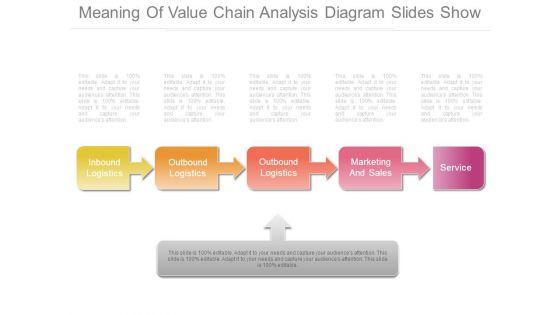
This is a value chain analysis framework diagram examples. This is a five stage process. The stages in this process are strategic vision, customer needs, new products, current products, new product development, competitive dimensions and requirements, order fulfillment after, sales service, quality, dependability, flexibility, price, speed, enterprise capabilities, operations capabilities, supplier capabilities, r and d, technology, systems, people, distribution, financial management, support platforms human resource management, information management.


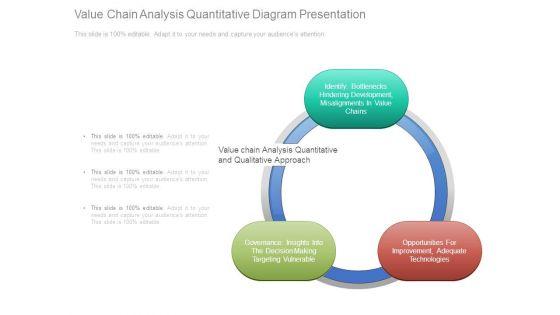


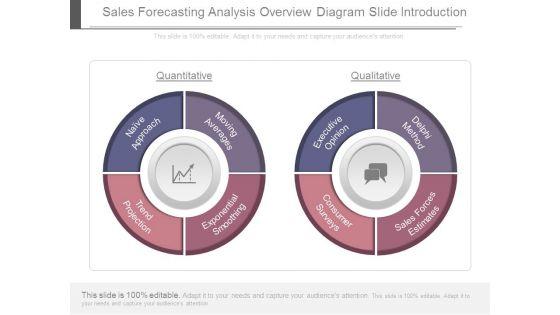
This is a value chain analysis quantitative diagram presentation. This is a three stage process. The stages in this process are identify bottlenecks hindering development, misalignments in value chains, governance insights into the decision making targeting vulnerable, opportunities for improvement, adequate technologies, value chain analysis quantitative and qualitative approach.


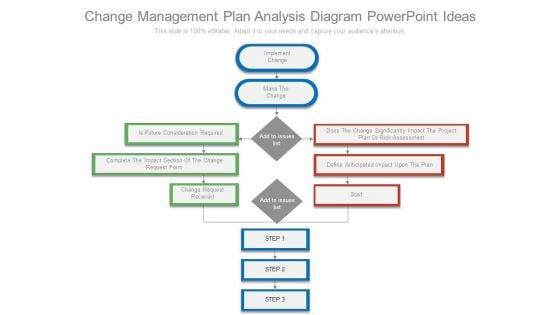


This is a change management plan analysis diagram powerpoint ideas. This is a eleven stage process. The stages in this process are implement change, make the change, is future consideration required, complete the impact section of the change request form, change request received, add to issues list, does the change significantly impact the project plan or risk assessment, define anticipated impact upon the plan, start, step.


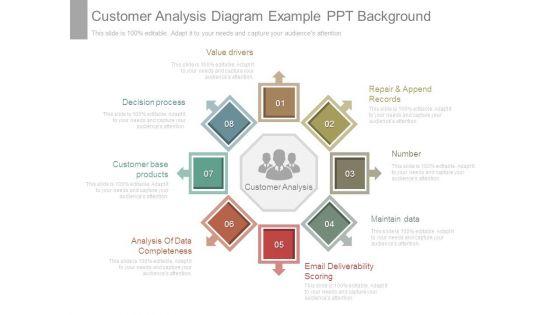


This is a customer analysis diagram example ppt background. This is a eight stage process. The stages in this process are repair and append records, number, maintain data, email deliverability scoring, analysis of data completeness, customer base products, decision process, value drivers, customer analysis.


This is a risk analysis challenges diagram ppt slide styles. This is a seven stage process. The stages in this process are estimating risk impacts and probabilities, accounting for unidentified risks, aggregating low probability, bias of evaluators, accounting for correlation among risks, avoiding double counting of risks, accounting for procurement phase risks that are unique to p3s.


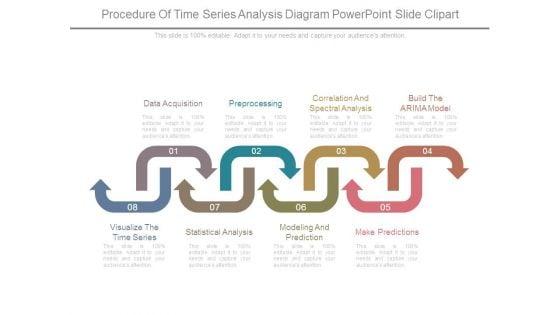


This is a procedure of time series analysis diagram powerpoint slide clipart. This is a eight stage process. The stages in this process are data acquisition, preprocessing, correlation and spectral analysis, build the arima model, make predictions, modeling and prediction, statistical analysis, visualize the time series.


SHOW
- 60
- 120
- 180
DISPLAYING: 60 of 371 Item(s)
Page