AI PPT Maker
Templates
PPT Bundles
Design Services
Business PPTs
Business Plan
Management
Strategy
Introduction PPT
Roadmap
Self Introduction
Timelines
Process
Marketing
Agenda
Technology
Medical
Startup Business Plan
Cyber Security
Dashboards
SWOT
Proposals
Education
Pitch Deck
Digital Marketing
KPIs
Project Management
Product Management
Artificial Intelligence
Target Market
Communication
Supply Chain
Google Slides
Research Services
 One Pagers
All Categories
Analytical Data PowerPoint Presentation Templates and Google Slides
SHOW
- 60
- 120
- 180
DISPLAYING: 60 of 151 Item(s)
Page




Slide 1 of 12
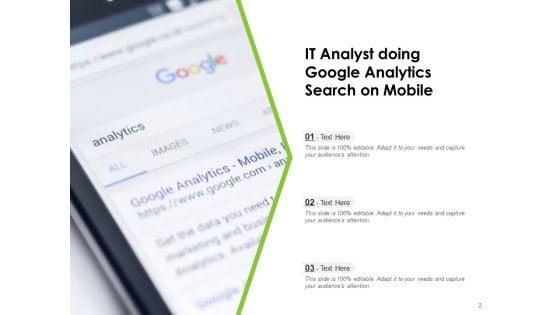
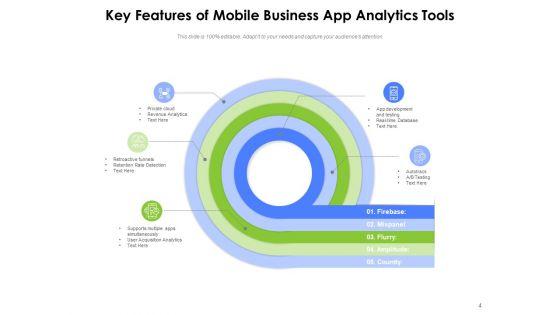
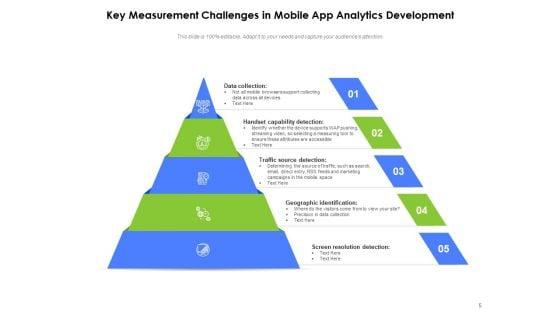
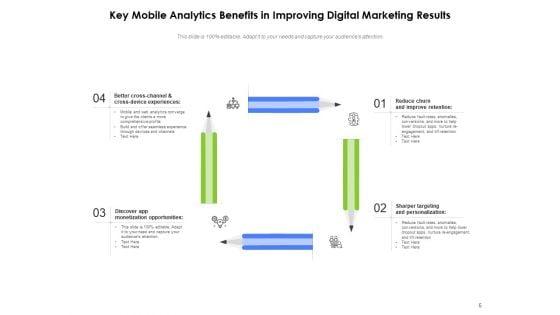
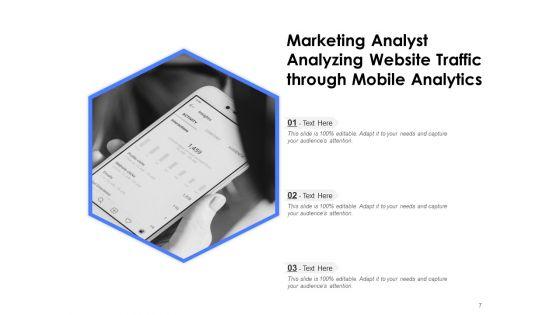
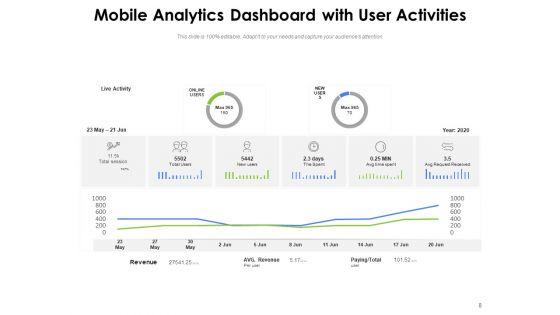
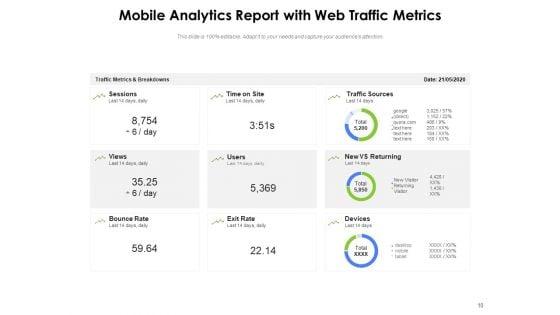
Presenting this set of slides with name phone diagnosis mobile analytics data collection magnify glass ppt powerpoint presentation complete deck. The topics discussed in these slides are mobile analytics, data collection, magnify glass, mobile analytics, traffic metrics. This is a completely editable PowerPoint presentation and is available for immediate download. Download now and impress your audience.
Slide 1 of 7
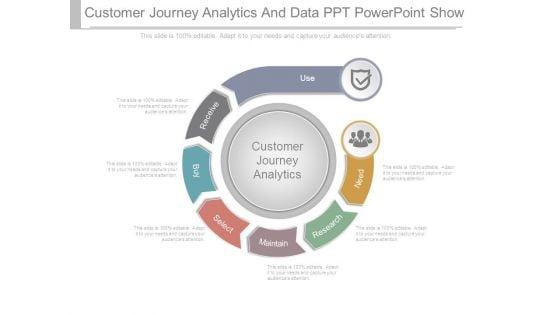
This is a customer journey analytics and data ppt powerpoint show. This is a seven stage process. The stages in this process are use, receive, buy, select, maintain, research, need, customer journey analytics.


Slide 1 of 7
This is a assemble an analytic data repository powerpoint presentation templates. This is a five stage process. The stages in this process are assemble an analytic data repository, track all customer interactions, monitor customer experience scores, determine customer behavior changes, evaluate customer value impacts.


Slide 1 of 5
This is a social media analytics market data ppt powerpoint presentation deck. This is a eight stage process. The stages in this process are million, megabytes, hours, petabytes, items, exabytes.

Slide 1 of 2
The slide carries a data to evaluate social media presence for improving brands image and perception. Various KPIs are social media platforms, total potential impressions, total unique creators, average positive sentiment, etc. Showcasing this set of slides titled Social Media Visibility Analytical Data Inspiration PDF. The topics addressed in these templates are Presence, Creators, Total Engagement. All the content presented in this PPT design is completely editable. Download it and make adjustments in color, background, font etc. as per your unique business setting.


Slide 1 of 2
The following slide include dashboard showing data of activities to monitor health of company, department and various processes. It covers active and complete activities, total duration, tasks and participants. Pitch your topic with ease and precision using this Procedure Analytics Data Dashboard With Business Intelligence Slides PDF. This layout presents information on Active Activities, Completed Activities, Active Tasks . It is also available for immediate download and adjustment. So, changes can be made in the color, design, graphics or any other component to create a unique layout.

Slide 1 of 2
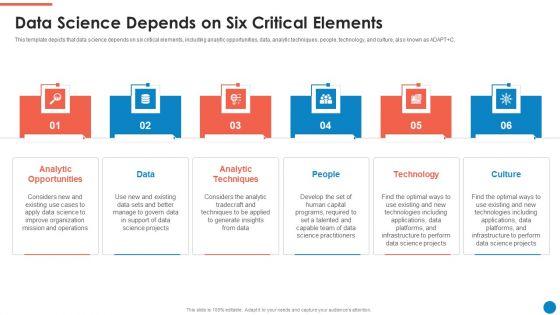
This template depicts that data science depends on six critical elements, including analytic opportunities, data, analytic techniques, people, technology, and culture, also known as ADAPTC. This is a Data And Analytics Playbook Data Science Depends On Six Critical Elements Inspiration PDF template with various stages. Focus and dispense information on six stages using this creative set, that comes with editable features. It contains large content boxes to add your information on topics like Analytic Opportunities, Data, Analytic Techniques, People, Technology, Culture. You can also showcase facts, figures, and other relevant content using this PPT layout. Grab it now.
Slide 1 of 2
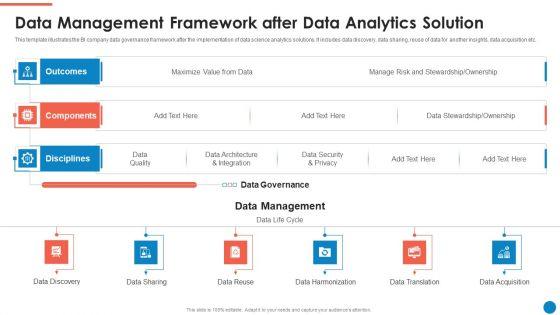
This template illustrates the BI company data governance framework after the implementation of data science analytics solutions. It includes data discovery, data sharing, reuse of data for another insights, data acquisition etc. Deliver an awe inspiring pitch with this creative Data And Analytics Playbook Data Management Framework After Data Analytics Solution Designs PDF bundle. Topics like Outcomes, Components, Disciplines, Data Management, Data Governance can be discussed with this completely editable template. It is available for immediate download depending on the needs and requirements of the user.


Slide 1 of 2
This slide represents the massively parallel processing analytical database and how parallel processing is done across multiple servers.Deliver and pitch your topic in the best possible manner with this MIS MPP Massively Parallel Processing Analytical Databases Ppt PowerPoint Presentation File Smartart PDF Use them to share invaluable insights on Data Warehousing Technology, Concentrates On Parallel, Concurrently Across Multiple and impress your audience. This template can be altered and modified as per your expectations. So, grab it now.


Slide 1 of 2
The slide shows the timeline for assessing and implementing the change in data analytics project. Deliver and pitch your topic in the best possible manner with this business intelligence and big data analytics data analytics change management gantt pictures pdf. Use them to share invaluable insights on change execution, assessments and solutioning, develop change management plan and impress your audience. This template can be altered and modified as per your expectations. So, grab it now.

Slide 1 of 2
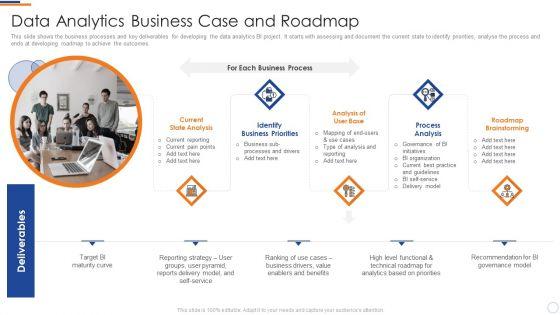
This slide shows the business processes and key deliverables for developing the data analytics BI project. It starts with assessing and document the current state to identify priorities, analyse the process and ends at developing roadmap to achieve the outcomes. This is a business intelligence and big data analytics data analytics business case and roadmap template pdf template with various stages. Focus and dispense information on five stages using this creative set, that comes with editable features. It contains large content boxes to add your information on topics like current state analysis, identify business priorities, analysis user base, process analysis, roadmap brainstorming. You can also showcase facts, figures, and other relevant content using this PPT layout. Grab it now.

Slide 1 of 2
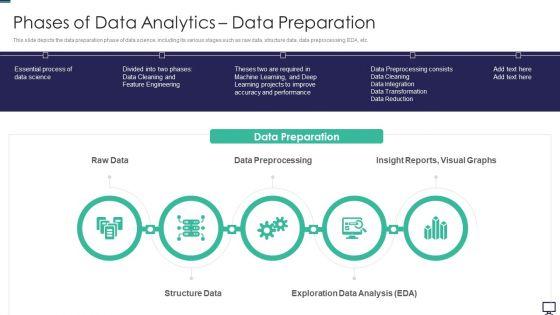
This slide depicts the data preparation phase of data science, including its various stages such as raw data, structure data, data preprocessing, EDA, etc. Presenting phases of data analytics data preparation ppt summary clipart pdf to provide visual cues and insights. Share and navigate important information on five stages that need your due attention. This template can be used to pitch topics like data preprocessing, structure data, exploration data analysis. In addtion, this PPT design contains high resolution images, graphics, etc, that are easily editable and available for immediate download.

Slide 1 of 2
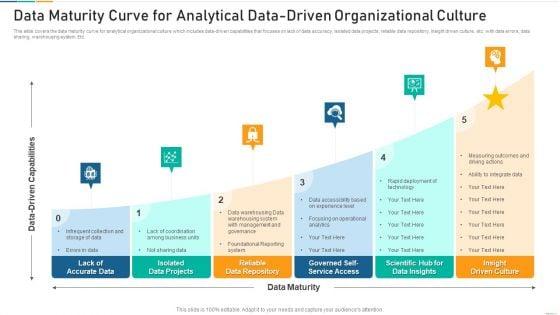
Persuade your audience using this data maturity curve for analytical data driven organizational culture inspiration pdf. This PPT design covers five stages, thus making it a great tool to use. It also caters to a variety of topics including service, system, warehousing. Download this PPT design now to present a convincing pitch that not only emphasizes the topic but also showcases your presentation skills.


Slide 1 of 2
This slide represents the massively parallel processing analytical database and how parallel processing is done across multiple servers. Deliver an awe inspiring pitch with this creative data warehousing it mpp massively parallel processing analytical databases ppt slides download pdf bundle. Topics like manufacturers, processing, servers, source can be discussed with this completely editable template. It is available for immediate download depending on the needs and requirements of the user.
Slide 1 of 2
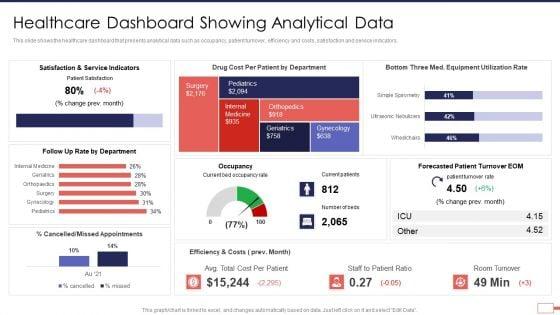
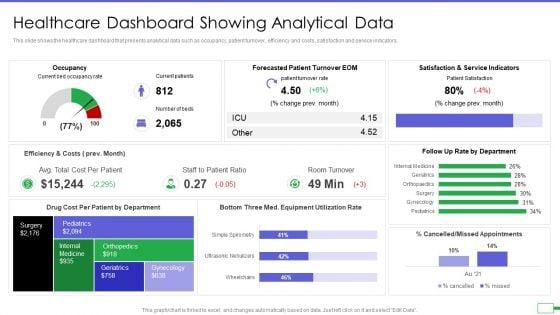
This slide shows the healthcare dashboard that presents analytical data such as occupancy, patient turnover, efficiency and costs, satisfaction and service indicators. Deliver an awe inspiring pitch with this creative iot digital twin technology post covid expenditure management healthcare dashboard showing analytical data brochure pdf bundle. Topics like service, indicators, cost, appointments, turnover can be discussed with this completely editable template. It is available for immediate download depending on the needs and requirements of the user.
Slide 1 of 2
This slide shows the healthcare dashboard that presents analytical data such as occupancy, patient turnover, efficiency and costs, satisfaction and service indicators. Deliver and pitch your topic in the best possible manner with this iot and digital twin to reduce costs post covid healthcare dashboard showing analytical data elements pdf. Use them to share invaluable insights on occupancy, patient turnover, efficiency and costs, satisfaction and service indicators and impress your audience. This template can be altered and modified as per your expectations. So, grab it now.
Slide 1 of 2
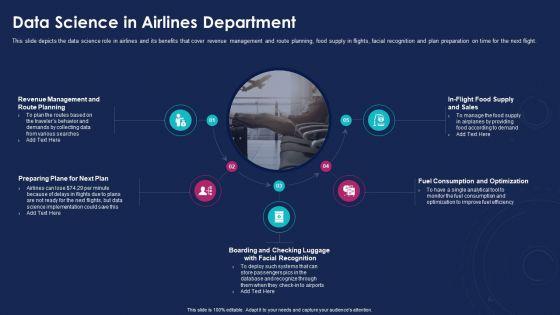
This slide depicts the data science role in airlines and its benefits that cover revenue management and route planning, food supply in flights, facial recognition and plan preparation on time for the next flight. Presenting data analytics it data science in airlines department ppt pictures graphics example pdf to provide visual cues and insights. Share and navigate important information on five stages that need your due attention. This template can be used to pitch topics like revenue management planning, plan, facial recognition, consumption and optimization, sales. In addtion, this PPT design contains high resolution images, graphics, etc, that are easily editable and available for immediate download.
Slide 1 of 2
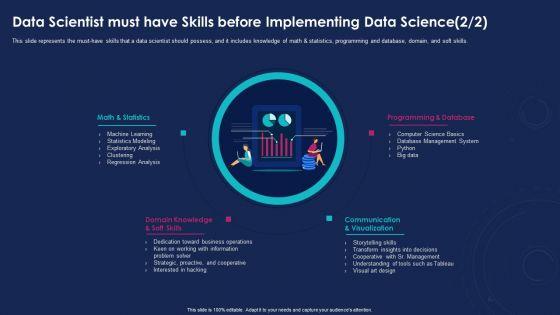
This slide represents the must-have skills that a data scientist should possess, and it includes knowledge of math and statistics, programming and database, domain, and soft skills. Presenting data analytics it data scientist must have skills before implementing ppt slides portfolio pdf to provide visual cues and insights. Share and navigate important information on four stages that need your due attention. This template can be used to pitch topics like math and statistics, domain knowledge and soft skills, communication and visualization, programming and database. In addtion, this PPT design contains high resolution images, graphics, etc, that are easily editable and available for immediate download.

Slide 1 of 2
This slide describes the data science in the logistic and transportation sector and how it will improve both sectors since both contain fragmented data. This is a data analytics it data science in logistics and transportation department ppt professional smartart pdf template with various stages. Focus and dispense information on three stages using this creative set, that comes with editable features. It contains large content boxes to add your information on topics like data capture, serving layer, analytical capabilities. You can also showcase facts, figures, and other relevant content using this PPT layout. Grab it now.
Slide 1 of 2
This slide depicts the role of data science in healthcare departments and its benefits in different ways, such as image analysis, drug discovery, genetics and Genomics, predictive diagnosis, and NLP. Presenting data analytics it data science in healthcare department ppt professional icon pdf to provide visual cues and insights. Share and navigate important information on five stages that need your due attention. This template can be used to pitch topics like medical image analysis, drug discovery, genetics and genomics, predictive diagnosis, natural language processing. In addtion, this PPT design contains high resolution images, graphics, etc, that are easily editable and available for immediate download.

Slide 1 of 2
This slide represents the application of data science in financial organizations and its benefits, such as automate risk analytics, algorithmic trading, machine learning algorithms, and personalized relations with customers. This is a data analytics it data science in finance sector ppt gallery inspiration pdf template with various stages. Focus and dispense information on four stages using this creative set, that comes with editable features. It contains large content boxes to add your information on topics like automate risk analytics, personalized relations with customers, algorithmic trading, machine learning algorithms. You can also showcase facts, figures, and other relevant content using this PPT layout. Grab it now.

Slide 1 of 2
This slide represents the data science application in business and its benefits, such as gaining customer insights, increased security, streamlining manufacturing, and predicting future market trends. Presenting data analytics it data science in business sector ppt ideas template pdf to provide visual cues and insights. Share and navigate important information on five stages that need your due attention. This template can be used to pitch topics like gain customer insights, inform internal finances, predict future market trends, streamline manufacturing, increase security. In addtion, this PPT design contains high resolution images, graphics, etc, that are easily editable and available for immediate download.

Slide 1 of 2
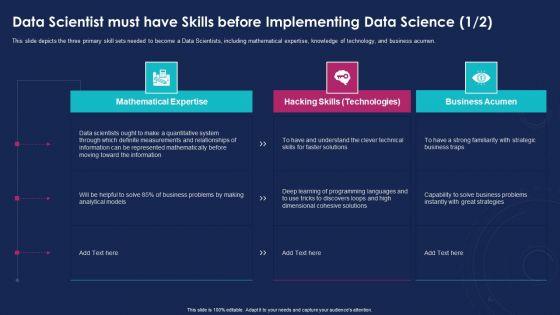
This slide depicts the three primary skill sets needed to become a Data Scientists, including mathematical expertise, knowledge of technology, and business acumen. Deliver an awe inspiring pitch with this creative data analytics it data scientist must have skills before implementing ppt inspiration tips pdf bundle. Topics like mathematical expertise, knowledge of technology, business acumen can be discussed with this completely editable template. It is available for immediate download depending on the needs and requirements of the user.


Slide 1 of 2
This slide represents the difference between data science and data analytics based on skillset, scope, exploration and goals and how both will work together. Deliver and pitch your topic in the best possible manner with this data analytics it data science with data analytics ppt outline example file pdf. Use them to share invaluable insights on skillset, scope, exploration, goals and impress your audience. This template can be altered and modified as per your expectations. So, grab it now.

Slide 1 of 2
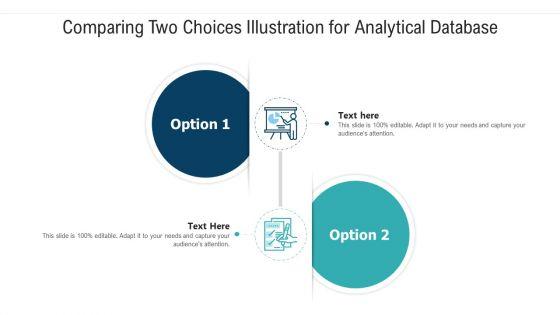
Presenting comparing two choices illustration for analytical database ppt powerpoint presentation file visual aids pdf to dispense important information. This template comprises two stages. It also presents valuable insights into the topics including comparing two choices illustration for analytical database. This is a completely customizable PowerPoint theme that can be put to use immediately. So, download it and address the topic impactfully.

Slide 1 of 2
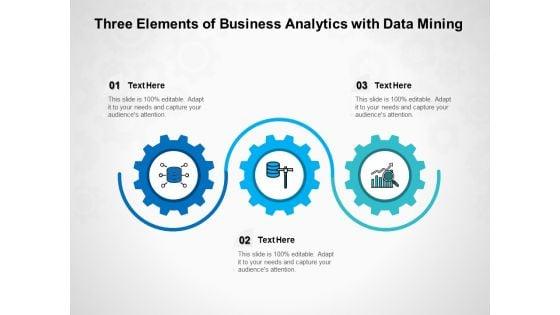
Presenting three elements of business analytics with data mining ppt powerpoint presentation portfolio graphics pdf to dispense important information. This template comprises three stages. It also presents valuable insights into the topics including three elements of business analytics with data mining. This is a completely customizable PowerPoint theme that can be put to use immediately. So, download it and address the topic impactfully.


Slide 1 of 2
Presenting our jaw-dropping quarterly roadmap for sap analytics online data storage guidelines. You can alternate the color, font size, font type, and shapes of this PPT layout according to your strategic process. This PPT presentation is compatible with Google Slides and is available in both standard screen and widescreen aspect ratios. You can also download this well-researched PowerPoint template design in different formats like PDF, JPG, and PNG. So utilize this visually-appealing design by clicking the download button given below.

Slide 1 of 2
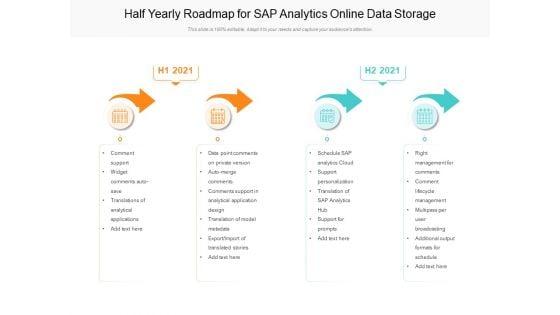
Presenting our jaw-dropping half yearly roadmap for sap analytics online data storage pictures. You can alternate the color, font size, font type, and shapes of this PPT layout according to your strategic process. This PPT presentation is compatible with Google Slides and is available in both standard screen and widescreen aspect ratios. You can also download this well-researched PowerPoint template design in different formats like PDF, JPG, and PNG. So utilize this visually-appealing design by clicking the download button given below.
Slide 1 of 2
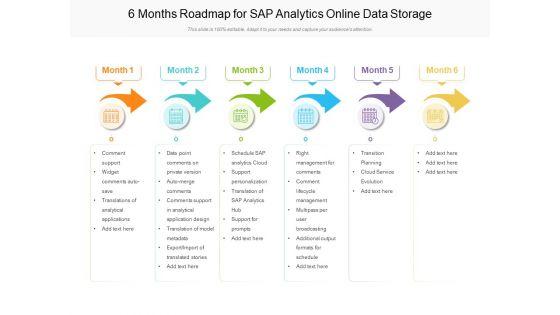
Presenting our jaw-dropping 6 months roadmap for sap analytics online data storage information. You can alternate the color, font size, font type, and shapes of this PPT layout according to your strategic process. This PPT presentation is compatible with Google Slides and is available in both standard screen and widescreen aspect ratios. You can also download this well-researched PowerPoint template design in different formats like PDF, JPG, and PNG. So utilize this visually-appealing design by clicking the download button given below.
Slide 1 of 2
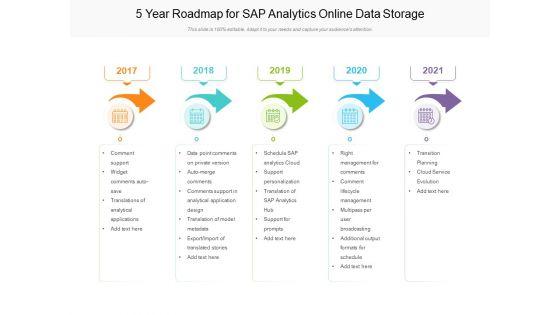
Presenting our jaw-dropping 5 year roadmap for sap analytics online data storage professional. You can alternate the color, font size, font type, and shapes of this PPT layout according to your strategic process. This PPT presentation is compatible with Google Slides and is available in both standard screen and widescreen aspect ratios. You can also download this well-researched PowerPoint template design in different formats like PDF, JPG, and PNG. So utilize this visually-appealing design by clicking the download button given below.

Slide 1 of 2
Presenting our jaw-dropping 3 months roadmap for sap analytics online data storage guidelines. You can alternate the color, font size, font type, and shapes of this PPT layout according to your strategic process. This PPT presentation is compatible with Google Slides and is available in both standard screen and widescreen aspect ratios. You can also download this well-researched PowerPoint template design in different formats like PDF, JPG, and PNG. So utilize this visually-appealing design by clicking the download button given below.
Slide 1 of 2
Persuade your audience using this web analytics and data governance vector icon ppt powerpoint presentation gallery background images pdf. This PPT design covers three stages, thus making it a great tool to use. It also caters to a variety of topics including web analytics and data governance vector icon. Download this PPT design now to present a convincing pitch that not only emphasizes the topic but also showcases your presentation skills.


Slide 1 of 2
Presenting analytics big data use cases ppt gallery rules pdf to provide visual cues and insights. Share and navigate important information on six stages that need your due attention. This template can be used to pitch topics like data generated, troubleshooting, aggregate form. In addition, this PPT design contains high resolution images, graphics, etc, that are easily editable and available for immediate download.
Slide 1 of 2
This is a analytics big data implementation roadmap ppt icon styles pdf template with various stages. Focus and dispense information on three stages using this creative set, that comes with editable features. It contains large content boxes to add your information on topics like estimate cost, action assessment, existing skills. You can also showcase facts, figures, and other relevant content using this PPT layout. Grab it now.
Slide 1 of 2
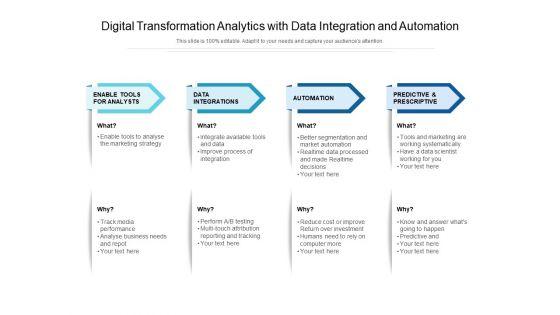
Presenting this set of slides with name digital transformation analytics with data integration and automation ppt powerpoint presentation file diagrams pdf. This is a four stage process. The stages in this process are integrations, automation, prescriptive. This is a completely editable PowerPoint presentation and is available for immediate download. Download now and impress your audience.
Slide 1 of 2
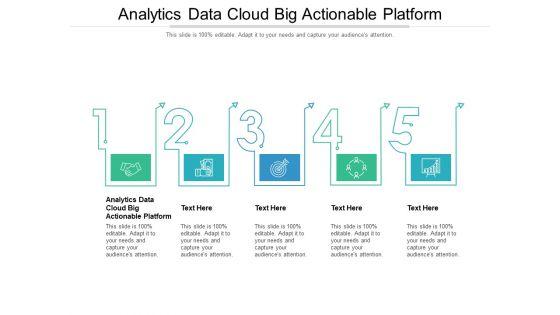
Presenting this set of slides with name analytics data cloud big actionable platform ppt powerpoint presentation professional graphics template cpb pdf. This is an editable Powerpoint five stages graphic that deals with topics like analytics data cloud big actionable platform to help convey your message better graphically. This product is a premium product available for immediate download and is 100 percent editable in Powerpoint. Download this now and use it in your presentations to impress your audience.


Slide 1 of 2
Presenting this set of slides with name smart analytics data ppt powerpoint presentation summary format ideas cpb pdf. This is an editable Powerpoint four stages graphic that deals with topics like smart analytics data to help convey your message better graphically. This product is a premium product available for immediate download and is 100 percent editable in Powerpoint. Download this now and use it in your presentations to impress your audience.


Slide 1 of 2
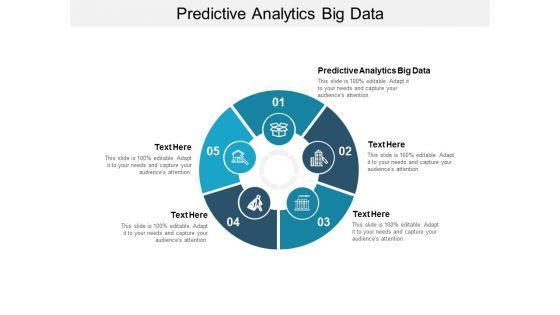
Presenting this set of slides with name predictive analytics big data ppt powerpoint presentation outline deck cpb. This is an editable Powerpoint four stages graphic that deals with topics like predictive analytics big data to help convey your message better graphically. This product is a premium product available for immediate download and is 100 percent editable in Powerpoint. Download this now and use it in your presentations to impress your audience.

Slide 1 of 2
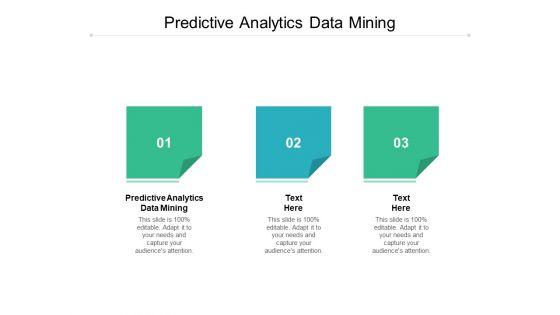
Presenting this set of slides with name predictive analytics data mining ppt powerpoint presentation infographic template inspiration cpb. This is an editable Powerpoint three stages graphic that deals with topics like predictive analytics data mining to help convey your message better graphically. This product is a premium product available for immediate download and is 100 percent editable in Powerpoint. Download this now and use it in your presentations to impress your audience.
Slide 1 of 2
Presenting this set of slides with name predictive analytics big data ppt powerpoint presentation infographics design templates cpb. This is an editable Powerpoint five stages graphic that deals with topics like predictive analytics big data to help convey your message better graphically. This product is a premium product available for immediate download and is 100 percent editable in Powerpoint. Download this now and use it in your presentations to impress your audience.


Slide 1 of 9
This slide represents the data warehouse and OLAP cubes architecture of business intelligence. It includes key recommendations such as used by companies of all sizes etc. Crafting an eye-catching presentation has never been more straightforward. Let your presentation shine with this tasteful yet straightforward Tools For HR Business Analytics Data Warehouse And Olap Cubes Business Intelligence Summary PDF template. It offers a minimalistic and classy look that is great for making a statement. The colors have been employed intelligently to add a bit of playfulness while still remaining professional. Construct the ideal Tools For HR Business Analytics Data Warehouse And Olap Cubes Business Intelligence Summary PDF that effortlessly grabs the attention of your audience Begin now and be certain to wow your customers.


Slide 1 of 9
Tools For HR Business Analytics Data Warehouse And Data Marts Business Intelligence Introduction PDF
This slide represents the data warehouse and data marts architecture of business intelligence. It includes key recommendations such as utilized for distributing required information to each department etc. Are you in need of a template that can accommodate all of your creative concepts This one is crafted professionally and can be altered to fit any style. Use it with Google Slides or PowerPoint. Include striking photographs, symbols, depictions, and other visuals. Fill, move around, or remove text boxes as desired. Test out color palettes and font mixtures. Edit and save your work, or work with colleagues. Download Tools For HR Business Analytics Data Warehouse And Data Marts Business Intelligence Introduction PDF and observe how to make your presentation outstanding. Give an impeccable presentation to your group and make your presentation unforgettable.


Slide 1 of 9
This slide shows the vendor profile matrix. It contains multiple features that can be scored and weighted to evaluate the vendors capability to deliver the software. Slidegeeks is here to make your presentations a breeze with Toolkit For Data Science And Analytics Transition Data Analytics Software Vendor Profile Themes PDF With our easy to use and customizable templates, you can focus on delivering your ideas rather than worrying about formatting. With a variety of designs to choose from, you are sure to find one that suits your needs. And with animations and unique photos, illustrations, and fonts, you can make your presentation pop. So whether you are giving a sales pitch or presenting to the board, make sure to check out Slidegeeks first.


Slide 1 of 9
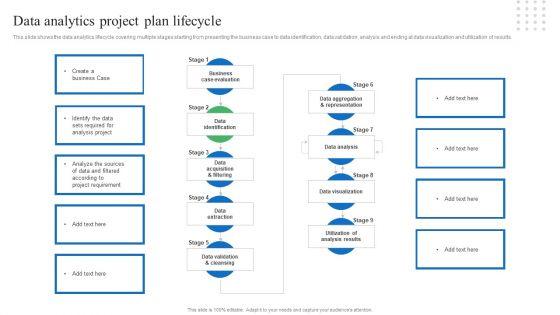
This slide shows the data analytics lifecycle covering multiple stages starting from presenting the business case to data identification, data validation, analysis and ending at data visualization and utilization of results. Present like a pro with Toolkit For Data Science And Analytics Transition Data Analytics Project Plan Designs PDF Create beautiful presentations together with your team, using our easy to use presentation slides. Share your ideas in real time and make changes on the fly by downloading our templates. So whether you are in the office, on the go, or in a remote location, you can stay in sync with your team and present your ideas with confidence. With Slidegeeks presentation got a whole lot easier. Grab these presentations today.


Slide 1 of 9
The slide outline the key steps for data analytics methodology. It initiates with defining business objectives to data understanding, modelling and ends at data visualization and presentation. From laying roadmaps to briefing everything in detail, our templates are perfect for you. You can set the stage with your presentation slides. All you have to do is download these easy to edit and customizable templates. Toolkit For Data Science And Analytics Transition Data Analytics Project Plan Lifecycle Introduction PDF will help you deliver an outstanding performance that everyone would remember and praise you for. Do download this presentation today.


Slide 1 of 9
The slide shows the timeline for assessing and implementing the change in data analytics project. Get a simple yet stunning designed Toolkit For Data Science And Analytics Transition Data Analytics Change Management Gantt Chart Portrait PDF It is the best one to establish the tone in your meetings. It is an excellent way to make your presentations highly effective. So, download this PPT today from Slidegeeks and see the positive impacts. Our easy to edit Toolkit For Data Science And Analytics Transition Data Analytics Change Management Gantt Chart Portrait PDF can be your go to option for all upcoming conferences and meetings. So, what are you waiting for Grab this template today.


Slide 1 of 9
This slide shows the value change management lifecycle. It includes the process of collecting and publicize the data and afterwards adopting change management approach for obtaining the data driven outcomes. Get a simple yet stunning designed Toolkit For Data Science And Analytics Transition Data Change Management Plan With Value Chain Analysis Information PDF. It is the best one to establish the tone in your meetings. It is an excellent way to make your presentations highly effective. So, download this PPT today from Slidegeeks and see the positive impacts. Our easy to edit Toolkit For Data Science And Analytics Transition Data Change Management Plan With Value Chain Analysis Information PDF can be your go to option for all upcoming conferences and meetings. So, what are you waiting for Grab this template today.


Slide 1 of 9
This slide represents the key features of predictive data analytics including data mining, data visualization, and modelling etc. Do you have to make sure that everyone on your team knows about any specific topic I yes, then you should give Toolkit For Data Science And Analytics Transition Data Analytics Software Features Inspiration PDF a try. Our experts have put a lot of knowledge and effort into creating this impeccable Toolkit For Data Science And Analytics Transition Data Analytics Software Features Inspiration PDF. You can use this template for your upcoming presentations, as the slides are perfect to represent even the tiniest detail. You can download these templates from the Slidegeeks website and these are easy to edit. So grab these today.


Slide 1 of 9
This slide illustrates the series of activities required for analyzing the data. It contains information such as data preparation, exploratory analysis, and predictive analytics etc. If you are looking for a format to display your unique thoughts, then the professionally designed Toolkit For Data Science And Analytics Transition Data Analytics Value Stream Chain Pictures PDF is the one for you. You can use it as a Google Slides template or a PowerPoint template. Incorporate impressive visuals, symbols, images, and other charts. Modify or reorganize the text boxes as you desire. Experiment with shade schemes and font pairings. Alter, share or cooperate with other people on your work. Download Toolkit For Data Science And Analytics Transition Data Analytics Value Stream Chain Pictures PDF and find out how to give a successful presentation. Present a perfect display to your team and make your presentation unforgettable.


Slide 1 of 9
This slide shows the key fundamentals of data value chain approach including IT and analytical tools and application to drive business value. Present like a pro with Toolkit For Data Science And Analytics Transition Data Value Streams For Analytics And Monetization Formats PDF Create beautiful presentations together with your team, using our easy to use presentation slides. Share your ideas in real time and make changes on the fly by downloading our templates. So whether you are in the office, on the go, or in a remote location, you can stay in sync with your team and present your ideas with confidence. With Slidegeeks presentation got a whole lot easier. Grab these presentations today.


Slide 1 of 9
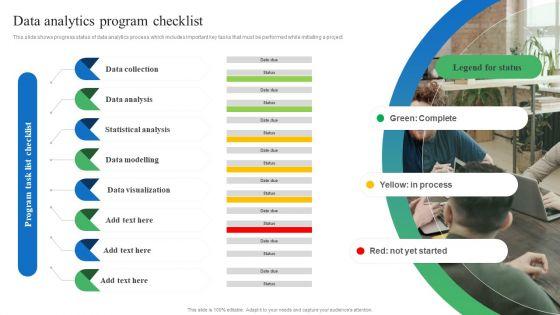
This slide shows progress status of data analytics process which includes important key tasks that must be performed while initiating a project. From laying roadmaps to briefing everything in detail, our templates are perfect for you. You can set the stage with your presentation slides. All you have to do is download these easy to edit and customizable templates. Toolkit For Data Science And Analytics Transition Data Analytics Program Checklist Portrait PDF will help you deliver an outstanding performance that everyone would remember and praise you for. Do download this presentation today.


Slide 1 of 9
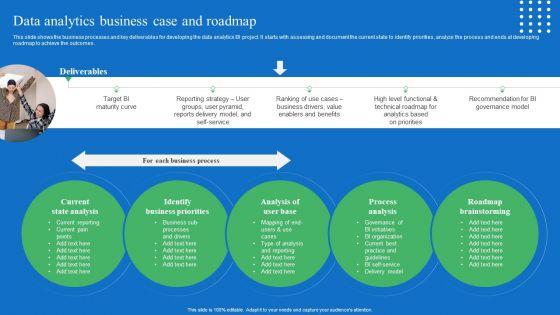
This slide shows the business processes and key deliverables for developing the data analytics BI project. It starts with assessing and document the current state to identify priorities, analyze the process and ends at developing roadmap to achieve the outcomes. Get a simple yet stunning designed Toolkit For Data Science And Analytics Transition Data Analytics Business Case And Roadmap Designs PDF. It is the best one to establish the tone in your meetings. It is an excellent way to make your presentations highly effective. So, download this PPT today from Slidegeeks and see the positive impacts. Our easy to edit Toolkit For Data Science And Analytics Transition Data Analytics Business Case And Roadmap Designs PDF can be your go to option for all upcoming conferences and meetings. So, what are you waiting for Grab this template today.


Slide 1 of 9
The firm will use advanced technology such as predictive analytics in order to project the probability of future outcomes, events based on current and historical data. It utilizes different statistical techniques such as machine learning, pattern recognition through data mining, etc. Slidegeeks has constructed Data Monetization And Management Role Of Predictive Analytics On Data In Preventing Ideas PDF after conducting extensive research and examination. These presentation templates are constantly being generated and modified based on user preferences and critiques from editors. Here, you will find the most attractive templates for a range of purposes while taking into account ratings and remarks from users regarding the content. This is an excellent jumping-off point to explore our content and will give new users an insight into our top-notch PowerPoint Templates.


Slide 1 of 9
The firm will use advanced technology such as predictive analytics in order to project the probability of future outcomes, events based on current and historical data. It utilizes different statistical techniques such as machine learning, pattern recognition through data mining, etc. Are you searching for a Identifying Direct And Indirect Role Of Predictive Analytics On Data In Preventing Summary PDF that is uncluttered, straightforward, and original Its easy to edit, and you can change the colors to suit your personal or business branding. For a presentation that expresses how much effort youve put in, this template is ideal With all of its features, including tables, diagrams, statistics, and lists, its perfect for a business plan presentation. Make your ideas more appealing with these professional slides. Download Identifying Direct And Indirect Role Of Predictive Analytics On Data In Preventing Summary PDF from Slidegeeks today.


Slide 1 of 9
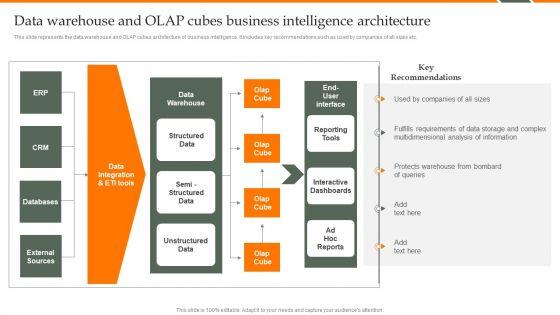
This slide represents the data warehouse and OLAP cubes architecture of business intelligence. It includes key recommendations such as used by companies of all sizes etc. Are you in need of a template that can accommodate all of your creative concepts This one is crafted professionally and can be altered to fit any style. Use it with Google Slides or PowerPoint. Include striking photographs, symbols, depictions, and other visuals. Fill, move around, or remove text boxes as desired. Test out color palettes and font mixtures. Edit and save your work, or work with colleagues. Download Human Resource Analytics Data Warehouse And Olap Cubes Business Intelligence Professional PDF and observe how to make your presentation outstanding. Give an impeccable presentation to your group and make your presentation unforgettable.


Slide 1 of 9
This slide represents the data warehouse and data marts architecture of business intelligence. It includes key recommendations such as utilized for distributing required information to each department etc. If you are looking for a format to display your unique thoughts, then the professionally designed Human Resource Analytics Data Warehouse And Data Marts Business Intelligence Introduction PDF is the one for you. You can use it as a Google Slides template or a PowerPoint template. Incorporate impressive visuals, symbols, images, and other charts. Modify or reorganize the text boxes as you desire. Experiment with shade schemes and font pairings. Alter, share or cooperate with other people on your work. Download Human Resource Analytics Data Warehouse And Data Marts Business Intelligence Introduction PDF and find out how to give a successful presentation. Present a perfect display to your team and make your presentation unforgettable.


Slide 1 of 9
This slide describes the essential elements of data lake and analytics solution including data movement, analytics, machine learning, and securely store, and cataloging data.Present like a pro with Essential Elements Of Data Lake And Analytics Solution Data Lake Creation With Hadoop Cluster Topics PDF Create beautiful presentations together with your team, using our easy-to-use presentation slides. Share your ideas in real-time and make changes on the fly by downloading our templates. So whether you are in the office, on the go, or in a remote location, you can stay in sync with your team and present your ideas with confidence. With Slidegeeks presentation got a whole lot easier. Grab these presentations today.


Slide 1 of 9
This slide represents the data warehouse and OLAP cubes architecture of business intelligence. It includes key recommendations such as used by companies of all sizes etc. Make sure to capture your audiences attention in your business displays with our gratis customizable Business Analytics Application Data Warehouse And Olap Cubes Business Intelligence Introduction PDF. These are great for business strategies, office conferences, capital raising or task suggestions. If you desire to acquire more customers for your tech business and ensure they stay satisfied, create your own sales presentation with these plain slides.


Slide 1 of 9
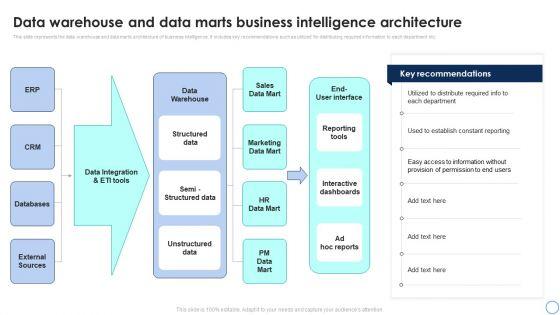
This slide represents the data warehouse and data marts architecture of business intelligence. It includes key recommendations such as utilized for distributing required information to each department etc. Crafting an eye-catching presentation has never been more straightforward. Let your presentation shine with this tasteful yet straightforward Business Analytics Application Data Warehouse And Data Marts Business Intelligence Topics PDF template. It offers a minimalistic and classy look that is great for making a statement. The colors have been employed intelligently to add a bit of playfulness while still remaining professional. Construct the ideal Business Analytics Application Data Warehouse And Data Marts Business Intelligence Topics PDF that effortlessly grabs the attention of your audience Begin now and be certain to wow your customers.


Slide 1 of 9
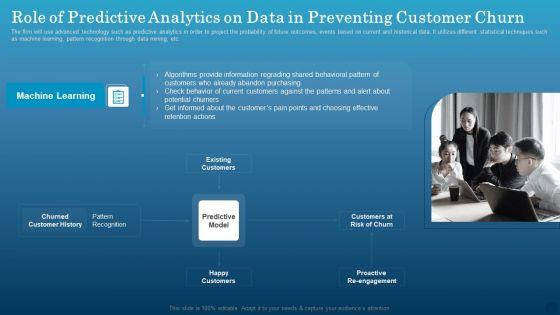
The firm will use advanced technology such as predictive analytics in order to project the probability of future outcomes, events based on current and historical data. It utilizes different statistical techniques such as machine learning, pattern recognition through data mining, etc. Get a simple yet stunning designed Role Of Predictive Analytics On Data In Preventing Customer Churn Formats PDF. It is the best one to establish the tone in your meetings. It is an excellent way to make your presentations highly effective. So, download this PPT today from Slidegeeks and see the positive impacts. Our easy to edit Role Of Predictive Analytics On Data In Preventing Customer Churn Formats PDF can be your go-to option for all upcoming conferences and meetings. So, what are you waiting for Grab this template today.
SHOW
- 60
- 120
- 180
DISPLAYING: 60 of 151 Item(s)
Page
