- Sign up
- Sign In
 AI PPT Maker
 Templates
 PPT Bundles
 Design Services
 Business PPTs
 Business Plan
 Management
 Strategy
 Introduction PPT
 Roadmap
 Self Introduction
 Timelines
 Process
 Marketing
 Agenda
 Technology
 Medical
 Startup Business Plan
 Cyber Security
 Dashboards
 SWOT
SWOT Proposals
 Education
 Pitch Deck
 Digital Marketing
 KPIs
KPIs Project Management
 Product Management
 Artificial Intelligence
 Target Market
 Communication
 Supply Chain
 Google Slides
 Research Services
 One Pagers
 All Categories
Analytics measurement PowerPoint Presentation Templates and Google Slides
41 Item(s)

Presenting this set of slides with name computing outcome evaluation measuring analytics ppt powerpoint presentation complete deck. The topics discussed in these slides are evaluation, measuring, analytics, performance, measures. This is a completely editable PowerPoint presentation and is available for immediate download. Download now and impress your audience.
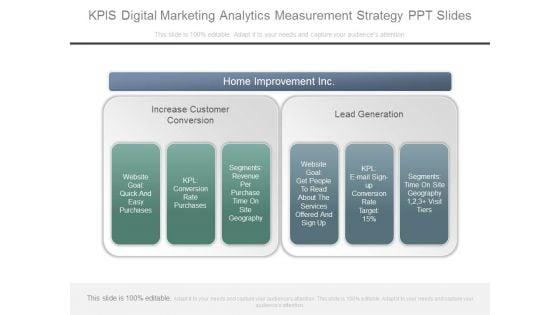
This is a kpis digital marketing analytics measurement strategy ppt slides. This is a six stage process. The stages in this process are home improvement inc, increase customer conversion, lead generation, website goal quick and easy purchases, kpl conversion rate purchases, segments revenue per purchase time on site geography, website goal get people to read about the services offered and sign up, kpl e mail sign up conversion rate target 15 percentage, segments, time on site geography visit tiers. \n


Presenting this set of slides with name social media analytics measurement ppt powerpoint presentation professional structure cpb. This is an editable Powerpoint nine stages graphic that deals with topics like social media analytics measurement to help convey your message better graphically. This product is a premium product available for immediate download and is 100 percent editable in Powerpoint. Download this now and use it in your presentations to impress your audience.


The following slide showcases digital marketing success evaluation key performance indicators for effective targeting and global reach. It includes elements such as visitors, return on investments, dormancy rate, lead conversion rate, click through rate CTR, traffic sources etc. Boost your pitch with our creative Guide For Marketing Analytics To Improve Decisions Digital Marketing Success Measurement Dashboard Guidelines PDF. Deliver an awe-inspiring pitch that will mesmerize everyone. Using these presentation templates you will surely catch everyones attention. You can browse the ppts collection on our website. We have researchers who are experts at creating the right content for the templates. So you do not have to invest time in any additional work. Just grab the template now and use them.
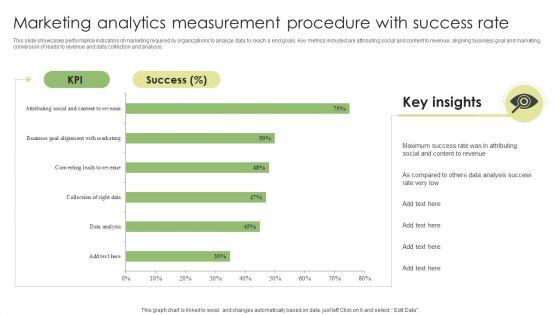

This slide showcases performance indicators of marketing required by organizations to analyze data to reach a end goals. Key metrics included are attributing social and content to revenue, aligning business goal and marketing, conversion of leads to revenue and data collection and analysis. Showcasing this set of slides titled Marketing Analytics Measurement Procedure With Success Rate Guidelines PDF. The topics addressed in these templates areMarketing Analytics Measurement, Procedure With Success Rate. All the content presented in this PPT design is completely editable. Download it and make adjustments in color, background, font etc. as per your unique business setting.

Do you have to make sure that everyone on your team knows about any specific topic I yes, then you should give Retail Analytics Dashboard To Measure Merchandise Planning Effectiveness Designs PDF a try. Our experts have put a lot of knowledge and effort into creating this impeccable Retail Analytics Dashboard To Measure Merchandise Planning Effectiveness Designs PDF. You can use this template for your upcoming presentations, as the slides are perfect to represent even the tiniest detail. You can download these templates from the Slidegeeks website and these are easy to edit. So grab these today.


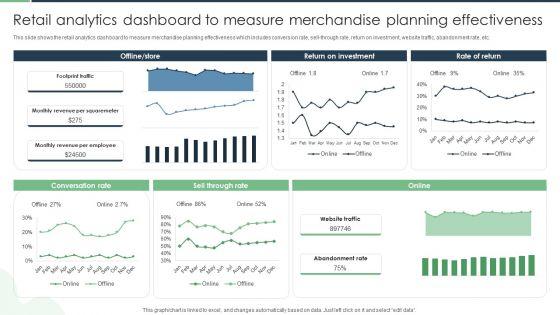
This slide shows the retail analytics dashboard to measure merchandise planning effectiveness which includes conversion rate, sell through rate, return on investment, website traffic, abandonment rate, etc. Are you searching for a Retail Analytics Dashboard To Measure Merchandise Planning Effectiveness Diagrams PDF that is uncluttered, straightforward, and original Its easy to edit, and you can change the colors to suit your personal or business branding. For a presentation that expresses how much effort you have put in, this template is ideal With all of its features, including tables, diagrams, statistics, and lists, its perfect for a business plan presentation. Make your ideas more appealing with these professional slides. Download Retail Analytics Dashboard To Measure Merchandise Planning Effectiveness Diagrams PDF from Slidegeeks today.

This slide shows the retail analytics dashboard to measure merchandise planning effectiveness which includes conversion rate, sell through rate, return on investment, website traffic, abandonment rate, etc. Make sure to capture your audiences attention in your business displays with our gratis customizable Retail Analytics Dashboard To Measure Merchandise Planning Effectiveness Microsoft PDF. These are great for business strategies, office conferences, capital raising or task suggestions. If you desire to acquire more customers for your tech business and ensure they stay satisfied, create your own sales presentation with these plain slides.


The following dashboard helps the organization in analyzing the key metrics to track performance of their website marketing strategy, these metrics are visits per week. Traffic source etc. Deliver and pitch your topic in the best possible manner with this Website Analytic Dashboard To Measure Marketing Effectiveness Demonstration PDF. Use them to share invaluable insights on Website Analytic Dashboard, Measure Marketing Effectiveness and impress your audience. This template can be altered and modified as per your expectations. So, grab it now.
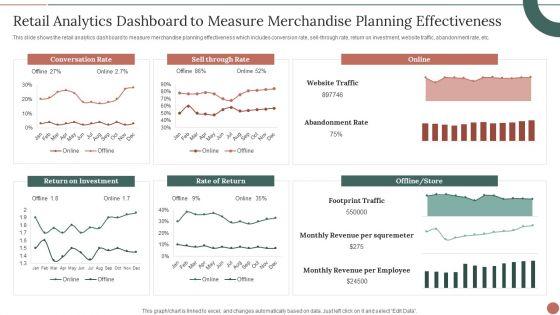

This slide shows the retail analytics dashboard to measure merchandise planning effectiveness which includes conversion rate, sell through rate, return on investment, website traffic, abandonment rate, etc. Deliver an awe inspiring pitch with this creative Retail Analytics Dashboard To Measure Merchandise Planning Effectiveness Information PDF bundle. Topics like Return On Investment, Conversation Rate, Rate Of Return can be discussed with this completely editable template. It is available for immediate download depending on the needs and requirements of the user.
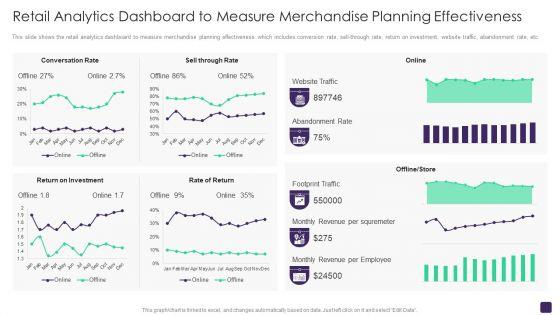

This slide shows the retail analytics dashboard to measure merchandise planning effectiveness which includes conversion rate, sell-through rate, return on investment, website traffic, abandonment rate, etc. Deliver an awe inspiring pitch with this creative Retail Merchandising Program Retail Analytics Dashboard To Measure Merchandise Planning Professional PDF bundle. Topics like Conversation Rate, Sell Through Rate, Return On Investment, Offline, Store can be discussed with this completely editable template. It is available for immediate download depending on the needs and requirements of the user.


This template covers key performance indicator KPI to determine the performance against the company objectives. These Social media KPIs would be focusing on social engagements, content reach, purchase leads and conversions. Presenting Social Media Kpi Analytics Measurement Demonstration PDF to provide visual cues and insights. Share and navigate important information on one stages that need your due attention. This template can be used to pitch topics like Metrics, Social Media, Improvement Measures. In addtion, this PPT design contains high resolution images, graphics, etc, that are easily editable and available for immediate download.
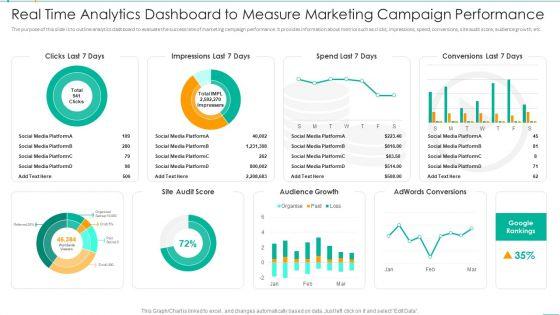
The purpose of this slide is to outline analytics dashboard to evaluate the success rate of marketing campaign performance. It provides information about metrics such as clicks, impressions, spend, conversions, site audit score, audience growth, etc. Pitch your topic with ease and precision using this Real Time Analytics Dashboard To Measure Marketing Campaign Performance Information PDF. This layout presents information on Real Time Analytics Dashboard To Measure Marketing Campaign Performance. It is also available for immediate download and adjustment. So, changes can be made in the color, design, graphics or any other component to create a unique layout.
Persuade your audience using this Analytics Icon To Measure Marketing Campaign Performance Structure PDF. This PPT design covers four stages, thus making it a great tool to use. It also caters to a variety of topics including Analytics Icon To Measure Marketing Campaign Performance. Download this PPT design now to present a convincing pitch that not only emphasizes the topic but also showcases your presentation skills.
Persuade your audience using this analyst icon measuring data using analytical techniques professional pdf. This PPT design covers four stages, thus making it a great tool to use. It also caters to a variety of topics including analyst icon measuring data using analytical techniques. Download this PPT design now to present a convincing pitch that not only emphasizes the topic but also showcases your presentation skills.
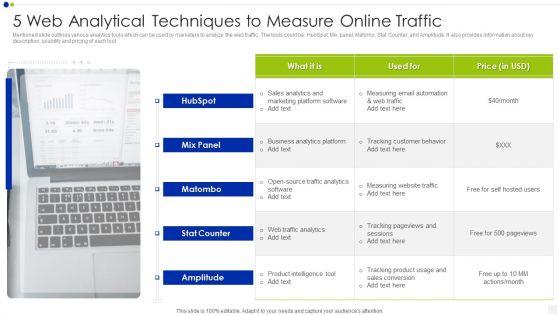
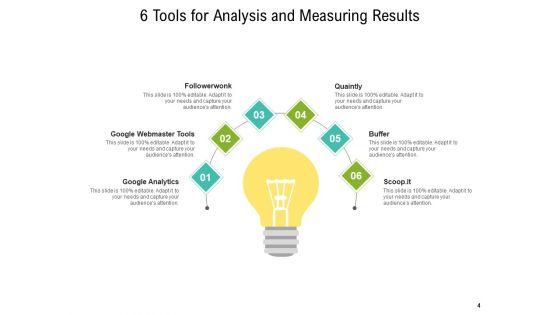
Mentioned slide outlines various analytics tools which can be used by marketers to analyze the web traffic. The tools could be HubSpot Mix panel Matomo Stat Counter and Amplitude. It also provides information about key description, usability and pricing of each tool. Presenting 5 web analytical techniques to measure online traffic download pdf to dispense important information. This template comprises five stages. It also presents valuable insights into the topics including analytics, sales, marketing. This is a completely customizable PowerPoint theme that can be put to use immediately. So, download it and address the topic impactfully.
This template covers key performance indicator KPI to determine the performance against the company objectives. These Social media KPIs would be focusing on social engagements, content reach, purchase leads and conversions. Deliver an awe inspiring pitch with this creative social network playbook social media kpi analytics measurement ppt icon demonstration pdf bundle. Topics like social media kpi analytics measurement can be discussed with this completely editable template. It is available for immediate download depending on the needs and requirements of the user.
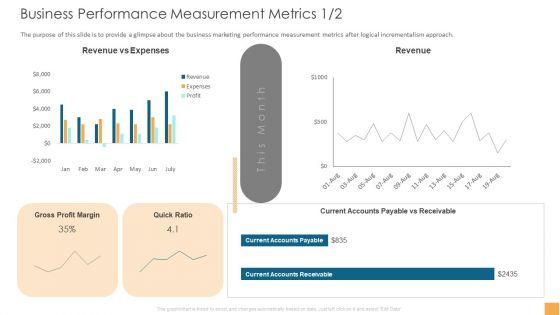

The purpose of this slide is to provide a glimpse about the business marketing performance measurement metrics after logical incrementalism approach. Deliver an awe-inspiring pitch with this creative analytical incrementalism business performance measurement metrics download pdf bundle. Topics like sales revenue, new customer, sales growth, sales region performance, profit can be discussed with this completely editable template. It is available for immediate download depending on the needs and requirements of the user.
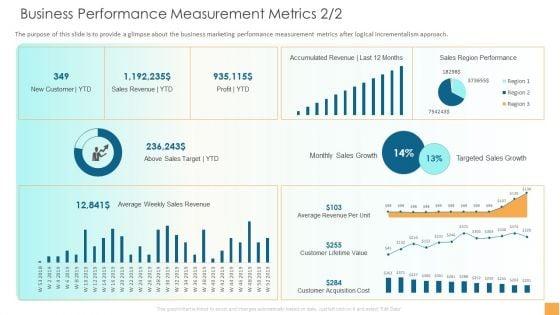

The purpose of this slide is to provide a glimpse about the business marketing performance measurement metrics after logical incrementalism approach. Deliver an awe-inspiring pitch with this creative analytical incrementalism business performance measurement metrics sales infographics pdf bundle. Topics like gross profit margin, revenue, quick ratio can be discussed with this completely editable template. It is available for immediate download depending on the needs and requirements of the user.


The biggest companies are measuring customer behavior to create a better customer experience and drive customer acquisition, retention and growth. Deliver an awe inspiring pitch with this creative customer behavioral data and analytics why measure customer behavior formats pdf bundle. Topics like why measure customer behavior can be discussed with this completely editable template. It is available for immediate download depending on the needs and requirements of the user.

The Net Promoter Score measures the willingness of customers to recommend the companys products or services to others. It helps in gauging the customers overall satisfaction with the companys product or service. Deliver and pitch your topic in the best possible manner with this customer behavioral data and analytics measure net promoter score mockup pdf. Use them to share invaluable insights on promoters, passives, detractors and impress your audience. This template can be altered and modified as per your expectations. So, grab it now.
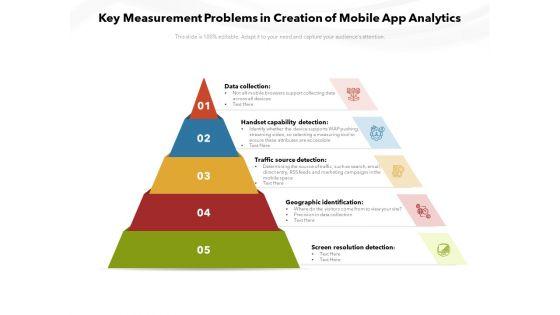

Presenting key measurement problems in creation of mobile app analytics ppt powerpoint presentation pictures inspiration pdf to dispense important information. This template comprises five stages. It also presents valuable insights into the topics including data collection, handset capability detection, traffic source detection, geographic identification. This is a completely customizable PowerPoint theme that can be put to use immediately. So, download it and address the topic impactfully.
Presenting this set of slides with name online promotion tracking analytics measurement icon ppt powerpoint presentation file inspiration pdf. This is a three stage process. The stages in this process are online promotion tracking analytics measurement icon. This is a completely editable PowerPoint presentation and is available for immediate download. Download now and impress your audience.
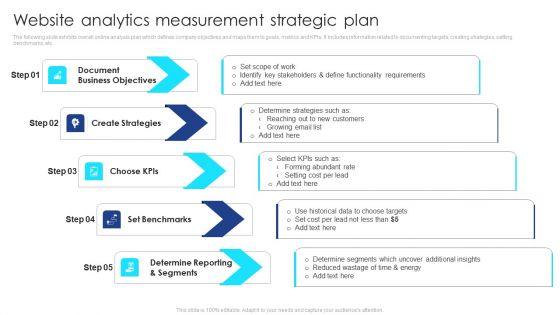


The following slide exhibits overall online analysis plan which defines company objectives and maps them to goals, metrics and KPIs. It includes information related to documenting targets, creating strategies, setting benchmarks, etc. Presenting Website Analytics Measurement Strategic Plan Diagrams PDF to dispense important information. This template comprises five stages. It also presents valuable insights into the topics including Document Business Objectives, Create Strategies, Choose Kpis, Set Benchmarks, Determine Reporting And Segments. This is a completely customizable PowerPoint theme that can be put to use immediately. So, download it and address the topic impactfully.
Persuade your audience using this Website Analytics Icon To Measure Customer Behaviour Portrait PDF. This PPT design covers four stages, thus making it a great tool to use. It also caters to a variety of topics including Website Analytics Icon, Measure Customer Behaviour. Download this PPT design now to present a convincing pitch that not only emphasizes the topic but also showcases your presentation skills.
Presenting Website Analytics Icon For Measuring Market Revenue Ideas PDF to dispense important information. This template comprises four stages. It also presents valuable insights into the topics including Website Analytics Icon, Measuring Market Revenue. This is a completely customizable PowerPoint theme that can be put to use immediately. So, download it and address the topic impactfully.

This template covers key performance indicator KPI to determine the performance against the company objectives. These Social media KPIs would be focusing on social engagements, content reach, purchase leads and conversions.The best PPT templates are a great way to save time, energy, and resources. Slidegeeks have 100pecent editable powerpoint slides making them incredibly versatile. With these quality presentation templates, you can create a captivating and memorable presentation by combining visually appealing slides and effectively communicating your message. Download xxxxxxxxxxxxxxxxxxxxx from Slidegeeks and deliver a wonderful presentation.

This template covers key performance indicator KPI to determine the performance against the company objectives. These Social media KPIs would be focusing on social engagements, content reach, purchase leads and conversions. If you are looking for a format to display your unique thoughts, then the professionally designed Social Media Kpi Analytics Measurement Business Social Strategy Guide Infographics PDF is the one for you. You can use it as a Google Slides template or a PowerPoint template. Incorporate impressive visuals, symbols, images, and other charts. Modify or reorganize the text boxes as you desire. Experiment with shade schemes and font pairings. Alter, share or cooperate with other people on your work. Download Social Media Kpi Analytics Measurement Business Social Strategy Guide Infographics PDF and find out how to give a successful presentation. Present a perfect display to your team and make your presentation unforgettable.
This slide analyses analytics dashboard measuring the effect of adopting digital initiatives on power production efficiency. It includes total capacity, average efficiency of turbines, system frequency and energy production efficiency. Do you have to make sure that everyone on your team knows about any specific topic I yes, then you should give Analytics Dashboard Measuring Digital Transformation Journey PPT Slide DT SS V a try. Our experts have put a lot of knowledge and effort into creating this impeccable Analytics Dashboard Measuring Digital Transformation Journey PPT Slide DT SS V. You can use this template for your upcoming presentations, as the slides are perfect to represent even the tiniest detail. You can download these templates from the Slidegeeks website and these are easy to edit. So grab these today This slide analyses analytics dashboard measuring the effect of adopting digital initiatives on power production efficiency. It includes total capacity, average efficiency of turbines, system frequency and energy production efficiency.
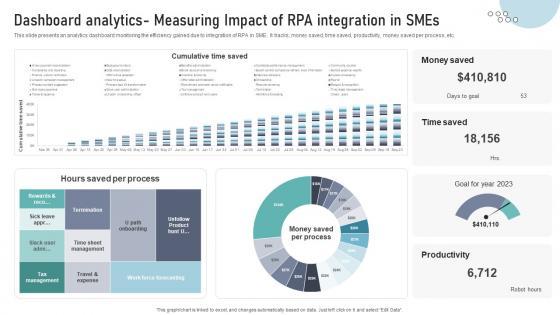

This slide presents an analytics dashboard monitoring the efficiency gained due to integration of RPA in SME. It tracks, money saved, time saved, productivity, money saved per process, etc.Formulating a presentation can take up a lot of effort and time, so the content and message should always be the primary focus. The visuals of the PowerPoint can enhance the presenters message, so our Dashboard Analytics Measuring Impact Of RPA Integration In SMEs DT SS V was created to help save time. Instead of worrying about the design, the presenter can concentrate on the message while our designers work on creating the ideal templates for whatever situation is needed. Slidegeeks has experts for everything from amazing designs to valuable content, we have put everything into Dashboard Analytics Measuring Impact Of RPA Integration In SMEs DT SS V. This slide presents an analytics dashboard monitoring the efficiency gained due to integration of RPA in SME. It tracks, money saved, time saved, productivity, money saved per process, etc.
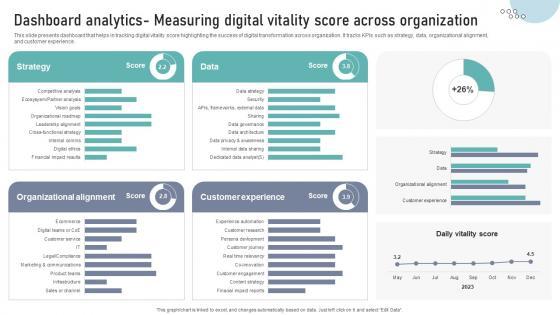

This slide presents dashboard that helps in tracking digital vitality score highlighting the success of digital transformation across organization. It tracks KPIs such as strategy, data, organizational alignment,and customer experience.Make sure to capture your audiences attention in your business displays with our gratis customizable Dashboard Analytics Measuring Digital Vitality Score Across Organization DT SS V. These are great for business strategies, office conferences, capital raising or task suggestions. If you desire to acquire more customers for your tech business and ensure they stay satisfied, create your own sales presentation with these plain slides. This slide presents dashboard that helps in tracking digital vitality score highlighting the success of digital transformation across organization. It tracks KPIs such as strategy, data, organizational alignment,and customer experience.


This slide represents a supply chain management dashboard measuring the efficiency of supply chain operations after effective digital transformation of retail operations. It includes inventory to sales, inventory turnover, carrying cost of inventory, inventory accuracy, and percentage out of stock items.If you are looking for a format to display your unique thoughts, then the professionally designed Dashboard Analytics Measuring Supply Chain Efficiency DT SS V is the one for you. You can use it as a Google Slides template or a PowerPoint template. Incorporate impressive visuals, symbols, images, and other charts. Modify or reorganize the text boxes as you desire. Experiment with shade schemes and font pairings. Alter, share or cooperate with other people on your work. Download Dashboard Analytics Measuring Supply Chain Efficiency DT SS V and find out how to give a successful presentation. Present a perfect display to your team and make your presentation unforgettable. This slide represents a supply chain management dashboard measuring the efficiency of supply chain operations after effective digital transformation of retail operations. It includes inventory to sales, inventory turnover, carrying cost of inventory, inventory accuracy, and percentage out of stock items.


This slide analyzes the impact od digital business model innovation on user metrics and recurring revenue of business. It tracks KPIs such as monthly recurring revenue, revenue growth, active users, life time value, cost of customer acquisition, churn rate, growth by channel, subscription plan, etc.Are you searching for a Dashboard Analytics Measuring Impact On User Metrics And Revenue Growth DT SS V that is uncluttered, straightforward, and original Its easy to edit, and you can change the colors to suit your personal or business branding. For a presentation that expresses how much effort you have put in, this template is ideal With all of its features, including tables, diagrams, statistics, and lists, its perfect for a business plan presentation. Make your ideas more appealing with these professional slides. Download Dashboard Analytics Measuring Impact On User Metrics And Revenue Growth DT SS V from Slidegeeks today. This slide analyzes the impact od digital business model innovation on user metrics and recurring revenue of business. It tracks KPIs such as monthly recurring revenue, revenue growth, active users, life time value, cost of customer acquisition, churn rate, growth by channel, subscription plan, etc.
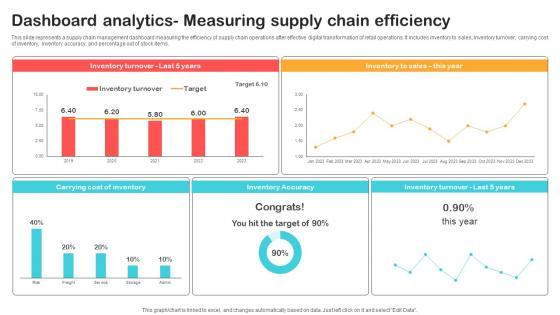
This slide represents a supply chain management dashboard measuring the efficiency of supply chain operations after effective digital transformation of retail operations. It includes inventory to sales, inventory turnover, carrying cost of inventory, inventory accuracy, and percentage out of stock items.If you are looking for a format to display your unique thoughts, then the professionally designed Dashboard Analytics Measuring Supply Chain Efficiency Optimizing Retail Operations With Digital DT SS V is the one for you. You can use it as a Google Slides template or a PowerPoint template. Incorporate impressive visuals, symbols, images, and other charts. Modify or reorganize the text boxes as you desire. Experiment with shade schemes and font pairings. Alter, share or cooperate with other people on your work. Download Dashboard Analytics Measuring Supply Chain Efficiency Optimizing Retail Operations With Digital DT SS V and find out how to give a successful presentation. Present a perfect display to your team and make your presentation unforgettable. This slide represents a supply chain management dashboard measuring the efficiency of supply chain operations after effective digital transformation of retail operations. It includes inventory to sales, inventory turnover, carrying cost of inventory, inventory accuracy, and percentage out of stock items.

This slide showcases common metrics that enable human resource managers to track and measure performance on different aspects and to predict the future. These metrics include time to hire, time to fill,absenteeism, offer acceptance rate, and voluntary turnover rate. Slidegeeks is here to make your presentations a breeze with Common Metrics Measured By Hr Analytics Analysing Hr Data For Effective Decision Making With our easy-to-use and customizable templates, you can focus on delivering your ideas rather than worrying about formatting. With a variety of designs to choose from, you are sure to find one that suits your needs. And with animations and unique photos, illustrations, and fonts, you can make your presentation pop. So whether you are giving a sales pitch or presenting to the board, make sure to check out Slidegeeks first This slide showcases common metrics that enable human resource managers to track and measure performance on different aspects and to predict the future. These metrics include time to hire, time to fill,absenteeism, offer acceptance rate, and voluntary turnover rate.


This slide showcases a dashboard for monitoring and reporting on asset allocation. It help track benchmarks asset class returns, calculates a composite index return for comparison with the portfolios performance and compares the current and target allocations with different chart options.Slidegeeks is one of the best resources for PowerPoint templates. You can download easily and regulate Asset Allocation Dashboard Analytics Measurement Strategic Investment Plan For Optimizing Risk SS V for your personal presentations from our wonderful collection. A few clicks is all it takes to discover and get the most relevant and appropriate templates. Use our Templates to add a unique zing and appeal to your presentation and meetings. All the slides are easy to edit and you can use them even for advertisement purposes. This slide showcases a dashboard for monitoring and reporting on asset allocation. It help track benchmarks asset class returns, calculates a composite index return for comparison with the portfolios performance and compares the current and target allocations with different chart options.

This slide showcases key performance indicators for HR department that can help organization to analyze training outcomes. Various elements includes are KPIs, type of training, budget training cost, actual training cost and training outcomes Showcasing this set of slides titled HR Analytics Metrics For Measuring Training Effectiveness Infographics Pdf The topics addressed in these templates are Percentage Rate, Training Completing, Marketing Training All the content presented in this PPT design is completely editable. Download it and make adjustments in color, background, font etc. as per your unique business setting. This slide showcases key performance indicators for HR department that can help organization to analyze training outcomes. Various elements includes are KPIs, type of training, budget training cost, actual training cost and training outcomes.

This slide presents various metrics to monitor product data analytics performance to enable businesses make informed decision. These metrics includes engagement metrices, activation metrices, acquisition metrices, monetization metrics, and retention metrices. Showcasing this set of slides titled Product Data Analytics Measuring Metrices For Business Ideas Pdf. The topics addressed in these templates are Engagement Metrics, Activation Metrics, Acquisition Metrics. All the content presented in this PPT design is completely editable. Download it and make adjustments in color, background, font etc. as per your unique business setting. This slide presents various metrics to monitor product data analytics performance to enable businesses make informed decision. These metrics includes engagement metrices, activation metrices, acquisition metrices, monetization metrics, and retention metrices.
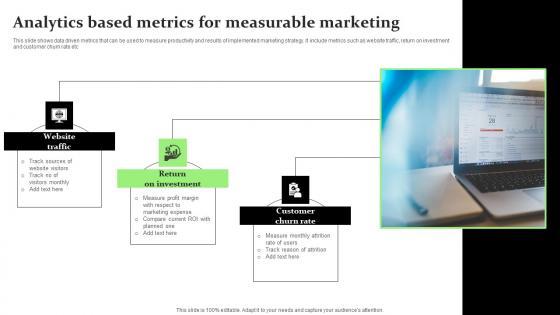
This slide shows data driven metrics that can be used to measure productivity and results of implemented marketing strategy. It include metrics such as website traffic, return on investment and customer churn rate etc.Pitch your topic with ease and precision using this Analytics Based Metrics For Measurable Marketing Guidelines Pdf This layout presents information on Website Traffic, Return Investment, Customer Churn Rate It is also available for immediate download and adjustment. So, changes can be made in the color, design, graphics or any other component to create a unique layout. This slide shows data driven metrics that can be used to measure productivity and results of implemented marketing strategy. It include metrics such as website traffic, return on investment and customer churn rate etc.
41 Item(s)