AI PPT Maker
Templates
PPT Bundles
Design Services
Business PPTs
Business Plan
Management
Strategy
Introduction PPT
Roadmap
Self Introduction
Timelines
Process
Marketing
Agenda
Technology
Medical
Startup Business Plan
Cyber Security
Dashboards
SWOT
Proposals
Education
Pitch Deck
Digital Marketing
KPIs
Project Management
Product Management
Artificial Intelligence
Target Market
Communication
Supply Chain
Google Slides
Research Services
 One Pagers
All Categories
Analyze Sales Performance PowerPoint Presentation Templates and Google Slides
14 Item(s)

Slide 1 of 2
This slide showcases a dashboard presenting various metrics to measure and analyze sales performance for revenue growth. It includes key components such as number of sales, revenue, profit, cost, sales revenue, sales increment, cost analysis and cross sell. Create an editable Inspecting Sales Optimization Areas Dashboard Analyzing Business Sales Performance Slides PDF that communicates your idea and engages your audience. Whether youre presenting a business or an educational presentation, pre-designed presentation templates help save time. Inspecting Sales Optimization Areas Dashboard Analyzing Business Sales Performance Slides PDF is highly customizable and very easy to edit, covering many different styles from creative to business presentations. Slidegeeks has creative team members who have crafted amazing templates. So, go and get them without any delay.

Slide 1 of 2
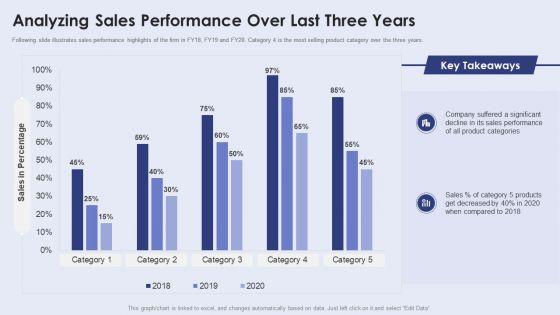
Following slide illustrates sales performance highlights of the firm in FY18, FY19 and FY20. Category 4 is the most selling product category over the three years. If your project calls for a presentation, then Slidegeeks is your go to partner because we have professionally designed, easy to edit templates that are perfect for any presentation. After downloading, you can easily edit Creating New Product Launch Campaign Strategy Analyzing Sales Performance Over Last Three Years Structure PDF and make the changes accordingly. You can rearrange slides or fill them with different images. Check out all the handy templates.
Slide 1 of 2
The following slide delineates a comprehensive medical dashboard which can be used by the pharma company to measure its sales strategy performance. The KPIs covered in the slide are top sales producers, sales channels, volume by product, etc. Showcasing this set of slides titled Pharma Medical Dashboard To Analyze Sales Strategy Performance Icons PDF. The topics addressed in these templates are Market Leaders, Sales Channels, Volume Product. All the content presented in this PPT design is completely editable. Download it and make adjustments in color, background, font etc. as per your unique business setting.

Slide 1 of 2
Following slide illustrates sales performance highlights of the firm in FY20, FY21 and FY22. Category 4 is the most selling product category over the three years.Deliver and pitch your topic in the best possible manner with this Effective Sales Plan For New Product Introduction In Market Analyzing Sales Performance Mockup PDF Use them to share invaluable insights on Company Suffered, Product Categories, Products Decreased and impress your audience. This template can be altered and modified as per your expectations. So, grab it now.
Slide 1 of 2
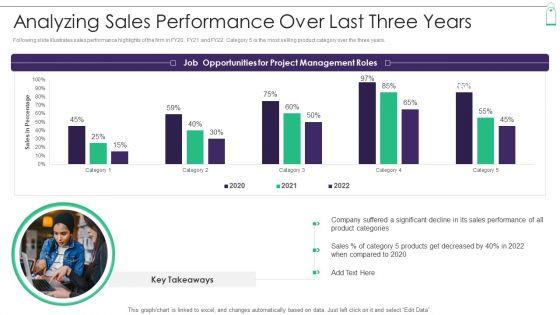
Following slide illustrates sales performance highlights of the firm in FY20, FY21 and FY22. Category 5 is the most selling product category over the three years. Deliver an awe inspiring pitch with this creative New Product Sales Strategy And Marketing Analyzing Sales Performance Over Last Three Years Introduction PDF bundle. Topics like Project Management Roles, Job Opportunities, Product Categories can be discussed with this completely editable template. It is available for immediate download depending on the needs and requirements of the user.


Slide 1 of 2
Following slide illustrates sales performance highlights of the firm in FY20, FY21 and FY22. Category 4 is the most selling product category over the three years.Deliver and pitch your topic in the best possible manner with this Effective Sales Technique For New Product Launch Analyzing Sales Performance Over Last Three Years Introduction PDF Use them to share invaluable insights on Sales Performance, Suffered Significant, Product Categories and impress your audience. This template can be altered and modified as per your expectations. So, grab it now.

Slide 1 of 2
Following slide illustrates sales performance highlights of the firm in FY20, FY21 and FY22. Category 4 is the most selling product category over the three years.Deliver an awe inspiring pitch with this creative Go To Market Approach For New Product Analyzing Sales Performance Over Last Three Years Inspiration PDF bundle. Topics like Analyzing Sales Performance Over Last Three Years can be discussed with this completely editable template. It is available for immediate download depending on the needs and requirements of the user.

Slide 1 of 2
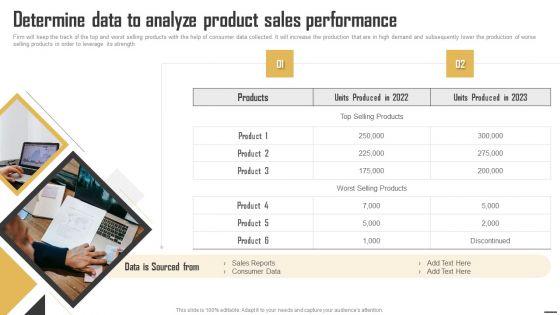
Firm will keep the track of the top and worst selling products. It will increase the production that are in high demand and subsequently lower the production of worse selling products in order to leverage its strength. Deliver and pitch your topic in the best possible manner with this business advancement internal growth analyzing product sales performance mockup pdf. Use them to share invaluable insights on production, strength, products and impress your audience. This template can be altered and modified as per your expectations. So, grab it now.


Slide 1 of 9
Firm will keep the track of the top and worst selling products with the help of consumer data collected. It will increase the production that are in high demand and subsequently lower the production of worse selling products in order to leverage its strength. Do you have an important presentation coming up Are you looking for something that will make your presentation stand out from the rest Look no further than Data Monetization And Management Determine Data To Analyze Product Sales Performance Summary PDF. With our professional designs, you can trust that your presentation will pop and make delivering it a smooth process. And with Slidegeeks, you can trust that your presentation will be unique and memorable. So why wait Grab Data Monetization And Management Determine Data To Analyze Product Sales Performance Summary PDF today and make your presentation stand out from the rest.

Slide 1 of 1
Firm will keep the track of the top and worst selling products with the help of consumer data collected. It will increase the production that are in high demand and subsequently lower the production of worse selling products in order to leverage its strength. Do you have an important presentation coming up Are you looking for something that will make your presentation stand out from the rest Look no further than Identifying Direct And Indirect Determine Data To Analyze Product Sales Performance Ideas PDF. With our professional designs, you can trust that your presentation will pop and make delivering it a smooth process. And with Slidegeeks, you can trust that your presentation will be unique and memorable. So why wait Grab Identifying Direct And Indirect Determine Data To Analyze Product Sales Performance Ideas PDF today and make your presentation stand out from the rest


Slide 1 of 9
Firm will keep the track of the top and worst selling products with the help of consumer data collected. It will increase the production that are in high demand and subsequently lower the production of worse selling products in order to leverage its strength. Create an editable Data Monetization Approach To Drive Business Growth Determine Data To Analyze Product Sales Performance Introduction PDF that communicates your idea and engages your audience. Whether youre presenting a business or an educational presentation, pre designed presentation templates help save time. Data Monetization Approach To Drive Business Growth Determine Data To Analyze Product Sales Performance Introduction PDF is highly customizable and very easy to edit, covering many different styles from creative to business presentations. Slidegeeks has creative team members who have crafted amazing templates. So, go and get them without any delay.


Slide 1 of 9
Firm will keep the track of the top worst selling products with the help of consumer data collected. It will increase the production that are in high demand subsequently lower the production of worse selling products in order to leverage its strength. Deliver and pitch your topic in the best possible manner with this Data Valuation And Monetization Determine Data To Analyze Product Sales Performance Elements PDF. Use them to share invaluable insights on Sales Reports, Consumer Data, Data Sourced and impress your audience. This template can be altered and modified as per your expectations. So, grab it now.


Slide 1 of 10
This slide showcases various metrics to measure business performance for identifying organizational improvement areas. It includes key components such as financial status, customer satisfaction, business growth and internal objectives. Showcasing this set of slides titled Dashboard Of Lead Metrics To Analyze Business Sales Performance Ppt Summary Graphics Pdf. The topics addressed in these templates are Sales Increment, Cross Sell, Cost Analysis. All the content presented in this PPT design is completely editable. Download it and make adjustments in color, background, font etc. as per your unique business setting. This slide showcases various metrics to measure business performance for identifying organizational improvement areas. It includes key components such as financial status, customer satisfaction, business growth and internal objectives.


Slide 1 of 2
Following slide outlines operational status report which can be used to measure the companys sales performance in different years. The report covers information about expenses and sales in different regions, sales volume trend, operational effectiveness by different industries, etc. Showcasing this set of slides titled Operations Status Report To Analyze Sales Performance Portrait PDF. The topics addressed in these templates are Operations Status Report, Analyze Sales Performance. All the content presented in this PPT design is completely editable. Download it and make adjustments in color, background, font etc. as per your unique business setting.
14 Item(s)
