AI PPT Maker
Templates
PPT Bundles
Design Services
Business PPTs
Business Plan
Management
Strategy
Introduction PPT
Roadmap
Self Introduction
Timelines
Process
Marketing
Agenda
Technology
Medical
Startup Business Plan
Cyber Security
Dashboards
SWOT
Proposals
Education
Pitch Deck
Digital Marketing
KPIs
Project Management
Product Management
Artificial Intelligence
Target Market
Communication
Supply Chain
Google Slides
Research Services
 One Pagers
All Categories
And Analysis Dashboard PowerPoint Presentation Templates and Google Slides
33 Item(s)
Slide 1 of 2
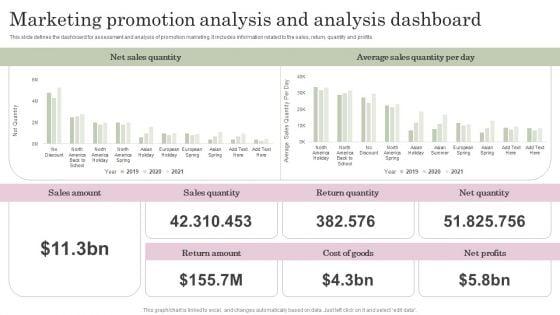
This slide defines the dashboard for assessment and analysis of promotion marketing. It includes information related to the sales, return, quantity and profits. Showcasing this set of slides titled Marketing Promotion Analysis And Analysis Dashboard Brochure PDF. The topics addressed in these templates are Sales Amount, Sales Quantity, Return Quantity. All the content presented in this PPT design is completely editable. Download it and make adjustments in color, background, font etc. as per your unique business setting.

Slide 1 of 2
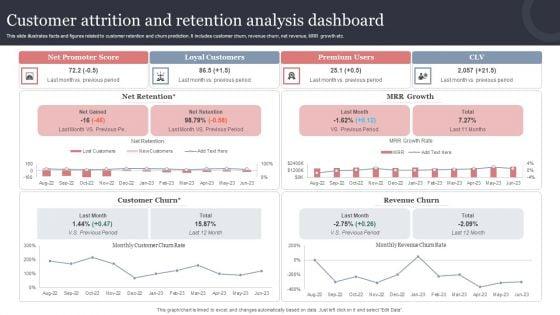
This slide illustrates facts and figures related to customer retention and churn prediction. It includes customer churn, revenue churn, net revenue, MRR growth etc. Showcasing this set of slides titled Customer Attrition And Retention Analysis Dashboard Background PDF. The topics addressed in these templates are Net Promoter Score, Loyal Customers, Premium Users, Customer Churn, Revenue Churn. All the content presented in this PPT design is completely editable. Download it and make adjustments in color, background, font etc. as per your unique business setting.

Slide 1 of 2
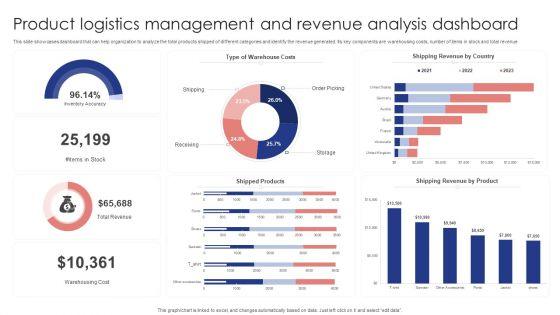
This slide showcases dashboard that can help organization to analyze the total products shipped of different categories and identify the revenue generated. Its key components are warehousing costs, number of items in stock and total revenue. Pitch your topic with ease and precision using this Product Logistics Management And Revenue Analysis Dashboard Demonstration PDF. This layout presents information on Warehouse Costs, Shipping Revenue Country, Shipped Products . It is also available for immediate download and adjustment. So, changes can be made in the color, design, graphics or any other component to create a unique layout.


Slide 1 of 2
This slide defines the dashboard analyzing the marketing and advertising based on demographic status. It includes information related to the impression gender, age and designated market area DMA. Showcasing this set of slides titled Marketing And Advertising Analysis Dashboard Based On Demographic Data Demonstration PDF. The topics addressed in these templates are Gender, Impressions, Demographic Data All the content presented in this PPT design is completely editable. Download it and make adjustments in color, background, font etc. as per your unique business setting.


Slide 1 of 2
The purpose of this template is to explain the analysis of employee demographics and designation dashboard. The slide provides information about gender, ethnicity, location and structure. Pitch your topic with ease and precision using this Employee Demographics Data And Designation Analysis Dashboard Introduction PDF. This layout presents information on Job Functions, Top Locations, Employee Structure It is also available for immediate download and adjustment. So, changes can be made in the color, design, graphics or any other component to create a unique layout.


Slide 1 of 2
The slide shows the monitoring and analysis dashboard of monthly production. The slide covers run-time and down time comparison, production cost of last 12 months, and overall equipment effectiveness. Showcasing this set of slides titled Monthly Production Summary Monitoring And Analysis Dashboard Guidelines PDF. The topics addressed in these templates are Availability, Rework Quantity, Manufacturing Cost. All the content presented in this PPT design is completely editable. Download it and make adjustments in color, background, font etc. as per your unique business setting.
Slide 1 of 2
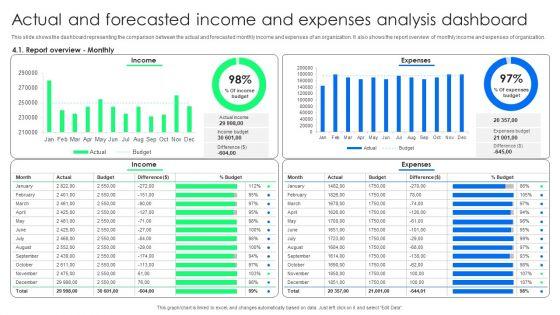
This slide shows the dashboard representing the comparison between the actual and forecasted monthly income and expenses of an organization. It also shows the report overview of monthly income and expenses of organization. Showcasing this set of slides titled Actual And Forecasted Income And Expenses Analysis Dashboard Portrait PDF. The topics addressed in these templates are Expenses, Income, Expenses. All the content presented in this PPT design is completely editable. Download it and make adjustments in color, background, font etc. as per your unique business setting.

Slide 1 of 2
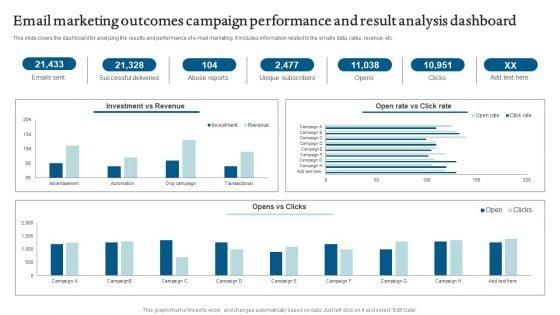
Pitch your topic with ease and precision using this Email Marketing Outcomes Campaign Performance And Result Analysis Dashboard Introduction PDF. This layout presents information on Email Marketing Outcomes, Campaign Performance, Result Analysis Dashboard. It is also available for immediate download and adjustment. So, changes can be made in the color, design, graphics or any other component to create a unique layout.

Slide 1 of 2
This slide covers project progress and task status along with timeline. It also includes details such project manager, status, budget allocations for different activities, risks involved, pending actions involved and open change requests. Showcasing this set of slides titled Project Status And Performance Analysis Dashboard Ppt Slides Brochure PDF. The topics addressed in these templates are Project Health, Design, Project Timeline, Other Key Updates, Notes. All the content presented in this PPT design is completely editable. Download it and make adjustments in color, background, font etc. as per your unique business setting.

Slide 1 of 2
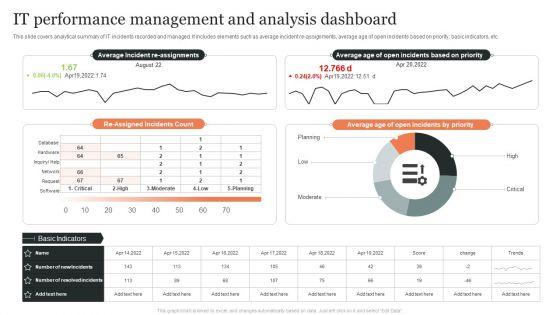
This slide covers analytical summary of IT incidents recorded and managed. It includes elements such as average incident re-assignments, average age of open incidents based on priority, basic indicators, etc. Showcasing this set of slides titled IT Performance Management And Analysis Dashboard Ppt Styles Portrait PDF. The topics addressed in these templates are Average Age, Open Incidents Priority, Re Assigned, Incidents Count. All the content presented in this PPT design is completely editable. Download it and make adjustments in color, background, font etc. as per your unique business setting.
Slide 1 of 2
This slide defines the dashboard for five years sales forecast and analysis . It includes information related to the estimated and actual sales. Pitch your topic with ease and precision using this Five Years Sales Projection And Analysis Dashboard Icons PDF. This layout presents information on Forecast Value, Forecast Accuracy, Won Opportunities. It is also available for immediate download and adjustment. So, changes can be made in the color, design, graphics or any other component to create a unique layout.

Slide 1 of 2
This slide defines the dashboard for five years budget forecast and analysis for an organization. It includes information related to the expenses and revenue. Showcasing this set of slides titled Five Years Budget Projection And Analysis Dashboard Graphics PDF. The topics addressed in these templates are Revenues, Expenses, Budget. All the content presented in this PPT design is completely editable. Download it and make adjustments in color, background, font etc. as per your unique business setting.
Slide 1 of 2
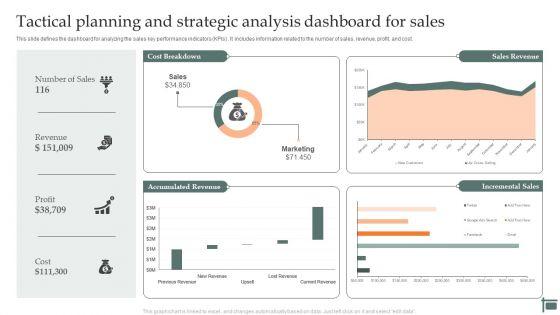
Persuade your audience using this Tactical Planning And Strategic Analysis Dashboard For Sales Infographics PDF. This PPT design covers three stages, thus making it a great tool to use. It also caters to a variety of topics including Tactical, Planning And Analyzing, Organizational Goals, Icon. Download this PPT design now to present a convincing pitch that not only emphasizes the topic but also showcases your presentation skills.

Slide 1 of 2
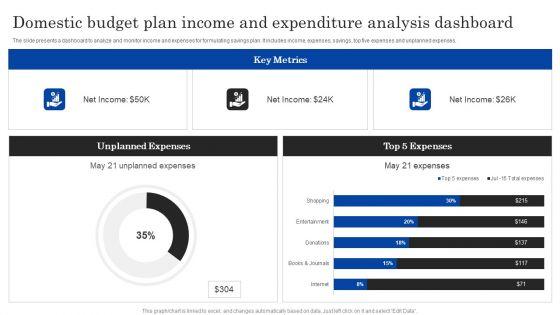
The slide presents a dashboard to analyze and monitor income and expenses for formulating savings plan. It includes income, expenses, savings, top five expenses and unplanned expenses.Pitch your topic with ease and precision using this Domestic Budget Plan Income And Expenditure Analysis Dashboard Ppt PowerPoint Presentation Layouts Clipart Images PDF. This layout presents information on Unplanned Expenses, Expenses, Key Metrics. It is also available for immediate download and adjustment. So, changes can be made in the color, design, graphics or any other component to create a unique layout.
Slide 1 of 2
Deliver and pitch your topic in the best possible manner with this Issues And Impact Of Failure Mode And Effects Analysis Dashboard Process Failure Mode Effects Analysis PFMEA Icons PDF. Use them to share invaluable insights on Operator Instructions, Operator Instructions, Recommended Actions and impress your audience. This template can be altered and modified as per your expectations. So, grab it now.


Slide 1 of 2
Deliver an awe inspiring pitch with this creative Issues And Impact Of Failure Mode And Effects Analysis Dashboard Failure Mode Effects Analysis FMEA Clipart PDF bundle. Topics like Overdue Recommended, Responsibility Problems, Landing Functionality can be discussed with this completely editable template. It is available for immediate download depending on the needs and requirements of the user.


Slide 1 of 2
The following slide highlights the employee workload management and analysis dashboard illustrating key headings which includes employee status, monthly workload status, workload based on activity, workload analysis and employee efficiency. Pitch your topic with ease and precision using thisPersonal Job Assignment Management And Analysis Dashboard Diagrams PDF. This layout presents information on Employee Status, Monthly Workload Status, Workload Based Activity. It is also available for immediate download and adjustment. So, changes can be made in the color, design, graphics or any other component to create a unique layout.
Slide 1 of 2
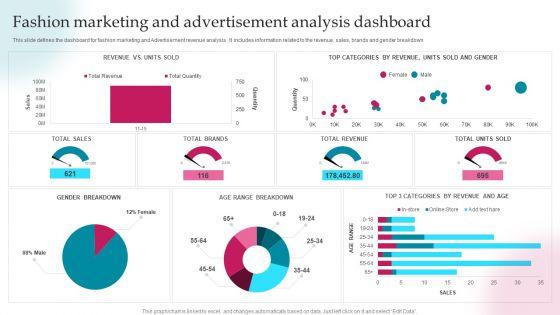
This slide defines the dashboard for fashion marketing and Advertisement revenue analysis . It includes information related to the revenue, sales, brands and gender breakdown. Pitch your topic with ease and precision using this Fashion Marketing And Advertisement Analysis Dashboard Ppt PowerPoint Presentation Gallery Topics PDF. This layout presents information on Total Revenue, Total Brands, Total Sales. It is also available for immediate download and adjustment. So, changes can be made in the color, design, graphics or any other component to create a unique layout.

Slide 1 of 2
This slide covers reporting and spend analysis waterfall model. It also includes performance comparison based on time, such as last year, last quarte etc. Deliver and pitch your topic in the best possible manner with this Procurement Analytics Tools And Strategies Report And Analysis Through Kpis And Waterfall Professional PDF. Use them to share invaluable insights on Procurement Savings, Contracts Expiring, Currency Transactions and impress your audience. This template can be altered and modified as per your expectations. So, grab it now.

Slide 1 of 2
This slide defines the analysis dashboard for skill acquisition and transformation. It includes information related to the employee cost, revenue , turnover rate and survey results. Showcasing this set of slides titled Skill Acquisition And Transformation Analysis Dashboard Themes PDF. The topics addressed in these templates are Internal Promotion Rate, Employee Turnover Rate, Average Employee Tenure. All the content presented in this PPT design is completely editable. Download it and make adjustments in color, background, font etc. as per your unique business setting.

Slide 1 of 2
This slide covers reporting and spend analysis waterfall model. It also includes performance comparison based on time, such as last year, last quarte etc. Deliver and pitch your topic in the best possible manner with this Purchase Assessment Process Report And Analysis Through Kpis And Waterfall Model Graphics PDF Use them to share invaluable insights on Contracts Expiring, Currency Transactions, Favorable Adjustments and impress your audience. This template can be altered and modified as per your expectations. So, grab it now.


Slide 1 of 2
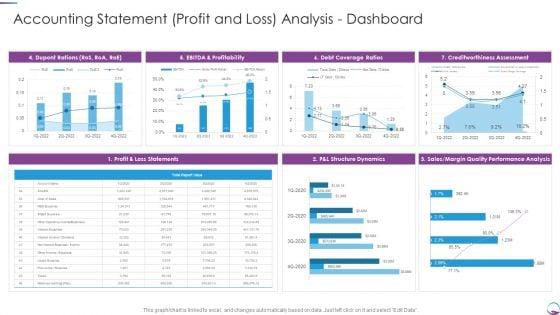
This graph or chart is linked to excel, and changes automatically based on data. Just left click on it and select Edit Data. Deliver an awe inspiring pitch with this creative Summary Financial Accounting Statement Profit And Loss Analysis Dashboard Elements PDF bundle. Topics like P And L Structure Dynamics, Dupont Rations, Debt Coverage Ratios, Creditworthiness Assessment can be discussed with this completely editable template. It is available for immediate download depending on the needs and requirements of the user.
Slide 1 of 2
Deliver an awe inspiring pitch with this creative Accounting Statement Profit And Loss Analysis Dashboard Infographics PDF bundle. Topics like Accounting Statement Profit And Loss Analysis Dashboard can be discussed with this completely editable template. It is available for immediate download depending on the needs and requirements of the user.


Slide 1 of 2
The following slide highlights the keywords performance data profiling and analysis dashboard illustrating spend vs cost per click, campaign report, high performing keywords, low performing keywords and advertisement performance Showcasing this set of slides titled keywords performance data mining and analysis dashboard microsoft pdf . The topics addressed in these templates are keywords performance data mining and analysis dashboard . All the content presented in this PPT design is completely editable. Download it and make adjustments in color, background, font etc. as per your unique business setting.

Slide 1 of 2
Deliver an awe inspiring pitch with this creative roadmap for financial accounting transformation accounting statement profit and loss analysis dashboard clipart pdf bundle. Topics like profit and loss statements, p and l structure dynamics, sales or margin quality performance analysis, creditworthiness assessment, debt coverage ratios can be discussed with this completely editable template. It is available for immediate download depending on the needs and requirements of the user.
Slide 1 of 2
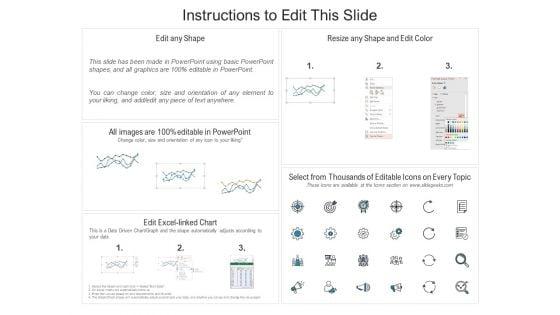
Showcasing this set of slides titled economic facts and insights analysis dashboard ppt powerpoint presentation inspiration slide download pdf. The topics addressed in these templates are current working capital, cash conversion cycle in days last, current quick stats, vendor payment error rate last, 12 months currnet budget variance. All the content presented in this PPT design is completely editable. Download it and make adjustments in color, background, font etc. as per your unique business setting.


Slide 1 of 9
This slide covers reporting and spend analysis waterfall model. It also includes performance comparison based on time, such as last year, last quarte etc. Deliver an awe inspiring pitch with this creative Report And Analysis Through Kpis And Waterfall Model Graphics PDF bundle. Topics like Currency Transactions, Spend Overview, Procurement Materials can be discussed with this completely editable template. It is available for immediate download depending on the needs and requirements of the user.


Slide 1 of 10
The purpose of this slide is to highlight real-time metrics for effective evaluation and optimization of diversity, equity, and inclusion initiatives. Get a simple yet stunning designed Inclusive Workplace Training Program Dei Tracking And Reporting Analysis Dashboard DTE SS V. It is the best one to establish the tone in your meetings. It is an excellent way to make your presentations highly effective. So, download this PPT today from Slidegeeks and see the positive impacts. Our easy-to-edit Inclusive Workplace Training Program Dei Tracking And Reporting Analysis Dashboard DTE SS V can be your go-to option for all upcoming conferences and meetings. So, what are you waiting for Grab this template today. The purpose of this slide is to highlight real-time metrics for effective evaluation and optimization of diversity, equity, and inclusion initiatives.
Slide 1 of 2
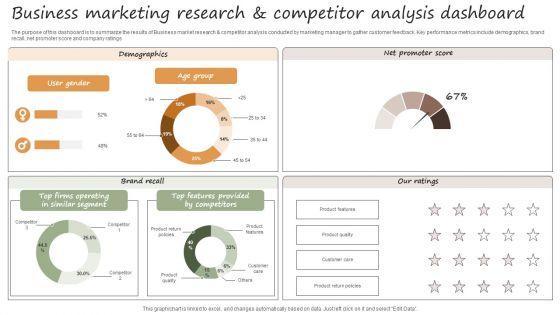
The purpose of this dashboard is to summarize the results of Business market research and competitor analysis conducted by marketing manager to gather customer feedback. Key performance metrics include demographics, brand recall, net promoter score and company ratings. Showcasing this set of slides titled Usiness Marketing Research And Competitor Analysis Dashboard Sample PDF. The topics addressed in these templates are Brand Recall, Demographics, Net Promoter Score. All the content presented in this PPT design is completely editable. Download it and make adjustments in color, background, font etc. as per your unique business setting.
Slide 1 of 2
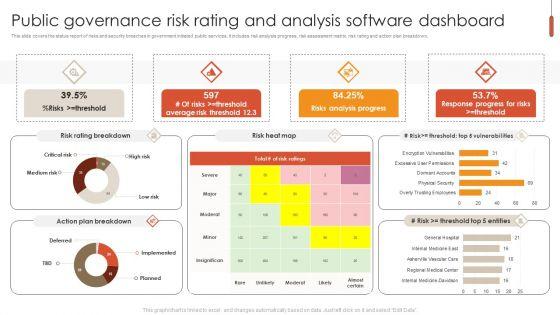
This slide covers the status report of risks and security breaches in government initiated public services. It includes risk analysis progress, risk assessment matrix, risk rating and action plan breakdown. Showcasing this set of slides titled Public Governance Risk Rating And Analysis Software Dashboard Brochure PDF. The topics addressed in these templates are Risk Rating Breakdown, Risks Analysis Progress, Analysis Software Dashboard. All the content presented in this PPT design is completely editable. Download it and make adjustments in color, background, font etc. as per your unique business setting.
Slide 1 of 2
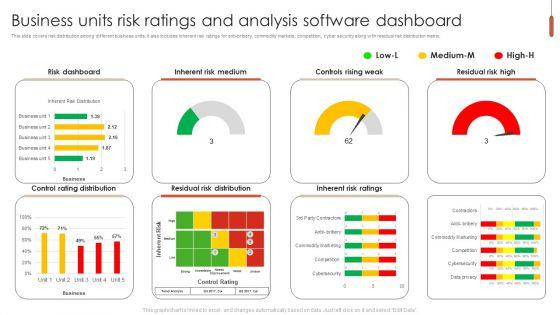
This slide covers risk distribution among different business units. It also includes inherent risk ratings for anti-bribery, commodity markets, competition, cyber security along with residual risk distribution matrix. Pitch your topic with ease and precision using this Business Units Risk Ratings And Analysis Software Dashboard Ideas PDF. This layout presents information on Risk Dashboard, Inherent Risk Medium, Controls Rising Weak. It is also available for immediate download and adjustment. So, changes can be made in the color, design, graphics or any other component to create a unique layout.


Slide 1 of 9
This slide presents various metrics for test and monitor effectiveness of customer segmentation and change marketing strategy with changed customer requirements. It highlights KPIs such as cohort segmentation, user churn segmentation, customer lifetime value segmentation, etc. The best PPT templates are a great way to save time, energy, and resources. Slidegeeks have 100 percent editable powerpoint slides making them incredibly versatile. With these quality presentation templates, you can create a captivating and memorable presentation by combining visually appealing slides and effectively communicating your message. Download Customer Segmentation And Behavioral Analysis Kpis To Test And Iterate Customer Icons PDF from Slidegeeks and deliver a wonderful presentation.


Slide 1 of 2
This slide defines the dashboard for analyzing the cyber risk impact and likelihood. It includes information related to the risk, rating and vulnerabilities. Showcasing this set of slides titled Cyber Risk Impact And Probability Analysis Dashboard Brochure PDF. The topics addressed in these templates are Risk Heat Map, Risk Rating Breakdown, Vulnerabilities. All the content presented in this PPT design is completely editable. Download it and make adjustments in color, background, font etc. as per your unique business setting.
33 Item(s)
