AI PPT Maker
Templates
PPT Bundles
Design Services
Business PPTs
Business Plan
Management
Strategy
Introduction PPT
Roadmap
Self Introduction
Timelines
Process
Marketing
Agenda
Technology
Medical
Startup Business Plan
Cyber Security
Dashboards
SWOT
Proposals
Education
Pitch Deck
Digital Marketing
KPIs
Project Management
Product Management
Artificial Intelligence
Target Market
Communication
Supply Chain
Google Slides
Research Services
 One Pagers
All Categories
Kpis-performance PowerPoint Presentation Templates and Google Slides
53 Item(s)

Slide 1 of 7
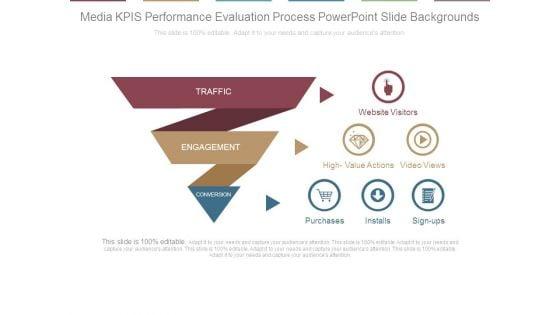
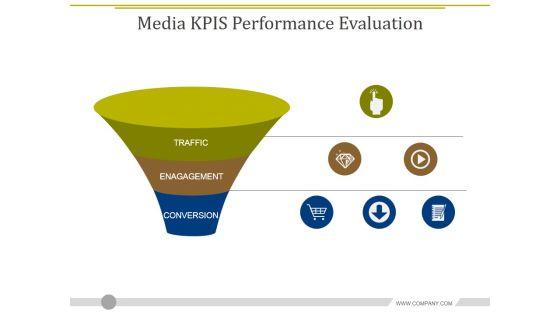
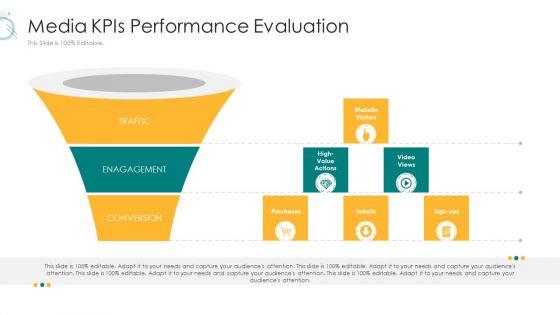
This is a media kpis performance evaluation process powerpoint slide backgrounds. This is a three stage process. The stages in this process are traffic, engagement, conversion, purchases, installs, sign ups, video views, high value actions, website visitors.


Slide 1 of 5
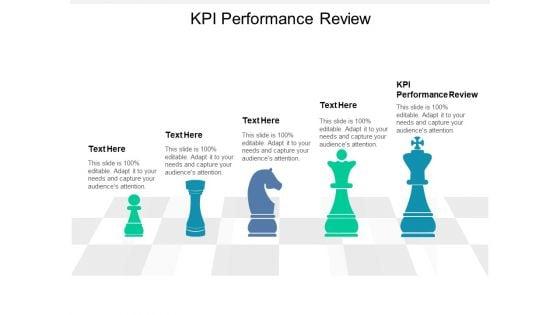
This is a kpi performance review ppt powerpoint presentation show influencers. This is a five stage process. The stages in this process are kpi performance review.



Slide 1 of 5
This is a kpi performance indicators examples ppt powerpoint presentation outline slides cpb. This is a four stage process. The stages in this process are kpi performance indicators examples.


Slide 1 of 5
This is a sales kpi performance summary ppt powerpoint presentation show themes. This is a three stage process. The stages in this process are revenue comparison, quantity comparison, product sales mix, markets, sales channel.


Slide 1 of 5
This is a sales kpi performance summary ppt powerpoint presentation show inspiration. This is a two stage process. The stages in this process are revenue comparison, quantity comparison, product sales mix, regional sales mix, budget.


Slide 1 of 5
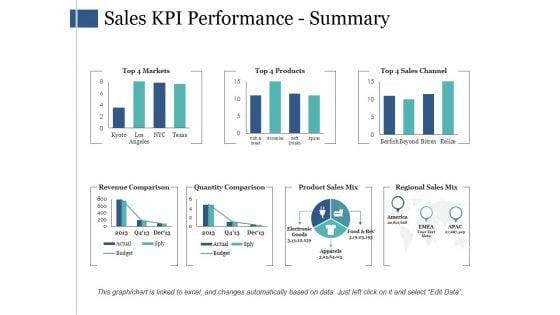
This is a sales kpi performance summary ppt powerpoint presentation ideas graphics template. This is a seven stage process. The stages in this process are revenue comparison, quantity comparison, product sales mix, regional sales mix.
Slide 1 of 5
This is a sales kpi performance summary ppt powerpoint presentation infographic template infographics. This is a seven stage process. The stages in this process are revenue comparison, quantity comparison, product sales mix, regional sales mix.


Slide 1 of 5
This is a sales kpi performance summary ppt powerpoint presentation infographics model. This is a seven stage process. The stages in this process are sales channel, revenue comparison, quantity comparison, business, marketing.


Slide 1 of 5
This is a sales kpi performance summary ppt powerpoint presentation infographic template elements. This is a seven stage process. The stages in this process are revenue comparison, quantity comparison, product sales mix, regional sales mix, budget.


Slide 1 of 5
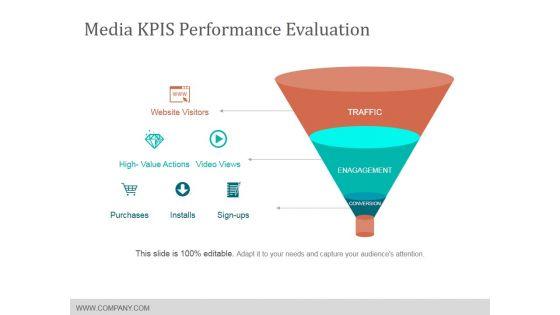
This is a media kpis performance evaluation ppt powerpoint presentation professional demonstration. This is a three stage process. The stages in this process are website visitors, high value actions, purchases, installs, sign ups, conversion.


Slide 1 of 5
This is a media kpis performance evaluation ppt powerpoint presentation file templates. This is a three stage process. The stages in this process are website visitors, purchases, installs, sign ups.


Slide 1 of 5
This is a media kpis performance evaluation ppt powerpoint presentation pictures show. This is a three stage process. The stages in this process are traffic, engagement, conversion.



Slide 1 of 5
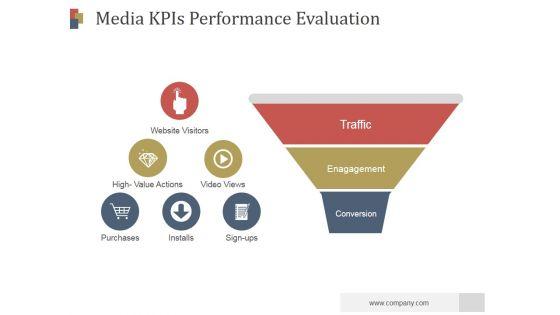
This is a media kpi performance evaluation ppt powerpoint presentation visual aids. This is a three stage process. The stages in this process are traffic, enagagement, conversion, website visitors, purchases, installs, sign ups.


Slide 1 of 5
This is a media kpis performance evaluation ppt powerpoint presentation topics. This is a three stage process. The stages in this process are traffic, engagement, conversion, website, visitors, high value actions, video views, purchases, installs, sign ups.


Slide 1 of 5
This is a media kpis performance evaluation ppt powerpoint presentation information. This is a three stage process. The stages in this process are traffic, engagement, conversion.


Slide 1 of 5
This is a media kpis performance evaluation ppt powerpoint presentation background images. This is a three stage process. The stages in this process are leads, funnel, business, filter.


Slide 1 of 5
This is a media kpis performance evaluation ppt powerpoint presentation tips. This is a three stage process. The stages in this process are traffic, engagement, conversion, purchases, installs, sign ups, high value actions, video views, website visitors.


Slide 1 of 5
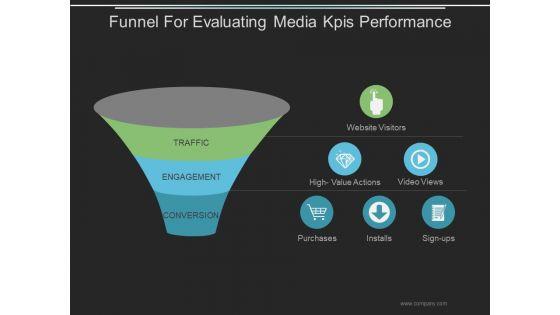
This is a funnel for evaluating media kpis performance ppt powerpoint presentation design templates. This is a three stage process. The stages in this process are business, marketing, funnel, purchase, management.

Slide 1 of 5
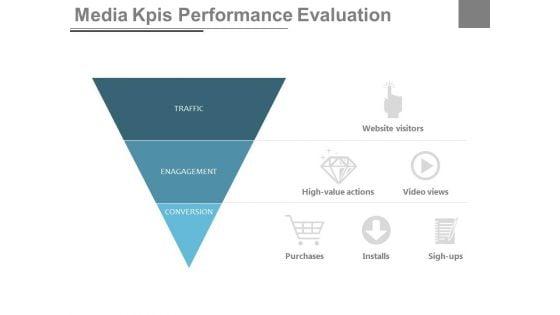
This is a media KPIs performance evaluation ppt slides. This is a one stage process. The stages in this process are media, business, success marketing.


Slide 1 of 2
This slide shows the monthly key performance indicators report on various categories with a line chart . the categories includes financial, customer success , new business activities, HR and other metrics. Pitch your topic with ease and precision using this Monthly KPI Work Performance Monitoring By Category Microsoft PDF. This layout presents information on Metrics, Financial, Customer Success. It is also available for immediate download and adjustment. So, changes can be made in the color, design, graphics or any other component to create a unique layout.

Slide 1 of 2
This slide showcases dashboard that can help organization to analyze the effectiveness of communication KPIs campaign by studying channel views and number of likes. Its key components are youtube channel views, linkedin shares, linked in clicks and facebook daily reach. Pitch your topic with ease and precision using this Communication Kpis Performance Dashboard Of Social Media Channels Mockup PDF. This layout presents information on Linkedin Shares, Facebook Page likes, Facebook Daily Reach. It is also available for immediate download and adjustment. So, changes can be made in the color, design, graphics or any other component to create a unique layout.


Slide 1 of 2
This slide showcases dashboard that can help organization to analyze the performance of call center agents communication KPIs and take necessary actions in case of high abandonment rate. Its key components are average response time, first call resolution and top performing call agents. Showcasing this set of slides titled Call Center Communication Kpis Performance Dashboard With First Call Resolution Rate Graphics PDF. The topics addressed in these templates are Overall Average, Response Time, First Call Resolution, Daily Abandonment Rate. All the content presented in this PPT design is completely editable. Download it and make adjustments in color, background, font etc. as per your unique business setting.


Slide 1 of 2
This slide illustrates graphical representation of sprint performance in scrum framework. It includes KPIs like team velocity, past trends of velocity and variance in sprints etc. Showcasing this set of slides titled Scrum Kpis Sprint Performance Dashboard Ppt Portfolio Example Introduction PDF. The topics addressed in these templates are Team Velocity, Past Trends Velocity, Variance Sprint. All the content presented in this PPT design is completely editable. Download it and make adjustments in color, background, font etc. as per your unique business setting.

Slide 1 of 2
This slide highlights the customized online marketing dashboard showing click through open rates. It includes email marketing, cost per impression, social media. Showcasing this set of slides titled Customized Online Marketing Dashboard Showing Kpis Performance Ppt Portfolio Guidelines PDF. The topics addressed in these templates are Email Marketing, Cost Per Impression, ROI Calculator. All the content presented in this PPT design is completely editable. Download it and make adjustments in color, background, font etc. as per your unique business setting.


Slide 1 of 2
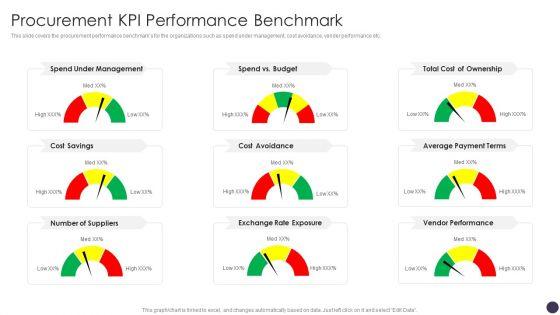
This slide covers the procurement performance benchmarks for the organizations such as spend under management, cost avoidance, vender performance etc. Deliver and pitch your topic in the best possible manner with this Procurement KPI Performance Benchmark Graphics PDF. Use them to share invaluable insights on Cost Savings, Vendor Performance, Total Cost and impress your audience. This template can be altered and modified as per your expectations. So, grab it now.
Slide 1 of 2
This slide covers the procurement performance benchmarks for the organizations such as spend under management, cost avoidance, vender performance etc. Deliver and pitch your topic in the best possible manner with this Procurement KPI Performance Benchmark Professional PDF. Use them to share invaluable insights on Under Management, Cost Of Ownership, Average Payment and impress your audience. This template can be altered and modified as per your expectations. So, grab it now.

Slide 1 of 2
Ensure that gamification activity helps improve your business performance.Deliver an awe inspiring pitch with this creative Gamification Strategy For Business Promotion Gamification Activity Vs KPI Performance Themes PDF bundle. Topics like Activity, Gamification, Started can be discussed with this completely editable template. It is available for immediate download depending on the needs and requirements of the user.


Slide 1 of 2
Deliver and pitch your topic in the best possible manner with this Purchase Assessment Process Procurement KPI Performance Benchmark Formats PDF Use them to share invaluable insights on Total Cost, Average Payment, Exchange Exposure and impress your audience. This template can be altered and modified as per your expectations. So, grab it now.
Slide 1 of 2
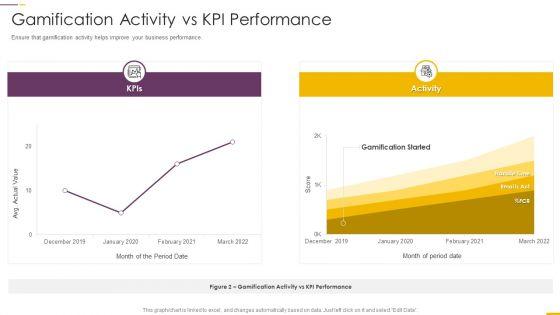
Ensure that gamification activity helps improve your business performance. Deliver an awe inspiring pitch with this creative how build gamification advertising plan gamification activity vs kpi performance ppt professional slideshow pdf bundle. Topics like gamification activity vs kpi performance can be discussed with this completely editable template. It is available for immediate download depending on the needs and requirements of the user.
Slide 1 of 2
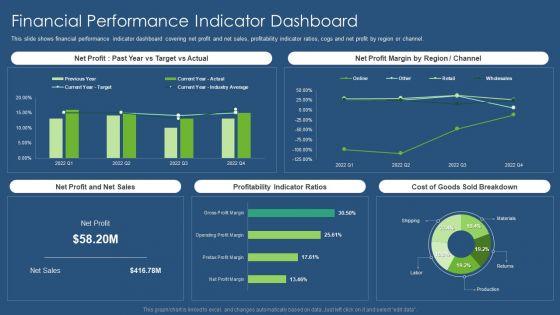
This slide shows financial performance indicator dashboard covering net profit and net sales, profitability indicator ratios, cogs and net profit by region or channel. Deliver an awe inspiring pitch with this creative sustainability calculation with kpi financial performance indicator dashboard infographics pdf bundle. Topics like net profit margin, net profit and net sales, profitability indicator ratios, sold breakdown can be discussed with this completely editable template. It is available for immediate download depending on the needs and requirements of the user.
Slide 1 of 2
Presenting digital marketing strategy and technological adaptation media kpis performance evaluation microsoft pdf to provide visual cues and insights. Share and navigate important information on three stages that need your due attention. This template can be used to pitch topics like conversion, enagagement, traffic In addtion, this PPT design contains high resolution images, graphics, etc, that are easily editable and available for immediate download.

Slide 1 of 2
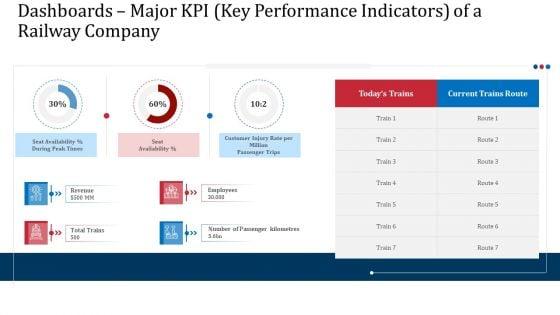
Deliver an awe inspiring pitch with this creative dashboards major kpi key performance indicators of a railway company professional pdf bundle. Topics like dashboards positive train control ptc implementation by freight and passenger trains can be discussed with this completely editable template. It is available for immediate download depending on the needs and requirements of the user.

Slide 1 of 2
Deliver and pitch your topic in the best possible manner with this dashboards major kpi key performance indicators of a railway company slides pdf. Use them to share invaluable insights on revenue, employees, key performance indicators and impress your audience. This template can be altered and modified as per your expectations. So, grab it now.
Slide 1 of 2
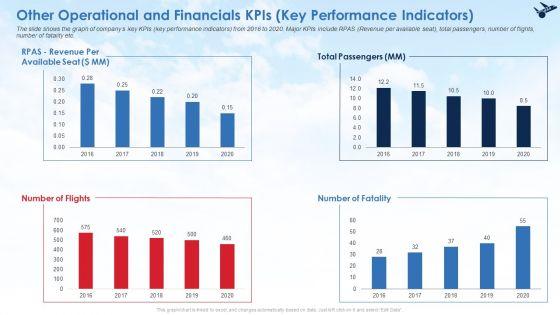
The slide shows the graph of companys key KPIs key performance indicators from 2016 to 2020. Major KPIs include RPAS Revenue per available seat, total passengers, number of flights, number of fatality etc. Deliver an awe inspiring pitch with this creative other operational and financials kpis key performance indicators ideas pdf bundle. Topics like other operational and financials kpis key performance indicators can be discussed with this completely editable template. It is available for immediate download depending on the needs and requirements of the user.


Slide 1 of 2
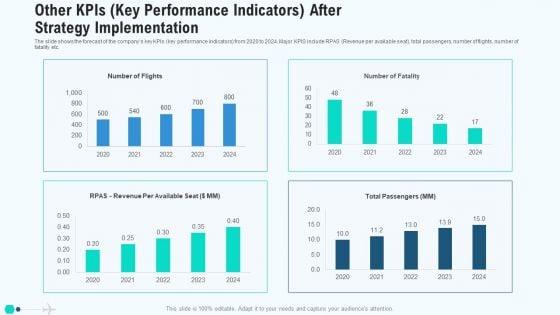
The slide shows the forecast of the companys key KPIs key performance indicators from 2020 to 2024. Major KPIS include RPAS Revenue per available seat, total passengers, number of flights, number of fatality etc. Deliver and pitch your topic in the best possible manner with this other kpis key performance indicators after strategy implementation infographics pdf. Use them to share invaluable insights on other kpis key performance indicators after strategy implementation and impress your audience. This template can be altered and modified as per your expectations. So, grab it now.
Slide 1 of 2
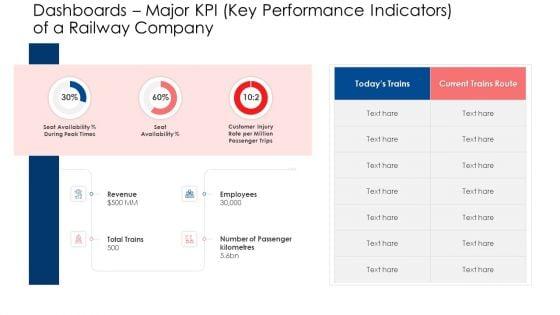
Deliver an awe inspiring pitch with this creative dashboards major kpi key performance indicators of a railway company formats pdf bundle. Topics like revenue, employees, dashboards can be discussed with this completely editable template. It is available for immediate download depending on the needs and requirements of the user.

Slide 1 of 2
The slide shows the graph of companys key KPIs key performance indicators from 2016 to 2020. Major KPIs include RPAS Revenue per available seat, total passengers, number of flights, number of fatality etc. Deliver an awe-inspiring pitch with this creative other operational and financials kpis key performance indicators professional pdf bundle. Topics like other operational and financials kpis key performance indicators can be discussed with this completely editable template. It is available for immediate download depending on the needs and requirements of the user.

Slide 1 of 2
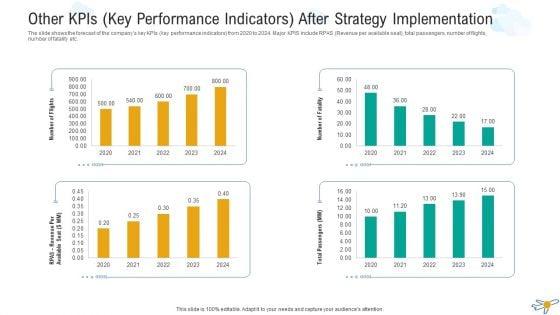
The slide shows the forecast of the companys key KPIs key performance indicators from 2020 to 2024. Major KPIS include RPAS Revenue per available seat, total passengers, number of flights, number of fatality etc. Deliver and pitch your topic in the best possible manner with this other kpis key performance indicators after strategy implementation microsoft pdf. Use them to share invaluable insights on other kpis key performance indicators after strategy implementation and impress your audience. This template can be altered and modified as per your expectations. So, grab it now.

Slide 1 of 2
Deliver an awe-inspiring pitch with this creative dashboards major KPI key performance indicators of a railway company information pdf. bundle. Topics like seat availability percent during, peak times, seat availability percent can be discussed with this completely editable template. It is available for immediate download depending on the needs and requirements of the user.


Slide 1 of 2
The slide shows the graph of companys key KPIs key performance indicators from 2016 to 2020. Major KPIs include RPAS Revenue per available seat, total passengers, number of flights, number of fatality etc.Deliver an awe-inspiring pitch with this creative other operational and financials KPIs key performance indicators structure pdf. bundle. Topics like total passengers, number of flights,2016 to 2020 can be discussed with this completely editable template. It is available for immediate download depending on the needs and requirements of the user.

Slide 1 of 2
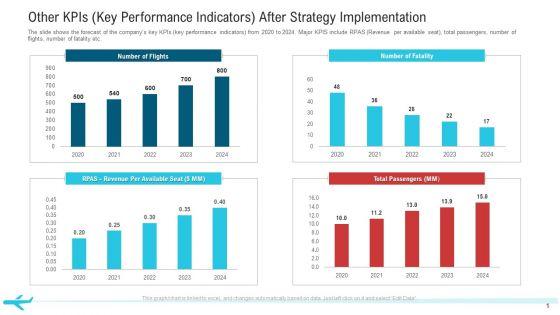
The slide shows the forecast of the companys key KPIs key performance indicators from 2020 to 2024. Major KPIS include RPAS Revenue per available seat, total passengers, number of flights, number of fatality etc.Deliver and pitch your topic in the best possible manner with this other KPIs key performance indicators after strategy implementation professional pdf. Use them to share invaluable insights on total passengers, number of flights, 2020 to 2024 and impress your audience. This template can be altered and modified as per your expectations. So, grab it now.


Slide 1 of 2
The slide shows the graph of companys key KPIs key performance indicators from 2017 to 2021. Major KPIs include RPAS Revenue per available seat, total passengers, number of flights, number of fatality etc. Deliver an awe inspiring pitch with this creative other operational and financials kpis key performance indicators clipart pdf bundle. Topics like other operational and financials kpis key performance indicators can be discussed with this completely editable template. It is available for immediate download depending on the needs and requirements of the user.

Slide 1 of 2
The slide shows the forecast of the companys key KPIs key performance indicators from 2020 to 2024. Major KPIS include RPAS Revenue per available seat, total passengers, number of flights, number of fatality etc. Deliver and pitch your topic in the best possible manner with this other kpis key performance indicators after strategy implementation mockup pdf. Use them to share invaluable insights on other kpis key performance indicators after strategy implementation and impress your audience. This template can be altered and modified as per your expectations. So, grab it now.
Slide 1 of 2
Persuade your audience using this kpis for performing marketing audit with lead nurturing ppt powerpoint presentation icon inspiration pdf. This PPT design covers five stages, thus making it a great tool to use. It also caters to a variety of topics including brand reputation, marketing potential, lead nurturing. Download this PPT design now to present a convincing pitch that not only emphasizes the topic but also showcases your presentation skills.

Slide 1 of 2
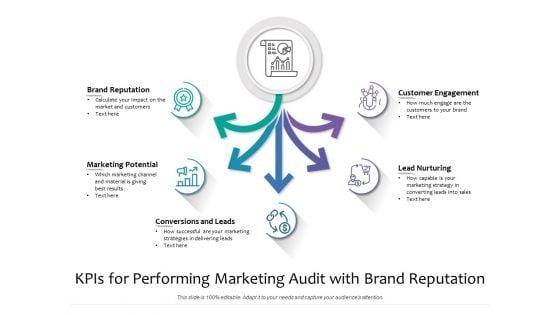
Presenting kpis for performing marketing audit with brand reputation ppt powerpoint presentation gallery graphics pdf to dispense important information. This template comprises five stages. It also presents valuable insights into the topics including brand reputation, marketing potential, conversions and leads. This is a completely customizable PowerPoint theme that can be put to use immediately. So, download it and address the topic impactfully.
Slide 1 of 2
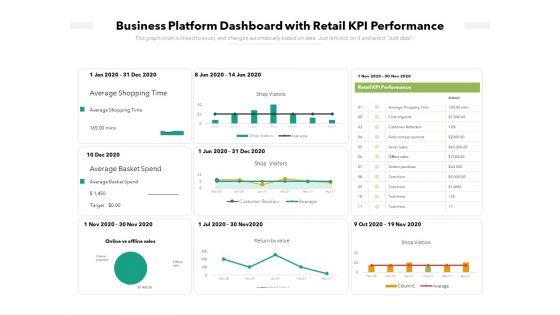
Pitch your topic with ease and precision using this business platform dashboard with retail kpi performance ppt powerpoint presentation slides diagrams pdf. This layout presents information on retail kpi performance, business platform dashboard with retail kpi performance, online vs offline sales, shop visitors. It is also available for immediate download and adjustment. So, changes can be made in the color, design, graphics or any other component to create a unique layout.
Slide 1 of 2
Deliver an awe inspiring pitch with this creative tracking energy consumption kpi metrics performance ppt rules pdf bundle. Topics like petroleum, coal, nuclear, performance, solar can be discussed with this completely editable template. It is available for immediate download depending on the needs and requirements of the user.
Slide 1 of 2
Deliver an awe-inspiring pitch with this creative energy tracking device kpi dashboard performance ppt powerpoint presentation file good pdf bundle. Topics like project delivery, production distribution, energy savings, availability factor, performance ratio can be discussed with this completely editable template. It is available for immediate download depending on the needs and requirements of the user.


Slide 1 of 9
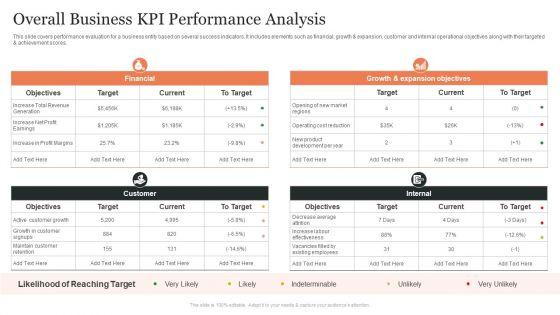
This slide covers performance evaluation for a business entity based on several success indicators. It includes elements such as financial, growth and expansion, customer and internal operational objectives along with their targeted and achievement scores. Pitch your topic with ease and precision using this Overall Business KPI Performance Analysis Ppt Show Professional PDF. This layout presents information on Internal, Customer, Financial. It is also available for immediate download and adjustment. So, changes can be made in the color, design, graphics or any other component to create a unique layout.


Slide 1 of 9
Presenting Dashboard Icon For Marketing Communication Kpis Performance Assessment Summary PDF to dispense important information. This template comprises four stages. It also presents valuable insights into the topics including Dashboard Icon, Marketing Communication, Kpis Performance, Assessment. This is a completely customizable PowerPoint theme that can be put to use immediately. So, download it and address the topic impactfully.


Slide 1 of 9
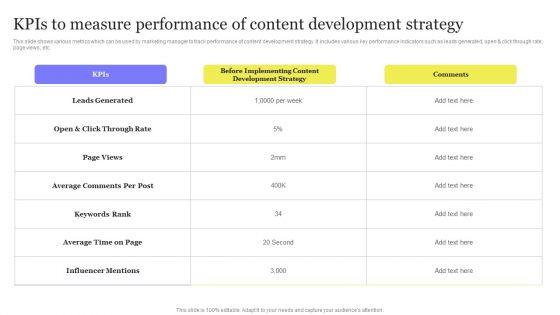
This slide shows various metrics which can be used by marketing manager to track performance of content development strategy. It includes various key performance indicators such as leads generated, open and click through rate, page views, etc. Welcome to our selection of the Enhancing Digital Visibility Using SEO Content Strategy Kpis Measure Performance Content Development Background PDF. These are designed to help you showcase your creativity and bring your sphere to life. Planning and Innovation are essential for any business that is just starting out. This collection contains the designs that you need for your everyday presentations. All of our PowerPoints are 100 percent editable, so you can customize them to suit your needs. This multi purpose template can be used in various situations. Grab these presentation templates today.


Slide 1 of 9
The following slide outlines key performance indicators of manufacturing operations. The purpose is for greater accountability, better performance etc. The key components are- leading indicators, lagging indicators, input indicators, process indicators etc. Pitch your topic with ease and precision using this Production Operations KPIs For Performance Evaluation Structure Pdf. This layout presents information on Leading Indicators, Lagging Indicators, Input Indicators. It is also available for immediate download and adjustment. So, changes can be made in the color, design, graphics or any other component to create a unique layout. The following slide outlines key performance indicators of manufacturing operations. The purpose is for greater accountability, better performance etc. The key components are- leading indicators, lagging indicators, input indicators, process indicators etc.
Slide 1 of 2
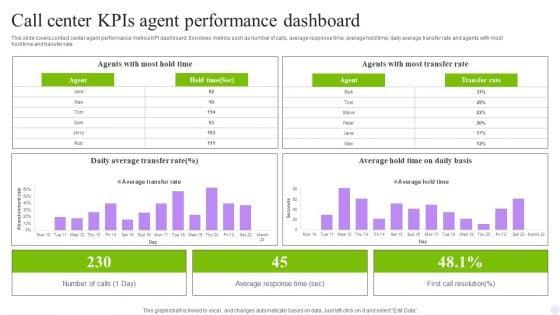
This slide covers contact center agent performance metrics KPI dashboard. It involves metrics such as number of calls, average response time, average hold time, daily average transfer rate and agents with most hold time and transfer rate. Showcasing this set of slides titled Call Center Kpis Agent Performance Dashboard Clipart PDF. The topics addressed in these templates are Transfer Rate, Call Center, Hold Time. All the content presented in this PPT design is completely editable. Download it and make adjustments in color, background, font etc. as per your unique business setting.
53 Item(s)
