- Sign up
- Sign In
 AI PPT Maker
 Templates
 PPT Bundles
 Design Services
 Business PPTs
 Business Plan
 Management
 Strategy
 Introduction PPT
 Roadmap
 Self Introduction
 Timelines
 Process
 Marketing
 Agenda
 Technology
 Medical
 Startup Business Plan
 Cyber Security
 Dashboards
 SWOT
SWOT Proposals
 Education
 Pitch Deck
 Digital Marketing
 KPIs
KPIs Project Management
 Product Management
 Artificial Intelligence
 Target Market
 Communication
 Supply Chain
 Google Slides
 Research Services
 One Pagers
 All Categories
Average time PowerPoint Presentation Templates and Google Slides
SHOW
- 60
- 120
- 180
DISPLAYING: 60 of 81 Item(s)
Page

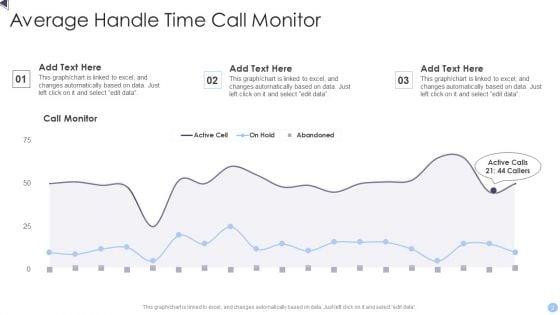
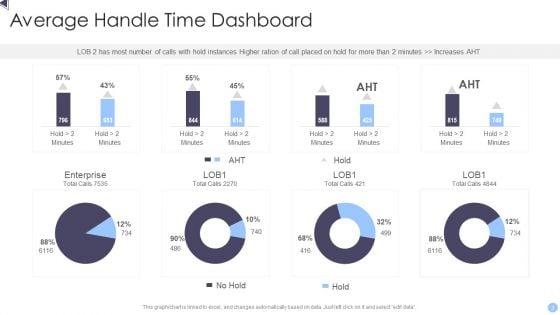
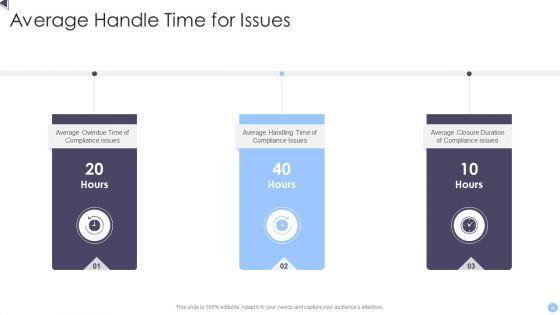


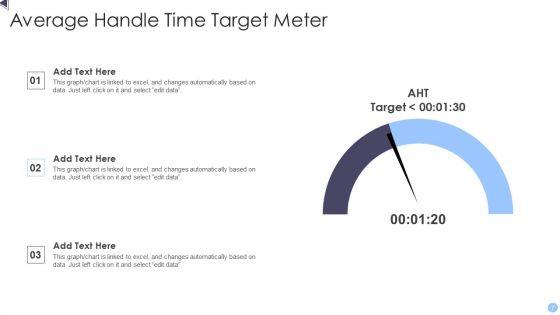
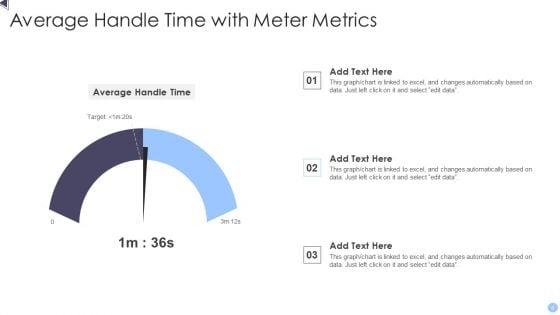
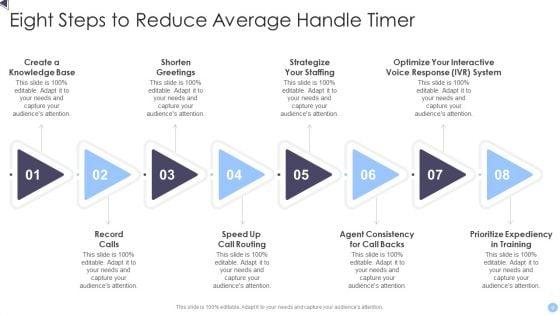
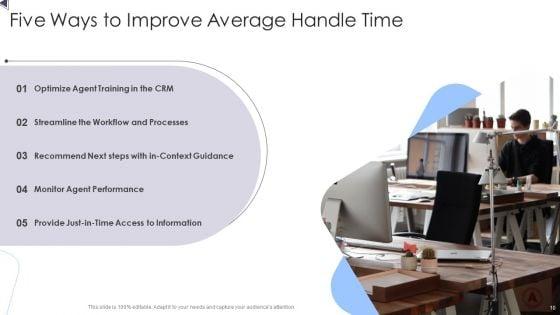
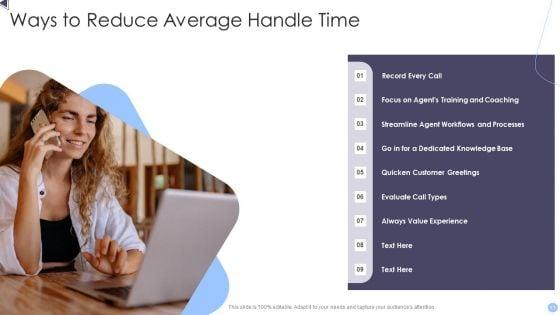

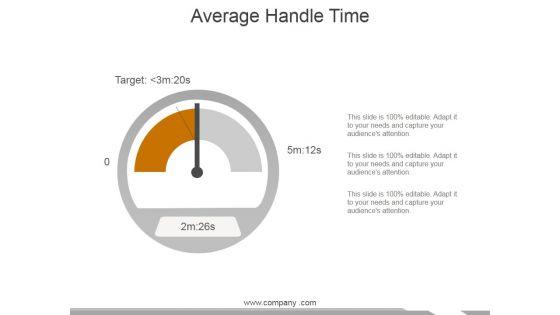
Improve your presentation delivery using this Average Handle Time Ppt PowerPoint Presentation Complete With Slides. Support your business vision and objectives using this well-structured PPT deck. This template offers a great starting point for delivering beautifully designed presentations on the topic of your choice. Comprising tweleve this professionally designed template is all you need to host discussion and meetings with collaborators. Each slide is self-explanatory and equipped with high-quality graphics that can be adjusted to your needs. Therefore, you will face no difficulty in portraying your desired content using this PPT slideshow. This PowerPoint slideshow contains every important element that you need for a great pitch. It is not only editable but also available for immediate download and utilization. The color, font size, background, shapes everything can be modified to create your unique presentation layout. Therefore, download it now.


Presenting this set of slides with name risk and return analysis over a time period average ppt powerpoint presentation summary structure. The topics discussed in these slides are business, planning, strategy, marketing, management. This is a completely editable PowerPoint presentation and is available for immediate download. Download now and impress your audience.


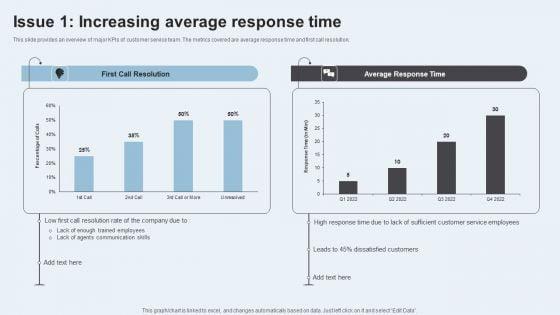

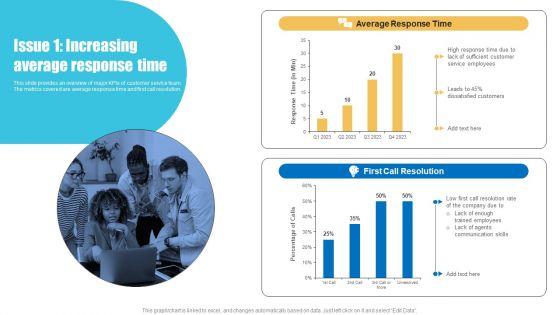
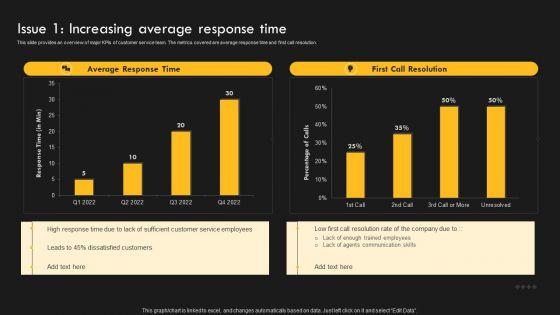
This slide provides an overview of major KPIs of customer service team. The metrics covered are average response time and first call resolution. Take your projects to the next level with our ultimate collection of Action Plan To Enhance Client Service Issue 1 Increasing Average Response Time Ideas PDF. Slidegeeks has designed a range of layouts that are perfect for representing task or activity duration, keeping track of all your deadlines at a glance. Tailor these designs to your exact needs and give them a truly corporate look with your own brand colors they will make your projects stand out from the rest.


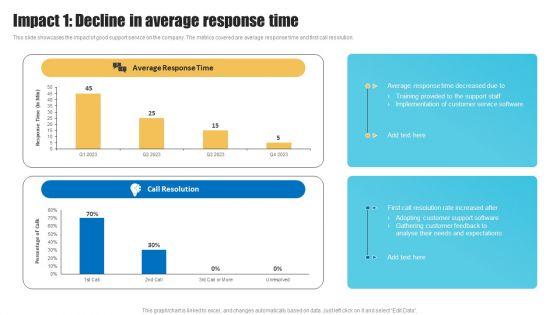
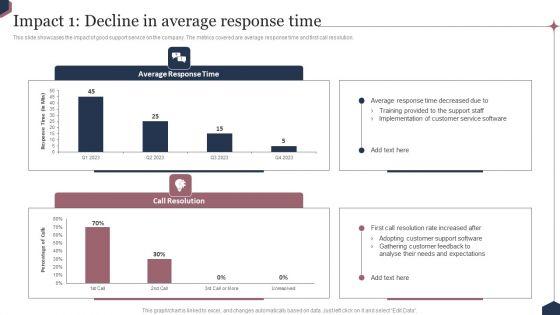
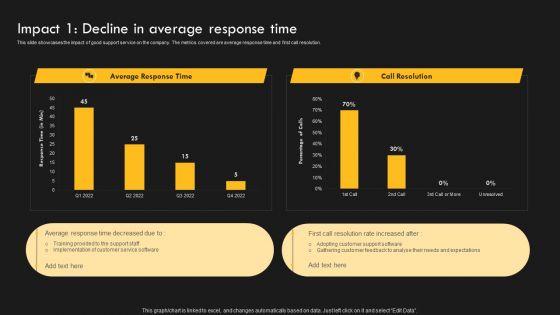
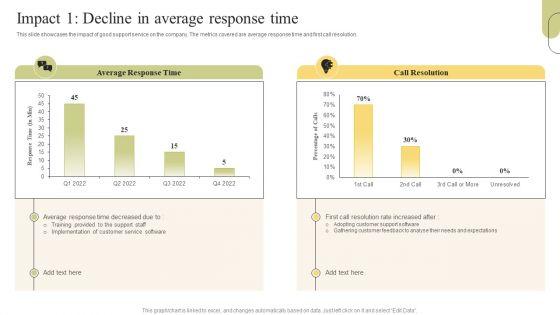
This slide showcases the impact of good support service on the company. The metrics covered are average response time and first call resolution. Presenting this PowerPoint presentation, titled Action Plan To Enhance Client Service Impact 1 Decline In Average Response Time Rules PDF, with topics curated by our researchers after extensive research. This editable presentation is available for immediate download and provides attractive features when used. Download now and captivate your audience. Presenting this Action Plan To Enhance Client Service Impact 1 Decline In Average Response Time Rules PDF. Our researchers have carefully researched and created these slides with all aspects taken into consideration. This is a completely customizable Action Plan To Enhance Client Service Impact 1 Decline In Average Response Time Rules PDF that is available for immediate downloading. Download now and make an impact on your audience. Highlight the attractive features available with our PPTs.

This slide provides an overview of major KPIs of customer service team. The metrics covered are average response time and first call resolution. From laying roadmaps to briefing everything in detail, our templates are perfect for you. You can set the stage with your presentation slides. All you have to do is download these easy to edit and customizable templates. Strategies To Improve Customer Support Services Issue 1 Increasing Average Response Time Elements PDF will help you deliver an outstanding performance that everyone would remember and praise you for. Do download this presentation today.

This slide showcases the impact of good support service on the company. The metrics covered are average response time and first call resolution. Do you have to make sure that everyone on your team knows about any specific topic I yes, then you should give Strategies To Improve Customer Support Services Impact 1 Decline In Average Response Time Information PDF a try. Our experts have put a lot of knowledge and effort into creating this impeccable Strategies To Improve Customer Support Services Impact 1 Decline In Average Response Time Information PDF. You can use this template for your upcoming presentations, as the slides are perfect to represent even the tiniest detail. You can download these templates from the Slidegeeks website and these are easy to edit. So grab these today.

Following slide showcases customer service metrics dashboard of the SaaS company. Average handling time, customer satisfaction, customer service associate, average speed of answer are the core metrics which are mentioned in the dashboard. Showcasing this set of slides titled Saas Company Customer Support Kpl Dashboard With Average Handle Time Microsoft PDF. The topics addressed in these templates are Saas Company Customer Support, Kpl Dashboard, Average Handle Time. All the content presented in this PPT design is completely editable. Download it and make adjustments in color, background, font etc. as per your unique business setting.
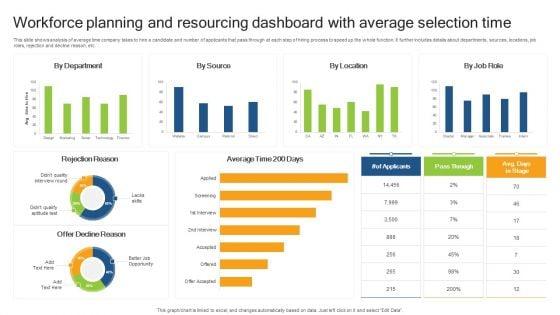

This slide shows analysis of average time company takes to hire a candidate and number of applicants that pass through at each step of hiring process to speed up the whole function. It further includes details about departments, sources, locations, job roles, rejection and decline reason, etc. Showcasing this set of slides titled Workforce Planning And Resourcing Dashboard With Average Selection Time Demonstration PDF. The topics addressed in these templates are Rejection Reason, Offer Decline Reason, Average Time. All the content presented in this PPT design is completely editable. Download it and make adjustments in color, background, font etc. as per your unique business setting.
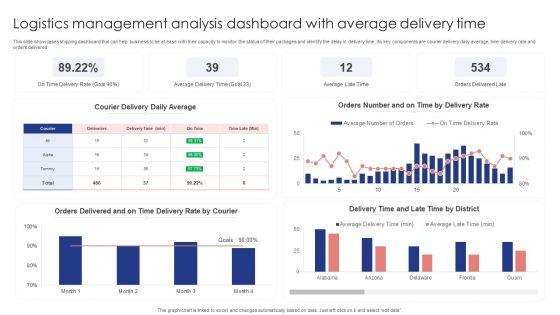
This slide showcases shipping dashboard that can help business to be at ease with their capacity to monitor the status of their packages and identify the delay in delivery time. Its key components are courier delivery daily average, time delivery rate and orders delivered. Showcasing this set of slides titled Logistics Management Analysis Dashboard With Average Delivery Time Themes PDF. The topics addressed in these templates are Courier Delivery Daily Average, Delivery Rate, Orders Delivered. All the content presented in this PPT design is completely editable. Download it and make adjustments in color, background, font etc. as per your unique business setting.
This slide showcases dashboard for sales performance that can help organization to analyze the effectiveness of sales campaigns and average response time of lead. Its key components are average contract value, average sales cycle length, follow up contract rate and sales activity. Showcasing this set of slides titled Sales Performance Dashboard With Average Lead Tracking Time Background PDF. The topics addressed in these templates are Avg Contract Value, Sales Activity, Contract Rate. All the content presented in this PPT design is completely editable. Download it and make adjustments in color, background, font etc. as per your unique business setting.


This slide provides an overview of major KPIs of customer service team. The metrics covered are average response time and first call resolution. Explore a selection of the finest Techniques To Optimize UX Issue 1 Increasing Average Response Time Themes PDF here. With a plethora of professionally designed and pre-made slide templates, you can quickly and easily find the right one for your upcoming presentation. You can use our Techniques To Optimize UX Issue 1 Increasing Average Response Time Themes PDF to effectively convey your message to a wider audience. Slidegeeks has done a lot of research before preparing these presentation templates. The content can be personalized and the slides are highly editable. Grab templates today from Slidegeeks.
This slide showcases the impact of good support service on the company. The metrics covered are average response time and first call resolution. This modern and well-arranged Techniques To Optimize UX Impact 1 Decline In Average Response Time Icons PDF provides lots of creative possibilities. It is very simple to customize and edit with the Powerpoint Software. Just drag and drop your pictures into the shapes. All facets of this template can be edited with Powerpoint, no extra software is necessary. Add your own material, put your images in the places assigned for them, adjust the colors, and then you can show your slides to the world, with an animated slide included.
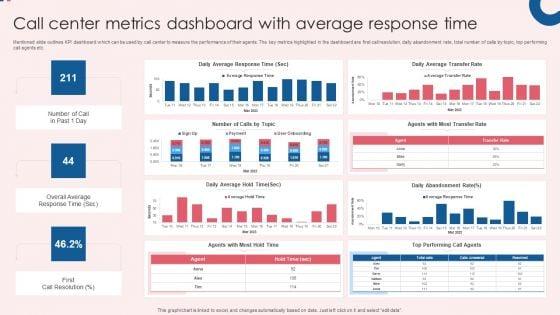

Mentioned slide outlines KPI dashboard which can be used by call center to measure the performance of their agents. The key metrics highlighted in the dashboard are first call resolution, daily abandonment rate, total number of calls by topic, top performing call agents etc. Showcasing this set of slides titled Call Center Metrics Dashboard With Average Response Time Inspiration PDF. The topics addressed in these templates are Efficiency, Quality, Activity, Daily Average Response, Daily Average Transfer. All the content presented in this PPT design is completely editable. Download it and make adjustments in color, background, font etc. as per your unique business setting.


Mentioned slide outlines call center KPI dashboard which gives insights into customer agent performance. The KPI covered in the slide are total voicemail, average talk time, queue time, average quality rate, agent performance, etc. Pitch your topic with ease and precision using this Call Center Metrics Dashboard With Average Queue Time Topics PDF. This layout presents information on Efficiency, Quality, Activity. It is also available for immediate download and adjustment. So, changes can be made in the color, design, graphics or any other component to create a unique layout.
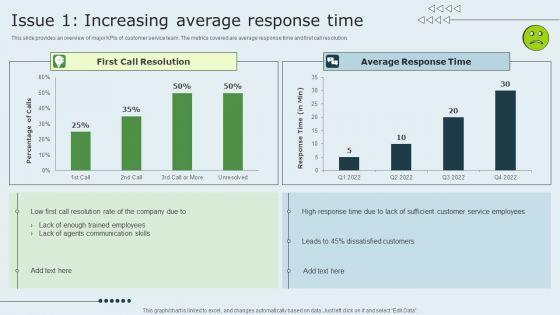

This slide provides an overview of major KPIs of customer service team. The metrics covered are average response time and first call resolution. Slidegeeks is here to make your presentations a breeze with Enhancing Client Experience Issue 1 Increasing Average Response Time Microsoft PDF With our easy-to-use and customizable templates, you can focus on delivering your ideas rather than worrying about formatting. With a variety of designs to choose from, youre sure to find one that suits your needs. And with animations and unique photos, illustrations, and fonts, you can make your presentation pop. So whether youre giving a sales pitch or presenting to the board, make sure to check out Slidegeeks first.
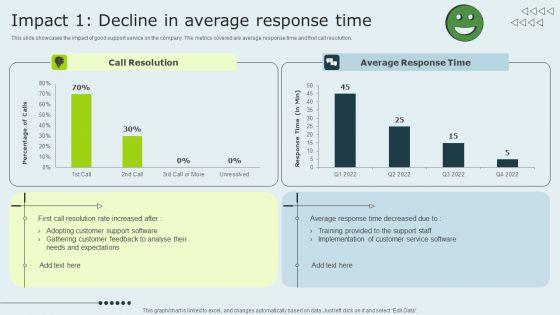

This slide showcases the impact of good support service on the company. The metrics covered are average response time and first call resolution. Get a simple yet stunning designed Enhancing Client Experience Impact 1 Decline In Average Response Time Summary PDF. It is the best one to establish the tone in your meetings. It is an excellent way to make your presentations highly effective. So, download this PPT today from Slidegeeks and see the positive impacts. Our easy-to-edit Enhancing Client Experience Impact 1 Decline In Average Response Time Summary PDF can be your go-to option for all upcoming conferences and meetings. So, what are you waiting for Grab this template today.
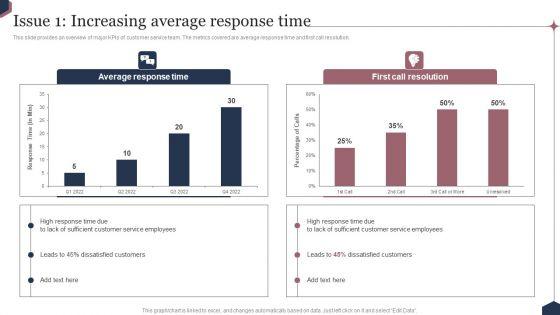
This slide provides an overview of major KPIs of customer service team. The metrics covered are average response time and first call resolution. Slidegeeks is here to make your presentations a breeze with Enhance Customer Engagement Through After Sales Activities Issue 1 Increasing Average Response Time Information PDF With our easy to use and customizable templates, you can focus on delivering your ideas rather than worrying about formatting. With a variety of designs to choose from, you are sure to find one that suits your needs. And with animations and unique photos, illustrations, and fonts, you can make your presentation pop. So whether you are giving a sales pitch or presenting to the board, make sure to check out Slidegeeks first.

This slide showcases the impact of good support service on the company. The metrics covered are average response time and first call resolution. Get a simple yet stunning designed Enhance Customer Engagement Through After Sales Activities Impact 1 Decline In Average Response Time Pictures PDF. It is the best one to establish the tone in your meetings. It is an excellent way to make your presentations highly effective. So, download this PPT today from Slidegeeks and see the positive impacts. Our easy to edit Enhance Customer Engagement Through After Sales Activities Impact 1 Decline In Average Response Time Pictures PDF can be your go-to option for all upcoming conferences and meetings. So, what are you waiting for Grab this template today.

This slide provides an overview of major KPIs of customer service team that impact the organization. The metrics covered are ticket backlog and support cost. The Service Improvement Techniques For Client Retention Issue 1 Increasing Average Response Time Template PDF is a compilation of the most recent design trends as a series of slides. It is suitable for any subject or industry presentation, containing attractive visuals and photo spots for businesses to clearly express their messages. This template contains a variety of slides for the user to input data, such as structures to contrast two elements, bullet points, and slides for written information. Slidegeeks is prepared to create an impression.
This slide showcases the impact of good support service on the company. The metrics covered are ticket backlog and support cost. Welcome to our selection of the Service Improvement Techniques For Client Retention Impact 1 Decline In Average Response Time Mockup PDF. These are designed to help you showcase your creativity and bring your sphere to life. Planning and Innovation are essential for any business that is just starting out. This collection contains the designs that you need for your everyday presentations. All of our PowerPoints are 100 percent editable, so you can customize them to suit your needs. This multi purpose template can be used in various situations. Grab these presentation templates today.


This slide provides an overview of major KPIs of customer service team. The metrics covered are average response time and first call resolution. The best PPT templates are a great way to save time, energy, and resources. Slidegeeks have 100 percent editable powerpoint slides making them incredibly versatile. With these quality presentation templates, you can create a captivating and memorable presentation by combining visually appealing slides and effectively communicating your message. Download Customer Support Services Issue 1 Increasing Average Response Time Formats PDF from Slidegeeks and deliver a wonderful presentation.

This slide showcases the impact of good support service on the company. The metrics covered are average response time and first call resolution. This Customer Support Services Impact 1 Decline In Average Response Time Portrait PDF is perfect for any presentation, be it in front of clients or colleagues. It is a versatile and stylish solution for organizing your meetings. The Customer Support Services Impact 1 Decline In Average Response Time Portrait PDF features a modern design for your presentation meetings. The adjustable and customizable slides provide unlimited possibilities for acing up your presentation. Slidegeeks has done all the homework before launching the product for you. So, dont wait, grab the presentation templates today
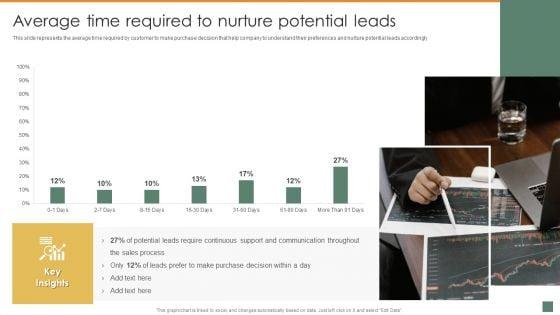
This slide represents the average time required by customer to make purchase decision that help company to understand their preferences and nurture potential leads accordingly. If you are looking for a format to display your unique thoughts, then the professionally designed Average Time Required To Nurture Potential Leads Summary And Significance Of Sales Automation Topics PDF is the one for you. You can use it as a Google Slides template or a PowerPoint template. Incorporate impressive visuals, symbols, images, and other charts. Modify or reorganize the text boxes as you desire. Experiment with shade schemes and font pairings. Alter, share or cooperate with other people on your work. Download Average Time Required To Nurture Potential Leads Summary And Significance Of Sales Automation Topics PDF and find out how to give a successful presentation. Present a perfect display to your team and make your presentation unforgettable.


This slide showcases call center action plan dashboard which highlights first call resolution, unresolved calls, customers call report, response time by weekday and average answer time. Boost your pitch with our creative Call Center Action Plan Dashboard Highlighting Average Answer Time Customer Rules PDF. Deliver an awe-inspiring pitch that will mesmerize everyone. Using these presentation templates you will surely catch everyones attention. You can browse the ppts collection on our website. We have researchers who are experts at creating the right content for the templates. So you dont have to invest time in any additional work. Just grab the template now and use them.
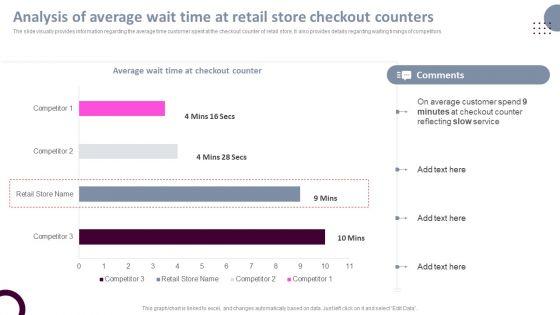

The slide visually provides information regarding the average time customer spent at the checkout counter of retail store. It also provides details regarding waiting timings of competitors. Create an editable Retail Store Operations Analysis Of Average Wait Time At Retail Store Checkout Structure PDF that communicates your idea and engages your audience. Whether youre presenting a business or an educational presentation, pre-designed presentation templates help save time. Retail Store Operations Analysis Of Average Wait Time At Retail Store Checkout Structure PDF is highly customizable and very easy to edit, covering many different styles from creative to business presentations. Slidegeeks has creative team members who have crafted amazing templates. So, go and get them without any delay.


This slide showcases call center action plan dashboard which highlights first call resolution, unresolved calls, customers call report, response time by weekday and average answer time. This Call Center Action Plan Dashboard Highlighting Average Answer Time With Total Resolutions Designs PDF from Slidegeeks makes it easy to present information on your topic with precision. It provides customization options, so you can make changes to the colors, design, graphics, or any other component to create a unique layout. It is also available for immediate download, so you can begin using it right away. Slidegeeks has done good research to ensure that you have everything you need to make your presentation stand out. Make a name out there for a brilliant performance.
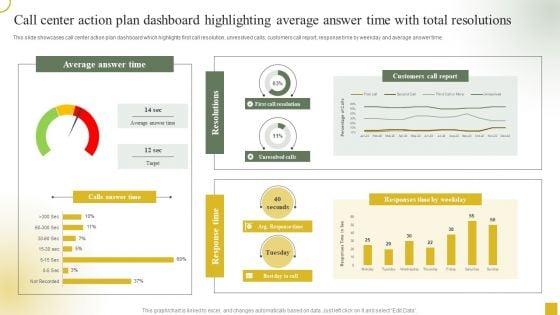

This slide showcases call center action plan dashboard which highlights first call resolution, unresolved calls, customers call report, response time by weekday and average answer time. Are you in need of a template that can accommodate all of your creative concepts This one is crafted professionally and can be altered to fit any style. Use it with Google Slides or PowerPoint. Include striking photographs, symbols, depictions, and other visuals. Fill, move around, or remove text boxes as desired. Test out color palettes and font mixtures. Edit and save your work, or work with colleagues. Download Call Center Action Plan Dashboard Highlighting Average Answer Time With Total Resolutions Template PDF and observe how to make your presentation outstanding. Give an impeccable presentation to your group and make your presentation unforgettable.


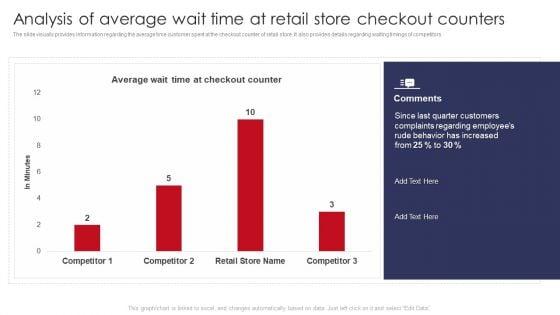
The slide visually provides information regarding the average time customer spent at the checkout counter of retail store. It also provides details regarding waiting timings of competitors.Deliver and pitch your topic in the best possible manner with this Analysis Of Average Wait Time At Retail Store Checkout Counters Retail Outlet Performance Assessment Mockup PDF. Use them to share invaluable insights on Average Customer, Counter Reflecting, Checkout Counter and impress your audience. This template can be altered and modified as per your expectations. So, grab it now.


The slide visually provides information regarding the average time customer spent at the checkout counter of retail store. It also provides details regarding waiting timings of competitors. Deliver an awe inspiring pitch with this creative Retail Outlet Operational Efficiency Analytics Analysis Of Average Wait Time At Retail Store Designs PDF bundle. Topics like Quarter Customers, Complaints Regarding, Employees can be discussed with this completely editable template. It is available for immediate download depending on the needs and requirements of the user.

The slide visually provides information regarding the average time customer spent at the checkout counter of retail store. It also provides details regarding waiting timings of competitors.Deliver an awe inspiring pitch with this creative Analysis Of Average Wait Time At Retail Store Checkout Counters Retail Outlet Operations Diagrams PDF bundle. Topics like Quarter Customers, Complaints Regarding, Behavior Increased can be discussed with this completely editable template. It is available for immediate download depending on the needs and requirements of the user.
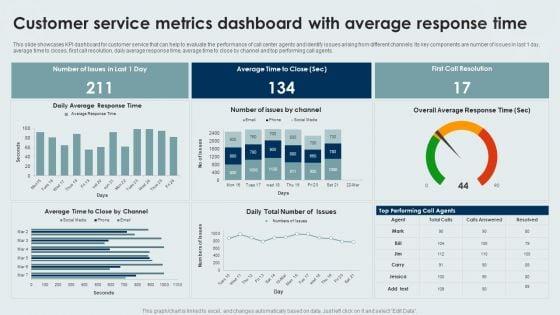

This slide showcases KPI dashboard for customer service that can help to evaluate the performance of call center agents and identify issues arising from different channels. Its key components are number of issues in last 1 day, average time to closes, first call resolution, daily average response time, average time to close by channel and top performing call agents. Pitch your topic with ease and precision using this Customer Service Metrics Dashboard With Average Response Time Formats PDF. This layout presents information on Customer Service, Metrics Dashboard, Average Response Time. It is also available for immediate download and adjustment. So, changes can be made in the color, design, graphics or any other component to create a unique layout.
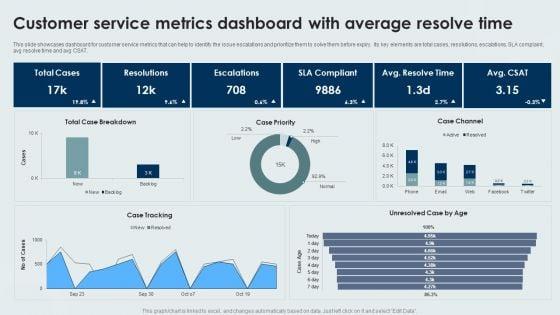

This slide showcases dashboard for customer service metrics that can help to identify the issue escalations and prioritize them to solve them before expiry. Its key elements are total cases, resolutions, escalations, SLA complaint, avg resolve time and avg CSAT. Showcasing this set of slides titled Customer Service Metrics Dashboard With Average Resolve Time Sample PDF. The topics addressed in these templates are Customer Service, Metrics Dashboard, Average Resolve Time. All the content presented in this PPT design is completely editable. Download it and make adjustments in color, background, font etc. as per your unique business setting.
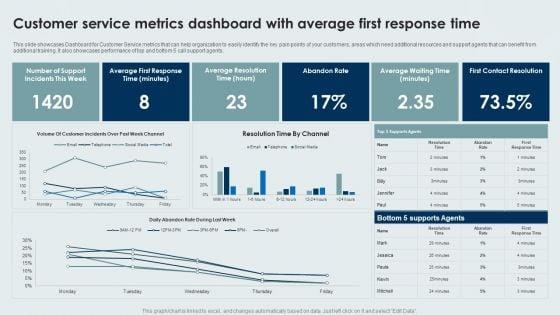
This slide showcases Dashboard for Customer Service metrics that can help organization to easily identify the key pain points of your customers, areas which need additional resources and support agents that can benefit from additional training. It also showcases performance of top and bottom 5 call support agents. Pitch your topic with ease and precision using this Customer Service Metrics Dashboard With Average First Response Time Background PDF. This layout presents information on Average, Abandon Rate, Contact Resolution. It is also available for immediate download and adjustment. So, changes can be made in the color, design, graphics or any other component to create a unique layout.
The following slide highlights the time to market dashboard with average delay illustrating projects completed on time, projects delayed, projects cancelled, completion rate vs Time and project types by new product, major feature release, medium feature release and minor feature release. Showcasing this set of slides titled Product Launch Time Project Dashboard With Average Delay Ppt Infographic Template Icon PDF. The topics addressed in these templates are Projects Completed Time, Projects Delayed, Projects Cancelled. All the content presented in this PPT design is completely editable. Download it and make adjustments in color, background, font etc. as per your unique business setting.


This graph or chart is linked to excel, and changes automatically based on data. Just left click on it and select Edit Data. Showcasing this set of slides titled Client Helpline Dashboard With Average Talk Time Distribution Ppt Gallery Backgrounds PDF. The topics addressed in these templates are External Incoming Call, Occupancy, Break Time, Sales. All the content presented in this PPT design is completely editable. Download it and make adjustments in color, background, font etc. as per your unique business setting.

This graph or chart is linked to excel, and changes automatically based on data. Just left click on it and select Edit Data. Showcasing this set of slides titled Client Helpline Dashboard Average Time To Solve Issue Ppt Portfolio Visuals PDF. The topics addressed in these templates are Cost Per Support, Customer Satisfaction, Costs To Revenue. All the content presented in this PPT design is completely editable. Download it and make adjustments in color, background, font etc. as per your unique business setting.


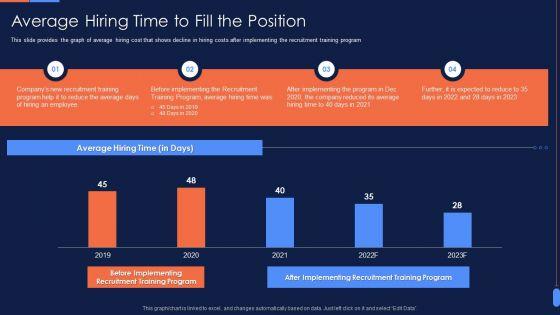
This slide provides the graph of average hiring time that shows decline in hiring timings after implementing the recruitment training program Deliver and pitch your topic in the best possible manner with this Recruitment Training Program For Workforce Average Hiring Time To Fill The Position Mockup PDF Use them to share invaluable insights on Recruitment Training Program, Implementing Recruitment, Recruitment Training and impress your audience. This template can be altered and modified as per your expectations. So, grab it now.


This slide provides the graph of average hiring time that shows decline in hiring timings after implementing the recruitment training program Deliver and pitch your topic in the best possible manner with this Outline Of Employee Recruitment Average Hiring Time To Fill The Position Microsoft PDF Use them to share invaluable insights on Recruitment Training, Hiring An Employee, Implementing The Recruitment and impress your audience. This template can be altered and modified as per your expectations. So, grab it now.


Showcasing this set of slides titled Medical Dashboard Showing Average Er Waiting Time Of Patient Elements PDF. The topics addressed in these templates are Medical Dashboard Showing Average Er Waiting Time Of Patient. All the content presented in this PPT design is completely editable. Download it and make adjustments in color, background, font etc. as per your unique business setting.
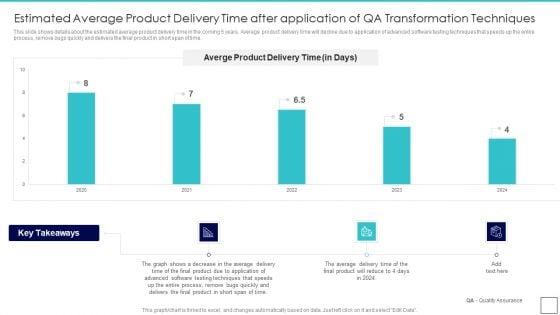

This slide shows details about the estimated average product delivery time in the coming 5 years. Average product delivery time will decline due to application of advanced software testing techniques that speeds up the entire process, remove bugs quickly and delivers the final product in short span of time.Deliver and pitch your topic in the best possible manner with this Deploying Quality Assurance QA Transformation Estimated Average Product Delivery Time After Inspiration PDF Use them to share invaluable insights on Estimated Average Product Delivery Time After Application Of QA Transformation Techniques and impress your audience. This template can be altered and modified as per your expectations. So, grab it now.
This slide shows details about the increasing Final Product Delivery Time in the past 5 years. The average delivery time is constantly increasing due to absence of advanced software testing techniques leading to increased bug rate in the product. Hence, leading to increased time in delivering the final product.Deliver an awe inspiring pitch with this creative Deploying Quality Assurance QA Transformation Average Product Delivery Time In Absence Of Effective Icons PDF bundle. Topics like Average Product Delivery Time In Absence Of Effective QA Transformation Techniques can be discussed with this completely editable template. It is available for immediate download depending on the needs and requirements of the user.

This slide provides the graph of average hiring cost that shows decline in hiring costs after implementing the recruitment training program. Deliver and pitch your topic in the best possible manner with this Recruitment Training To Optimize Average Hiring Time To Fill The Position Diagrams PDF. Use them to share invaluable insights on Average Hiring Time, 2019 To 2023, Employee and impress your audience. This template can be altered and modified as per your expectations. So, grab it now.
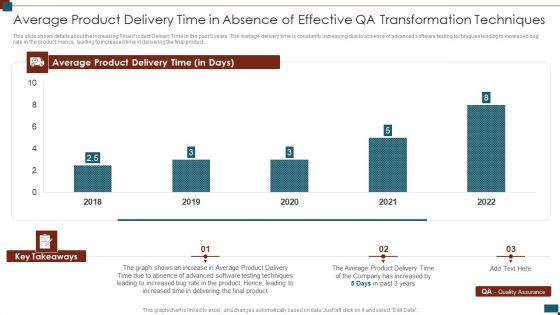

This slide shows details about the increasing Final Product Delivery Time in the past 5 years. The average delivery time is constantly increasing due to absence of advanced software testing techniques leading to increased bug rate in the product. Hence, leading to increased time in delivering the final product. Deliver an awe inspiring pitch with this creative successful quality assurance transition techniques to enhance product quality average product delivery time microsoft pdf bundle. Topics like average product delivery time, key takeaways can be discussed with this completely editable template. It is available for immediate download depending on the needs and requirements of the user.


This slide provides the graph of average hiring time that shows decline in hiring timings after implementing the recruitment training program. Deliver and pitch your topic in the best possible manner with this recruitment training enhance candidate hiring process average hiring time to fill the position template pdf. Use them to share invaluable insights on average hiring time to fill the position and impress your audience. This template can be altered and modified as per your expectations. So, grab it now.
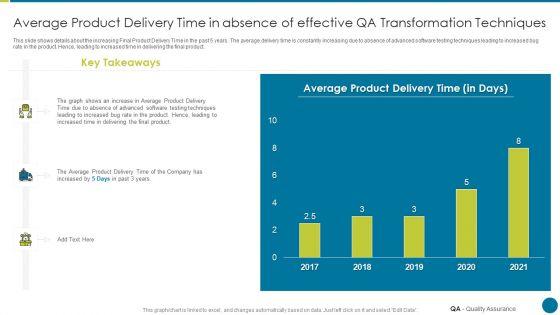

This slide shows details about the increasing Final Product Delivery Time in the past 5 years. The average delivery time is constantly increasing due to absence of advanced software testing techniques leading to increased bug rate in the product. Hence, leading to increased time in delivering the final product. Deliver an awe inspiring pitch with this creative qa modification for product quality development and consumer satisfaction average product delivery time template pdf bundle. Topics like average product delivery time in absence of effective qa transformation techniques can be discussed with this completely editable template. It is available for immediate download depending on the needs and requirements of the user.
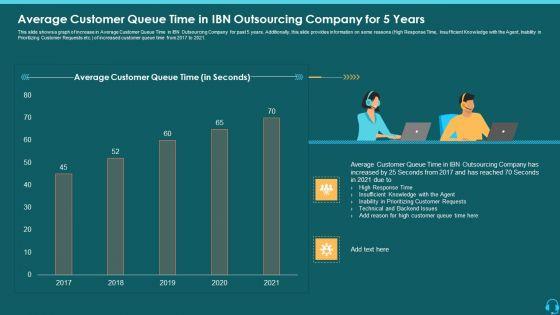
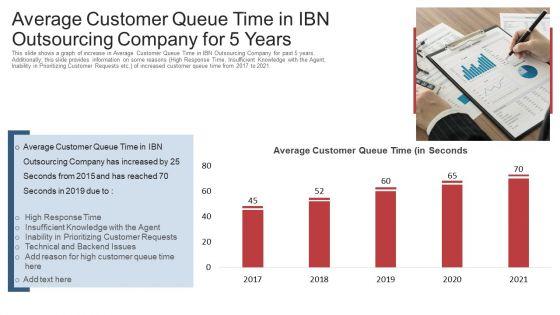
This slide shows a graph of increase in Average Customer Queue Time in IBN Outsourcing Company for past 5 years. Additionally, this slide provides information on some reasons High Response Time, Insufficient Knowledge with the Agent, Inability in Prioritizing Customer Requests etc. of increased customer queue time from 2017 to 2021. Deliver an awe-inspiring pitch with this creative average customer queue time in ibn outsourcing company for 5 years graphics pdf bundle. Topics like average customer queue time in ibn outsourcing company for 5 years can be discussed with this completely editable template. It is available for immediate download depending on the needs and requirements of the user.
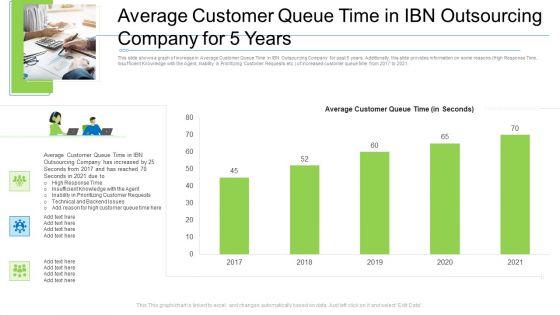

This slide shows a graph of increase in Average Customer Queue Time in IBN Outsourcing Company for past 5 years. Additionally, this slide provides information on some reasons High Response Time, Insufficient Knowledge with the Agent, Inability in Prioritizing Customer Requests etc. of increased customer queue time from 2017 to 2021. Deliver an awe-inspiring pitch with this creative average customer queue time in ibn outsourcing company for 5 years diagrams pdf. bundle. Topics like average customer queue time in ibn outsourcing company for 5 years can be discussed with this completely editable template. It is available for immediate download depending on the needs and requirements of the user.


This slide shows a graph of increase in Average Customer Queue Time in IBN Outsourcing Company for past 5 years. Additionally, this slide provides information on some reasons High Response Time, Insufficient Knowledge with the Agent, Inability in Prioritizing Customer Requests etc. of increased customer queue time from 2017 to 2021. Deliver an awe inspiring pitch with this creative average customer queue time in IBN outsourcing company for 5 years ppt professional background image pdf bundle. Topics like average customer queue time in IBN outsourcing company for 5 years, 2017 to 2021 can be discussed with this completely editable template. It is available for immediate download depending on the needs and requirements of the user.
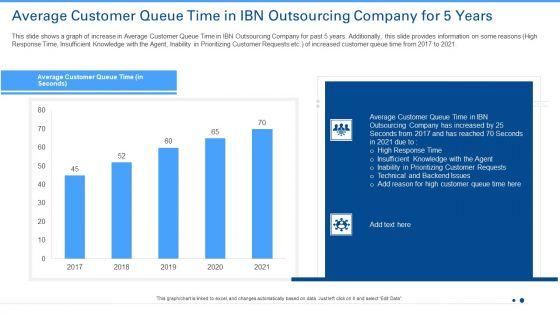
This slide shows a graph of increase in Average Customer Queue Time in IBN Outsourcing Company for past 5 years. Additionally, this slide provides information on some reasons High Response Time, Insufficient Knowledge with the Agent, Inability in Prioritizing Customer Requests etc. of increased customer queue time from 2017 to 2021. Deliver an awe-inspiring pitch with this creative average customer queue time in ibn outsourcing company for 5 years ppt ideas pdf. bundle. Topics like average customer queue time, 2017 to 2021 can be discussed with this completely editable template. It is available for immediate download depending on the needs and requirements of the user.
This slide shows a graph of increase in Average Customer Queue Time in IBN Outsourcing Company for past 5 years. Additionally, this slide provides information on some reasons High Response Time, Insufficient Knowledge with the Agent, Inability in Prioritizing Customer Requests etc. of increased customer queue time from 2017 to 2021. Deliver an awe-inspiring pitch with this creative average customer queue time in ibn outsourcing company for 5 years ppt gallery vector pdf. bundle. Topics like outsourcing, average customer, prioritizing customer can be discussed with this completely editable template. It is available for immediate download depending on the needs and requirements of the user.
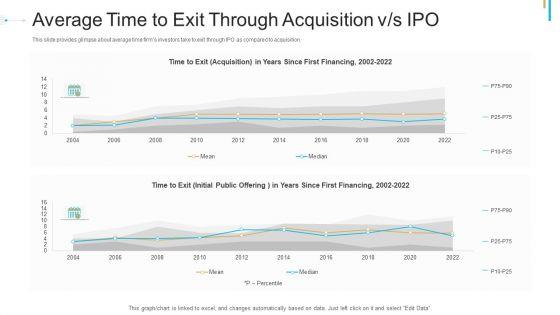
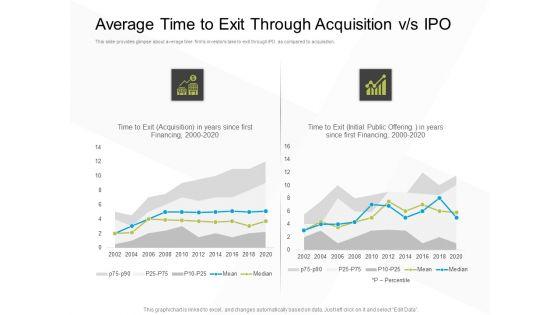
This slide provides glimpse about average time firms investors take to exit through IPO as compared to acquisition. Deliver an awe inspiring pitch with this creative stock offering as an exit alternative average time to exit through acquisition v s ipo ppt styles design ideas pdf bundle. Topics like acquisition, financing, initial, public offering can be discussed with this completely editable template. It is available for immediate download depending on the needs and requirements of the user.

This slide provides glimpse about average time firms investors take to exit through IPO as compared to acquisition. Deliver an awe inspiring pitch with this creative reform endgame average time to exit through acquisition v s ipo designs pdf bundle. Topics like average time to exit through acquisition v or s ipo can be discussed with this completely editable template. It is available for immediate download depending on the needs and requirements of the user.


This slide provides glimpse about average time firms investors take to exit through IPO as compared to acquisition. Deliver an awe inspiring pitch with this creative management acquisition as exit strategy ownership transfer average time to exit through acquisition v s ipo professional pdf bundle. Topics like acquisition, financing, initial public can be discussed with this completely editable template. It is available for immediate download depending on the needs and requirements of the user.
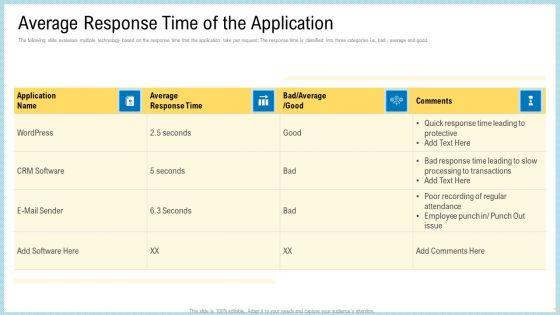
The following slide evaluates multiple technology based on the response time that the application take per request. The response time is classified into three categories i.e. bad , average and good.Deliver an awe inspiring pitch with this creative marketing technology stack average response time of the application professional pdf bundle. Topics like wordpress, average, response time, bad or average or good can be discussed with this completely editable template. It is available for immediate download depending on the needs and requirements of the user.
Pitch your topic with ease and precision using this average whole time equivalent workforce report ppt powerpoint presentation icon files pdf. This layout presents information on average whole time equivalent workforce report. It is also available for immediate download and adjustment. So, changes can be made in the color, design, graphics or any other component to create a unique layout.


Showcasing this set of slides titled human resource key performance indicators with average time fill by department ppt powerpoint presentation gallery example introduction pdf. The topics addressed in these templates are sales, service, finance. All the content presented in this PPT design is completely editable. Download it and make adjustments in color, background, font etc. as per your unique business setting.
Deliver an awe inspiring pitch with this creative solvency action plan for private organization average time to exit through acquisition vs ipo icons pdf bundle. Topics like acquisition, financing, initial, public offering can be discussed with this completely editable template. It is available for immediate download depending on the needs and requirements of the user.
Presenting this set of slides with name business evacuation plan average time to exit through acquisition vs ipo ppt powerpoint presentation show outfit pdf. The topics discussed in these slides are financing, time to exit, initial public offering, acquisition. This is a completely editable PowerPoint presentation and is available for immediate download. Download now and impress your audience.
SHOW
- 60
- 120
- 180
DISPLAYING: 60 of 81 Item(s)
Page