- Sign up
- Sign In
 AI PPT Maker
 Templates
 PPT Bundles
 Design Services
 Business PPTs
 Business Plan
 Management
 Strategy
 Introduction PPT
 Roadmap
 Self Introduction
 Timelines
 Process
 Marketing
 Agenda
 Technology
 Medical
 Startup Business Plan
 Cyber Security
 Dashboards
 SWOT
SWOT Proposals
 Education
 Pitch Deck
 Digital Marketing
 KPIs
KPIs Project Management
 Product Management
 Artificial Intelligence
 Target Market
 Communication
 Supply Chain
 Google Slides
 Research Services
 One Pagers
 All Categories
Build dashboards PowerPoint Presentation Templates and Google Slides
SHOW
- 60
- 120
- 180
DISPLAYING: 60 of 82 Item(s)
Page


The following slide showcases the impact of offline marketing strategies on store performance. The key performance indicators KPIs mentioned in slide are sales, customers, average transaction price, average units per customer, top collections, sales by different segments, etc. Retrieve professionally designed Comprehensive Guide To Build Marketing Traditional Marketing KPI Dashboard With Total Designs PDF to effectively convey your message and captivate your listeners. Save time by selecting pre-made slideshows that are appropriate for various topics, from business to educational purposes. These themes come in many different styles, from creative to corporate, and all of them are easily adjustable and can be edited quickly. Access them as PowerPoint templates or as Google Slides themes. You do not have to go on a hunt for the perfect presentation because Slidegeeks got you covered from everywhere.
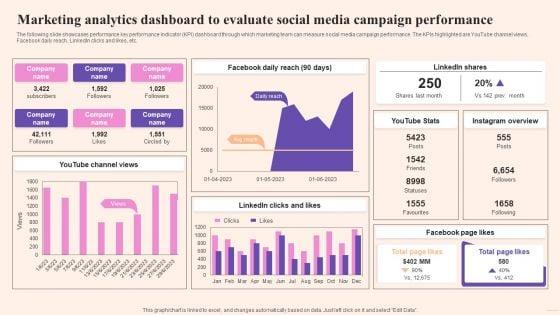

The following slide showcases performance key performance indicator KPI dashboard through which marketing team can measure social media campaign performance. The KPIs highlighted are YouTube channel views, Facebook daily reach, LinkedIn clicks and likes, etc. Explore a selection of the finest Comprehensive Guide To Build Marketing Marketing Analytics Dashboard To Evaluate Structure PDF here. With a plethora of professionally designed and pre-made slide templates, you can quickly and easily find the right one for your upcoming presentation. You can use our Comprehensive Guide To Build Marketing Marketing Analytics Dashboard To Evaluate Structure PDF to effectively convey your message to a wider audience. Slidegeeks has done a lot of research before preparing these presentation templates. The content can be personalized and the slides are highly editable. Grab templates today from Slidegeeks.
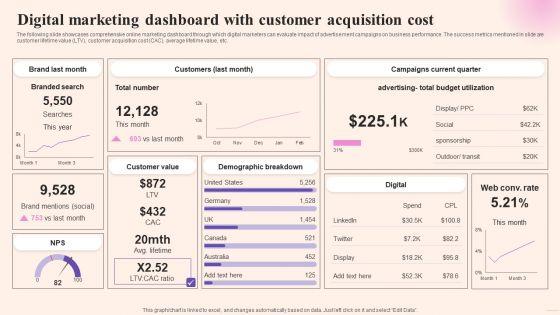
The following slide showcases comprehensive online marketing dashboard through which digital marketers can evaluate impact of advertisement campaigns on business performance. The success metrics mentioned in slide are customer lifetime value LTV, customer acquisition cost CAC, average lifetime value, etc. Do you have an important presentation coming up Are you looking for something that will make your presentation stand out from the rest Look no further than Comprehensive Guide To Build Marketing Digital Marketing Dashboard With Customer Acquisition Diagrams PDF. With our professional designs, you can trust that your presentation will pop and make delivering it a smooth process. And with Slidegeeks, you can trust that your presentation will be unique and memorable. So why wait Grab Comprehensive Guide To Build Marketing Digital Marketing Dashboard With Customer Acquisition Diagrams PDF today and make your presentation stand out from the rest.


Mentioned slide showcases KPI dashboard that can be used to check the financial performance of a brand. Metrics covered in the dashboard are return on assets, working capital ratio, return on equity etc.This Building Brand Leadership Strategy To Dominate The Market KPI Dashboard To Track Brand Performance Formats PDF is perfect for any presentation, be it in front of clients or colleagues. It is a versatile and stylish solution for organizing your meetings. The Building Brand Leadership Strategy To Dominate The Market KPI Dashboard To Track Brand Performance Formats PDF features a modern design for your presentation meetings. The adjustable and customizable slides provide unlimited possibilities for acing up your presentation. Slidegeeks has done all the homework before launching the product for you. So, dont wait, grab the presentation templates today
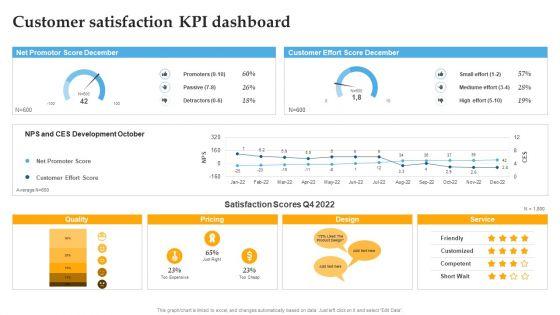

Are you searching for a atisfaction Kpi Dashboard Comprehensive Personal Brand Building Guide For Social Media Influencers Sample PDF that is uncluttered, straightforward, and original Its easy to edit, and you can change the colors to suit your personal or business branding. For a presentation that expresses how much effort you have put in, this template is ideal With all of its features, including tables, diagrams, statistics, and lists, its perfect for a business plan presentation. Make your ideas more appealing with these professional slides. Download atisfaction Kpi Dashboard Comprehensive Personal Brand Building Guide For Social Media Influencers Sample PDF from Slidegeeks today.

The following slide outlines the key performance indicator dashboard used by the organization to evaluate the effectiveness of multiple marketing campaigns. It provides information about total spending, impressions, acquisitions, cost per acquisition, clicks, etc. Slidegeeks is one of the best resources for PowerPoint templates. You can download easily and regulate Brand Building Techniques Enhance Customer Engagement Loyalty Dashboard Showing Performance Rules PDF for your personal presentations from our wonderful collection. A few clicks is all it takes to discover and get the most relevant and appropriate templates. Use our Templates to add a unique zing and appeal to your presentation and meetings. All the slides are easy to edit and you can use them even for advertisement purposes.
Here you can discover an assortment of the finest PowerPoint and Google Slides templates. With these templates, you can create presentations for a variety of purposes while simultaneously providing your audience with an eye-catching visual experience. Download Strategic Guide To Build Brand Personality Overall Brand Performance Tracking Dashboard Themes PDF to deliver an impeccable presentation. These templates will make your job of preparing presentations much quicker, yet still, maintain a high level of quality. Slidegeeks has experienced researchers who prepare these templates and write high-quality content for you. Later on, you can personalize the content by editing the Strategic Guide To Build Brand Personality Overall Brand Performance Tracking Dashboard Themes PDF.
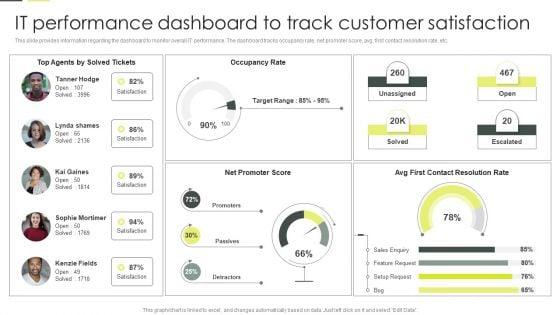

This slide provides information regarding the dashboard to monitor overall IT performance. The dashboard tracks occupancy rate, net promoter score, avg. first contact resolution rate, etc. Find a pre designed and impeccable Building An IT Strategy Plan For Business Expansion IT Performance Dashboard To Track Customer Satisfaction Download PDF. The templates can ace your presentation without additional effort. You can download these easy to edit presentation templates to make your presentation stand out from others. So, what are you waiting for Download the template from Slidegeeks today and give a unique touch to your presentation.
This slide covers the dashboard for monitoring various audience segments. It includes metrics such as ad mentions, engagement, top occupation of the audience, top interest of the audience, age, language, etc. Boost your pitch with our creative Dashboard For Tracking Brand Communication Campaign Results Building A Comprehensive Brand Elements PDF. Deliver an awe-inspiring pitch that will mesmerize everyone. Using these presentation templates you will surely catch everyones attention. You can browse the ppts collection on our website. We have researchers who are experts at creating the right content for the templates. So you do not have to invest time in any additional work. Just grab the template now and use them.


This slide covers the dashboard for tracking brand reputation. It also includes metrics such as new customer lifetime value, customer acquisition cost, target met, above sales target, average weekly sales revenue, etc. Find a pre-designed and impeccable Dashboard For Analyzing Brand Perception Building A Comprehensive Brand Elements PDF. The templates can ace your presentation without additional effort. You can download these easy-to-edit presentation templates to make your presentation stand out from others. So, what are you waiting for Download the template from Slidegeeks today and give a unique touch to your presentation.
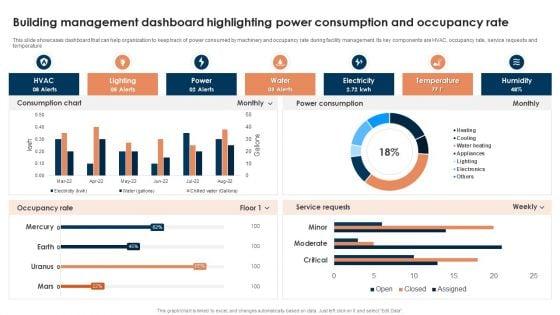
This slide showcases dashboard that can help organization to keep track of power consumed by machinery and occupancy rate during facility management. Its key components are HVAC, occupancy rate, service requests and temperature. Pitch your topic with ease and precision using this Building Management Dashboard Highlighting Power Consumption And Occupancy Rate Template PDF. This layout presents information on Lighting, Power, Water, Electricity, Temperature. It is also available for immediate download and adjustment. So, changes can be made in the color, design, graphics or any other component to create a unique layout.
This slide showcases dashboard which can help organization to keep track of issues plus faults during facility management and rectify them within stipulated time. Its key elements are issues reported, fault tracking, etc. Pitch your topic with ease and precision using this Issues Tracking Dashboard For Organizational Building Management Ppt Infographics Topics PDF. This layout presents information on Fault Tracking, Issues Reported, Location. It is also available for immediate download and adjustment. So, changes can be made in the color, design, graphics or any other component to create a unique layout.
This slide showcases evaluating teams through 360 degree feedback method. It provides information about reliability, loyalty, initiatives, participitative, communication skills, writing skills, feedback, decision making, quick grasping, etc.Crafting an eye-catching presentation has never been more straightforward. Let your presentation shine with this tasteful yet straightforward Sales Team Performance Management And Tracking Dashboard Building Efficient Workplace Performance Summary PDF template. It offers a minimalistic and classy look that is great for making a statement. The colors have been employed intelligently to add a bit of playfulness while still remaining professional. Construct the ideal Sales Team Performance Management And Tracking Dashboard Building Efficient Workplace Performance Summary PDF that effortlessly grabs the attention of your audience Begin now and be certain to wow your customers.
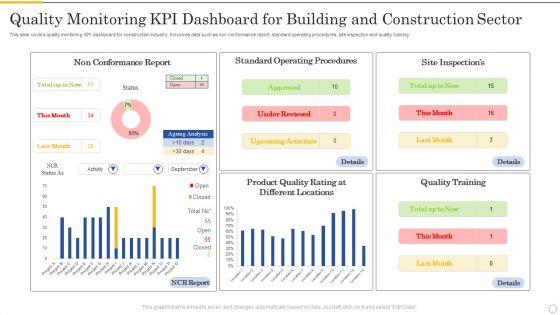
This slide covers quality monitoring KPI dashboard for construction industry. It involves data such as non conformance report, standard operating procedures, site inspection and quality training. Showcasing this set of slides titled Quality Monitoring Kpi Dashboard For Building And Construction Sector Portrait PDF. The topics addressed in these templates are Non Conformance Report, Standard Operating, Procedures. All the content presented in this PPT design is completely editable. Download it and make adjustments in color, background, font etc. as per your unique business setting.


This slide covers quality management KPI dashboard for construction industry. It involves success rate at site inspection, customer complaints, total rework cost, customer satisfaction ratio. Pitch your topic with ease and precision using this Compliance Management Kpi Dashboard For Building And Construction Sector Inspiration PDF. This layout presents information on Customer Complaints, Customer Satisfaction, Safety Meetings. It is also available for immediate download and adjustment. So, changes can be made in the color, design, graphics or any other component to create a unique layout.
The following slide showcases dashboard of construction company exhibiting quality KPIs regarding safety, workmanship and customer satisfaction. Key indicators covered are site inspection success level, CSR, defect count, net promoter score, promotors, passives, defectors, total rework cost, safety meetings and average time taken to fix defects. Showcasing this set of slides titled Building Quality Inspection Dashboard With Customer Satisfaction Ratio Icons PDF. The topics addressed in these templates are Construction Project, Customer Satisfaction Ratio, Promoters. All the content presented in this PPT design is completely editable. Download it and make adjustments in color, background, font etc. as per your unique business setting.
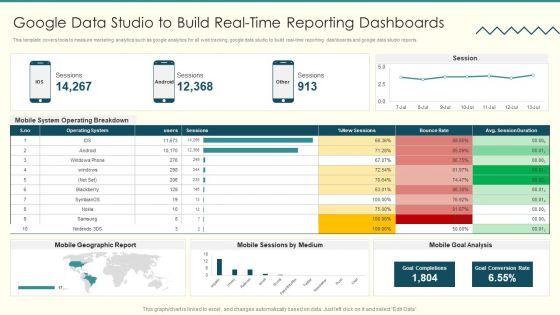
This template covers tools to measure marketing analytics such as google analytics for all web tracking, google data studio to build real time reporting dashboards and google data studio reports.Deliver an awe inspiring pitch with this creative Security And Performance Digital Marketing Google Data Studio To Build Realtime Reporting Dashboards Information PDF bundle. Topics like Operating Breakdown, Session Duration, Goal Completions can be discussed with this completely editable template. It is available for immediate download depending on the needs and requirements of the user.
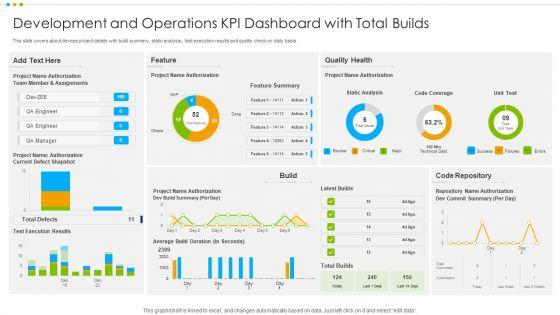

This slide covers about devops project details with build summary, static analysis , test execution results and quality check on daily basis.Showcasing this set of slides titled Development And Operations KPI Dashboard With Total Builds Ideas PDF The topics addressed in these templates are Member Assignments, Code Repository, Quality Health All the content presented in this PPT design is completely editable. Download it and make adjustments in color, background, font etc. as per your unique business setting.

This template covers tools to measure marketing analytics such as google analytics for all web tracking, google data studio to build real-time reporting dashboards and google data studio reports. Deliver and pitch your topic in the best possible manner with this Playbook For Content Advertising Google Data Studio To Build Real Time Reporting Dashboards Formats PDF. Use them to share invaluable insights on Mobile System, Operating Breakdown, Geographic Report and impress your audience. This template can be altered and modified as per your expectations. So, grab it now.
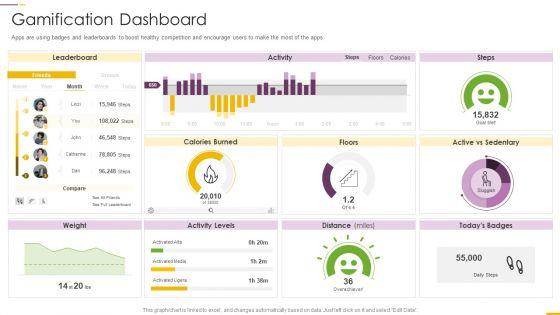
Apps are using badges and leaderboards to boost healthy competition and encourage users to make the most of the apps.Deliver and pitch your topic in the best possible manner with this how build gamification advertising plan gamification dashboard ppt model slide pdf. Use them to share invaluable insights on gamification dashboard and impress your audience. This template can be altered and modified as per your expectations. So, grab it now.
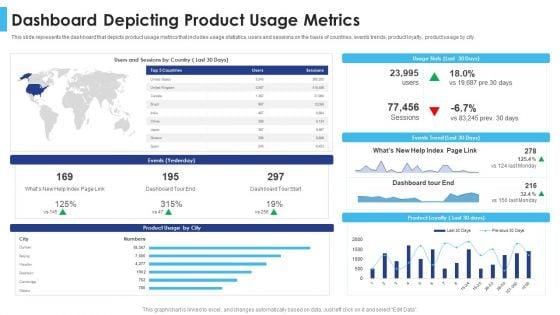
This slide represents the dashboard that depicts product usage metrics that includes usage statistics, users and sessions on the basis of countries, events trends, product loyalty, product usage by city. Deliver and pitch your topic in the best possible manner with this satisfying consumers through strategic product building plan dashboard depicting product usage metrics inspiration pdf. Use them to share invaluable insights on dashboard depicting product usage metrics and impress your audience. This template can be altered and modified as per your expectations. So, grab it now.
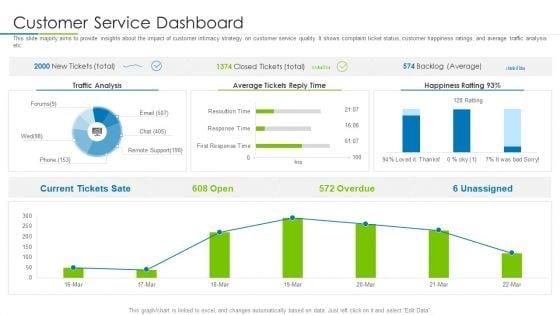

This slide majorly aims to provide insights about the impact of customer intimacy strategy on customer service quality. It shows complaint ticket status, customer happiness ratings, and average traffic analysis etc. Deliver and pitch your topic in the best possible manner with this customer rapport strategy to build loyal client base customer service dashboard diagrams pdf. Use them to share invaluable insights on customer service dashboard and impress your audience. This template can be altered and modified as per your expectations. So, grab it now.
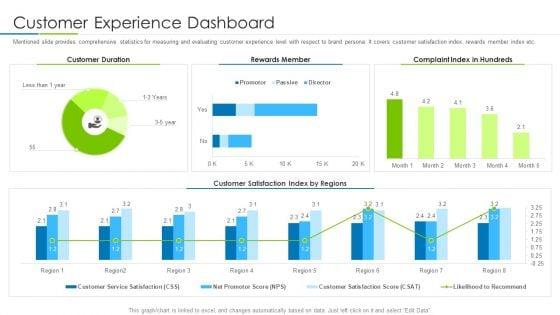
Mentioned slide provides comprehensive statistics for measuring and evaluating customer experience level with respect to brand persona. It covers customer satisfaction index, rewards member index etc. Deliver an awe inspiring pitch with this creative customer rapport strategy to build loyal client base customer experience dashboard designs pdf bundle. Topics like customer duration, rewards member, customer satisfaction can be discussed with this completely editable template. It is available for immediate download depending on the needs and requirements of the user.
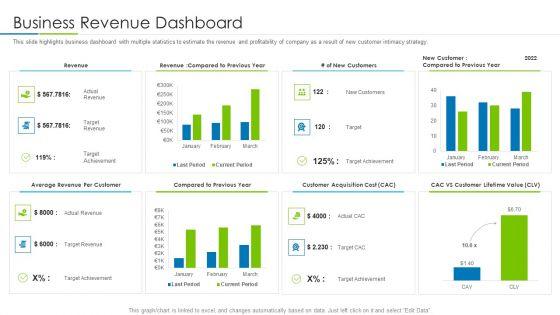

This slide highlights business dashboard with multiple statistics to estimate the revenue and profitability of company as a result of new customer intimacy strategy. Deliver and pitch your topic in the best possible manner with this customer rapport strategy to build loyal client base business revenue dashboard elements pdf. Use them to share invaluable insights on revenue, previous year, customer and impress your audience. This template can be altered and modified as per your expectations. So, grab it now.

Following slide outlines a revenue analysis dashboard showcasing the business results after implementing marketing strategy. It provides information about total revenue for the month, revenue for year to date, revenue trend, product revenue and services revenue etc. Pitch your topic with ease and precision using this revenue analysis kpi dashboard post building marketing strategy infographics pdf. This layout presents information on revenue analysis kpi dashboard post building marketing strategy. It is also available for immediate download and adjustment. So, changes can be made in the color, design, graphics or any other component to create a unique layout.
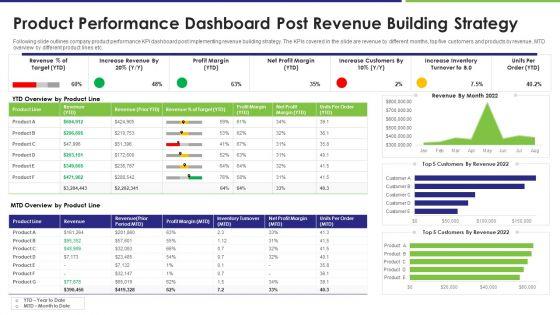
Following slide outlines company product performance KPI dashboard post implementing revenue building strategy. The KPIs covered in the slide are revenue by different months, top five customers and products by revenue, MTD overview by different product lines etc. Showcasing this set of slides titled product performance dashboard post revenue building strategy brochure pdf. The topics addressed in these templates are revenue, target, profit margin. All the content presented in this PPT design is completely editable. Download it and make adjustments in color, background, font etc. as per your unique business setting.
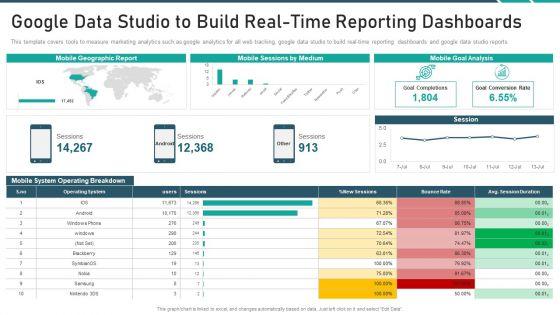
This template covers tools to measure marketing analytics such as google analytics for all web tracking, google data studio to build real time reporting dashboards and google data studio reports. Deliver and pitch your topic in the best possible manner with this online promotion playbook google data studio to build real time reporting dashboards topics pdf. Use them to share invaluable insights on google data studio to build real time reporting dashboards and impress your audience. This template can be altered and modified as per your expectations. So, grab it now.


This slide portrays property management dashboard with KPIs namely, average days on market, properties for sale, properties for rent, sales vs. target and sales by region. Deliver and pitch your topic in the best possible manner with this building promotional campaign real estate sales real estate dashboard to monitor sales team performance guidelines pdf. Use them to share invaluable insights on property management kpi dashboard and impress your audience. This template can be altered and modified as per your expectations. So, grab it now.

Following slide illustrates information about the promotion strategy adopted by the firm to meet its objectives. Objectives covered in the slide are informative and persuasive promotion. Deliver an awe inspiring pitch with this creative building promotional campaign real estate sales property management kpi dashboard rules pdf bundle. Topics like process, producer, wholesalers, persuasive can be discussed with this completely editable template. It is available for immediate download depending on the needs and requirements of the user.


The following slide displays a brand awareness dashboard as it highlights the key metrics for measuring brand awareness such as brand search, social media searches, links, brand and mentions. Deliver and pitch your topic in the best possible manner with this how make impactful product marketing message build product differentiation product performance dashboard with total revenues information pdf. Use them to share invaluable insights on social, organic, performance, traffic and impress your audience. This template can be altered and modified as per your expectations. So, grab it now.
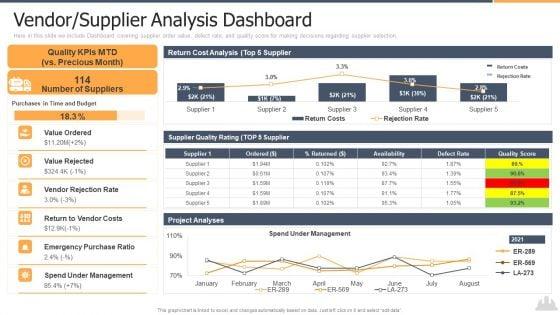

Here in this slide we include Dashboard covering supplier order value, defect rate, and quality score for making decisions regarding supplier selection. Deliver and pitch your topic in the best possible manner with this building projects risk landscape vendor supplier analysis dashboard guidelines pdf. Use them to share invaluable insights on vendor supplier analysis dashboard and impress your audience. This template can be altered and modified as per your expectations. So, grab it now.


This slide shows dashboard covering overall progress report of construction project by tracking cost reduction, procurement ROI, and top suppliers. Deliver and pitch your topic in the best possible manner with this building projects risk landscape project risk monitoring and reporting dashboard themes pdf. Use them to share invaluable insights on project risk monitoring and reporting dashboard and impress your audience. This template can be altered and modified as per your expectations. So, grab it now.
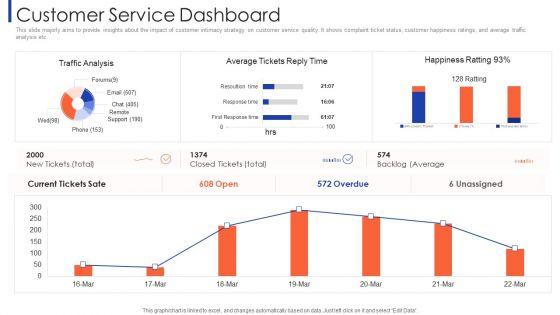

This slide majorly aims to provide insights about the impact of customer intimacy strategy on customer service quality. It shows complaint ticket status, customer happiness ratings, and average traffic analysis etc. Deliver and pitch your topic in the best possible manner with this customer relationship strategy for building loyalty customer service dashboard mockup pdf. Use them to share invaluable insights on traffic analysis, average tickets reply time and impress your audience. This template can be altered and modified as per your expectations. So, grab it now.
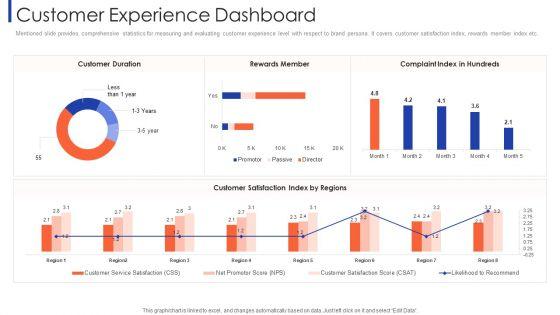

Mentioned slide provides comprehensive statistics for measuring and evaluating customer experience level with respect to brand persona. It covers customer satisfaction index, rewards member index etc. Deliver an awe inspiring pitch with this creative customer relationship strategy for building loyalty customer experience dashboard designs pdf bundle. Topics like customer duration, rewards member, complaint index in hundreds, customer satisfaction index by regions can be discussed with this completely editable template. It is available for immediate download depending on the needs and requirements of the user.
This slide highlights business dashboard with multiple statistics to estimate the revenue and profitability of company as a result of new customer intimacy strategy. Deliver an awe inspiring pitch with this creative customer relationship strategy for building loyalty business revenue dashboard icons pdf bundle. Topics like average revenue per customer, compared to previous year, customer acquisition cost, cac vs customer lifetime value, revenue can be discussed with this completely editable template. It is available for immediate download depending on the needs and requirements of the user.
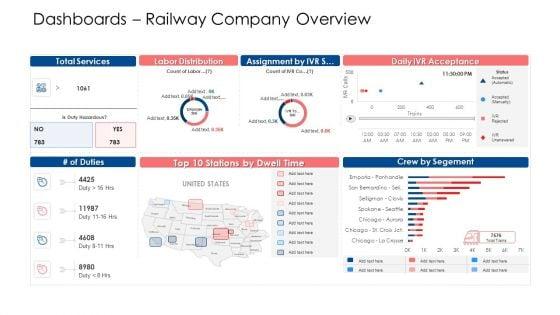

Deliver an awe inspiring pitch with this creative building brand image of a railway firm dashboards railway company overview background pdf bundle. Topics like dashboards railway company overview can be discussed with this completely editable template. It is available for immediate download depending on the needs and requirements of the user.


This slide covers the company culture dashboard which focuses on different important aspects such as willingness to learn, morale, customer focus, goal orientation, etc. Deliver and pitch your topic in the best possible manner with this building efficient work environment organization culture dashboard information pdf. Use them to share invaluable insights on organization culture dashboard and impress your audience. This template can be altered and modified as per your expectations. So, grab it now.


The purpose of this slide is to provide a graph showing the production and sales over the last 4 years in the organization, also defining the rationale behind the decrease in production and sales within the company. Deliver an awe inspiring pitch with this creative building efficient work environment company department cultural dashboard guidelines pdf bundle. Topics like growth, development, excellence, culture can be discussed with this completely editable template. It is available for immediate download depending on the needs and requirements of the user.


Deliver and pitch your topic in the best possible manner with this infrastructure building administration infrastructure kpi dashboard showing resource allocation background pdf. Use them to share invaluable insights on days per project, project financial, resource allocation and impress your audience. This template can be altered and modified as per your expectations. So, grab it now.
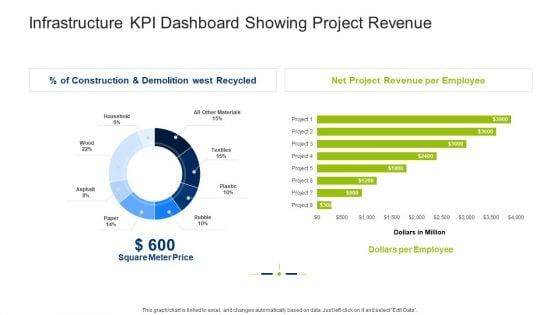

Deliver an awe inspiring pitch with this creative infrastructure building administration infrastructure kpi dashboard showing project revenue clipart pdf bundle. Topics like square meter price, net project revenue per employee, dollars per employee can be discussed with this completely editable template. It is available for immediate download depending on the needs and requirements of the user.
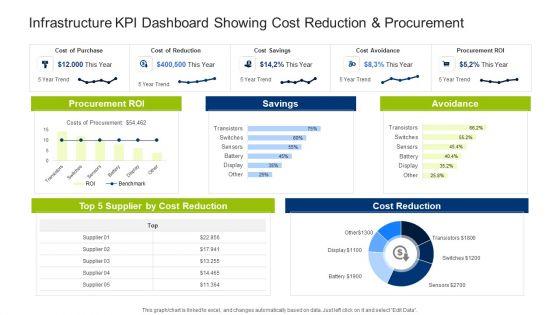

Deliver and pitch your topic in the best possible manner with this infrastructure building administration infrastructure kpi dashboard showing cost reduction and procurement inspiration pdf. Use them to share invaluable insights on cost of purchase, cost of reduction, cost avoidance, savings, avoidance and impress your audience. This template can be altered and modified as per your expectations. So, grab it now.


The dashboard will provide overall scenario of all leads and track various leads based on the grading point assigned to them. Deliver an awe inspiring pitch with this creative how to build a revenue funnel lead scoring dashboard score pictures pdf bundle. Topics like lead scoring dashboard can be discussed with this completely editable template. It is available for immediate download depending on the needs and requirements of the user.
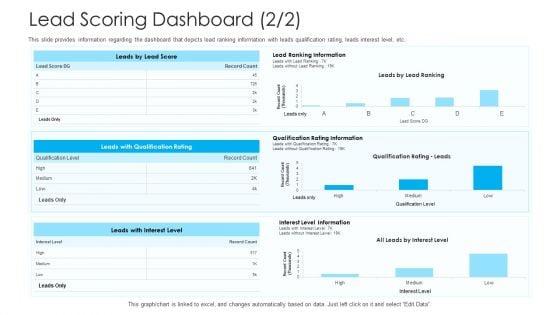

This slide provides information regarding the dashboard that depicts lead ranking information with leads qualification rating, leads interest level, etc. Deliver and pitch your topic in the best possible manner with this how to build a revenue funnel lead scoring dashboard level elements pdf. Use them to share invaluable insights on lead scoring dashboard and impress your audience. This template can be altered and modified as per your expectations. So, grab it now.


Show your highlights of sale through our dashboard. Deliver an awe-inspiring pitch with this creative building innovation capabilities and usp detection sales dashboard ppt diagram templates pdf bundle. Topics like top products revenue, product sale comparison, incremental sales campaign can be discussed with this completely editable template. It is available for immediate download depending on the needs and requirements of the user.


Show your highlights of your online marketing campaign through our dashboard. Deliver and pitch your topic in the best possible manner with this building innovation capabilities and usp detection online marketing dashboard ppt outline file formats. Use them to share invaluable insights on total leads, sales ready leads, new customers, new revenue and impress your audience. This template can be altered and modified as per your expectations. So, grab it now.


Show your sale and financial highlights of through our dashboard. Deliver an awe-inspiring pitch with this creative building innovation capabilities and usp detection marketing kpi and dashboard ppt infographic template pictures pdf bundle. Topics like revenue per acquisition, per acquisition, marketing spend, total revenu, leads, acquisitions, profit, return on investment can be discussed with this completely editable template. It is available for immediate download depending on the needs and requirements of the user.


Deliver an awe inspiring pitch with this creative building customer experience strategy for business marketing dashboard template clipart pdf bundle. Topics like marketing dashboard template can be discussed with this completely editable template. It is available for immediate download depending on the needs and requirements of the user.
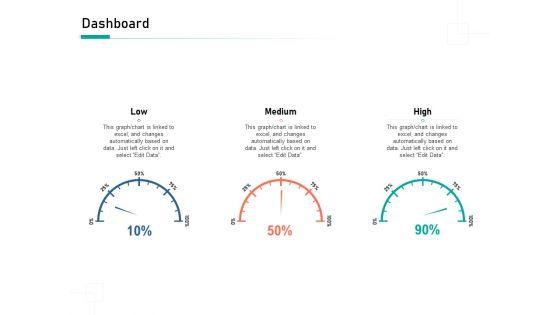

deliver and pitch your topic in the best possible manner with this organizational building blocks dashboard ppt powerpoint presentation inspiration professional Pdf use them to share invaluable insights on low, medium, high. and impress your audience. this template can be altered and modified as per your expectations. so, grab it now.


The Building Blocks Of Digital Transformation Dashboard Ppt PowerPoint Presentation Model Shapes PDF
Presenting this set of slides with name the building blocks of digital transformation dashboard ppt powerpoint presentation model shapes pdf. The topics discussed in these slide is dashboard. This is a completely editable PowerPoint presentation and is available for immediate download. Download now and impress your audience.


Deliver an awe inspiring pitch with this creative label building initiatives brand performance dashboard ppt styles good pdf bundle. Topics like customer, sales, competitive, customers, branding can be discussed with this completely editable template. It is available for immediate download depending on the needs and requirements of the user.


Presenting this set of slides with name brand identity how build it dashboard ppt summary clipart pdf. This is a three stage process. The stages in this process are low, medium, high. This is a completely editable PowerPoint presentation and is available for immediate download. Download now and impress your audience.
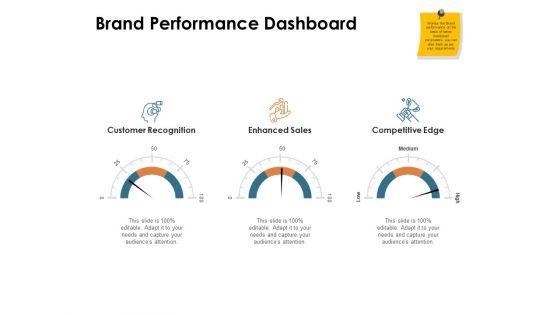

Presenting this set of slides with name brand identity how build it brand performance dashboard ppt professional mockup pdf. This is a three stage process. The stages in this process are customer recognition, enhanced sales, competitive edge. This is a completely editable PowerPoint presentation and is available for immediate download. Download now and impress your audience.
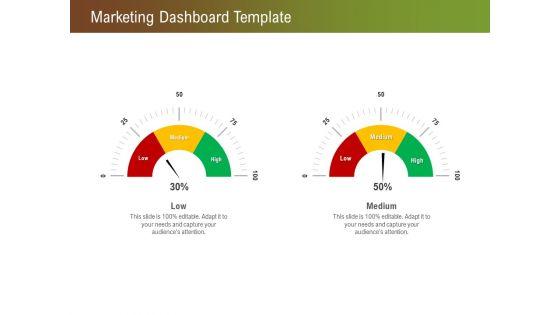
Presenting this set of slides with name steps for successful brand building process marketing dashboard template guidelines pdf. The topics discussed in these slide is marketing dashboard template. This is a completely editable PowerPoint presentation and is available for immediate download. Download now and impress your audience.
Presenting this set of slides with name brand building brand performance dashboard ppt icon diagrams pdf. This is a three stage process. The stages in this process are customer recognition, enhanced sales, competitive edge. This is a completely editable PowerPoint presentation and is available for immediate download. Download now and impress your audience.
Presenting this set of slides with name installing solar plant commercial building solar power plant performance tracking dashboards ideas pdf. The topics discussed in these slides are consumption, solar production, export to grid, import from grid. This is a completely editable PowerPoint presentation and is available for immediate download. Download now and impress your audience.
Presenting this set of slides with name incorporating solar pv commercial building solar power plant performance tracking dashboards pictures pdf. The topics discussed in these slides are consumption, production, values. This is a completely editable PowerPoint presentation and is available for immediate download. Download now and impress your audience.
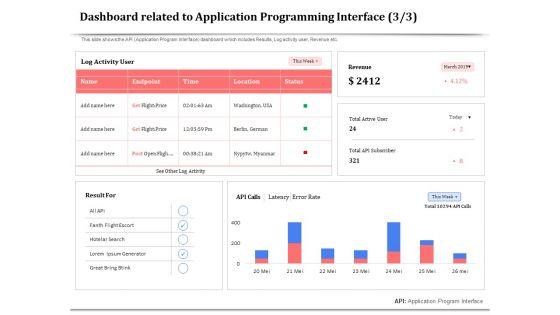
Presenting this set of slides with name api management for building software applications dashboard related to application programming interface guidelines pdf. The topics discussed in these slides are log activity user, revenue, api calls, total api subscriber, total active user. This is a completely editable PowerPoint presentation and is available for immediate download. Download now and impress your audience.
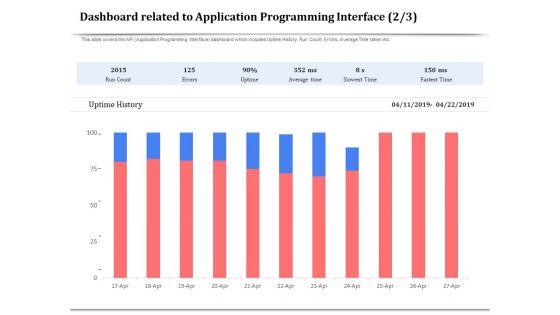

Presenting this set of slides with name api management for building software applications dashboard related to application programming interface time formats pdf. The topics discussed in these slides are uptime history, errors, average time, slowest time, fastest time. This is a completely editable PowerPoint presentation and is available for immediate download. Download now and impress your audience.
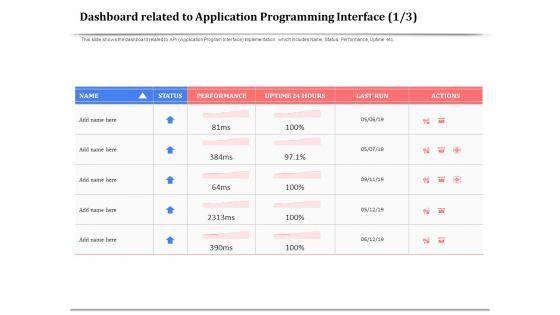
Presenting this set of slides with name api management for building software applications dashboard related to application programming interface actions graphics pdf. The topics discussed in these slides are status, performance, uptime, actions, last run. This is a completely editable PowerPoint presentation and is available for immediate download. Download now and impress your audience.
SHOW
- 60
- 120
- 180
DISPLAYING: 60 of 82 Item(s)
Page