AI PPT Maker
Templates
PPT Bundles
Design Services
Business PPTs
Business Plan
Management
Strategy
Introduction PPT
Roadmap
Self Introduction
Timelines
Process
Marketing
Agenda
Technology
Medical
Startup Business Plan
Cyber Security
Dashboards
SWOT
Proposals
Education
Pitch Deck
Digital Marketing
KPIs
Project Management
Product Management
Artificial Intelligence
Target Market
Communication
Supply Chain
Google Slides
Research Services
 One Pagers
All Categories
Business intelligence dashboard PowerPoint Presentation Templates and Google Slides
SHOW
- 60
- 120
- 180
DISPLAYING: 60 of 62 Item(s)
Page







Slide 1 of 16
Improve your presentation delivery using this Business Intelligence KPI Dashboard Ppt PowerPoint Presentation Complete Deck With Slides. Support your business vision and objectives using this well-structured PPT deck. This template offers a great starting point for delivering beautifully designed presentations on the topic of your choice. Comprising sixteen this professionally designed template is all you need to host discussion and meetings with collaborators. Each slide is self-explanatory and equipped with high-quality graphics that can be adjusted to your needs. Therefore, you will face no difficulty in portraying your desired content using this PPT slideshow. This PowerPoint slideshow contains every important element that you need for a great pitch. It is not only editable but also available for immediate download and utilization. The color, font size, background, shapes everything can be modified to create your unique presentation layout. Therefore, download it now.

Slide 1 of 7
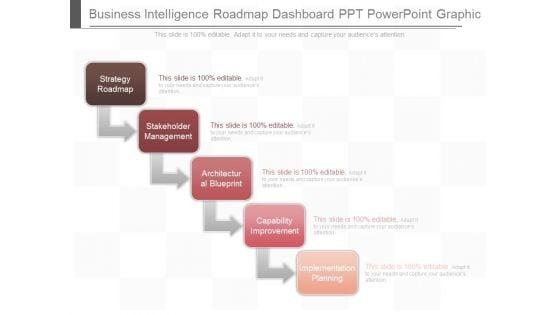
This is a business intelligence roadmap dashboard ppt powerpoint graphic. This is a five stage process. The stages in this process are strategy roadmap, stakeholder management, architectural blueprint, capability improvement, implementation planning.
Slide 1 of 4
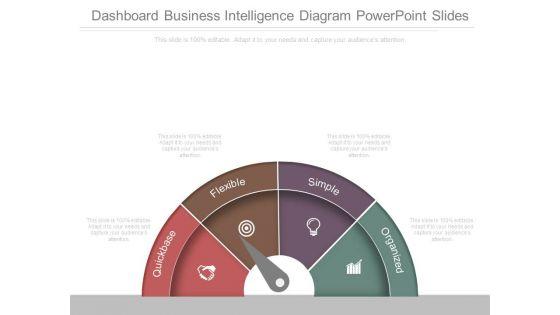
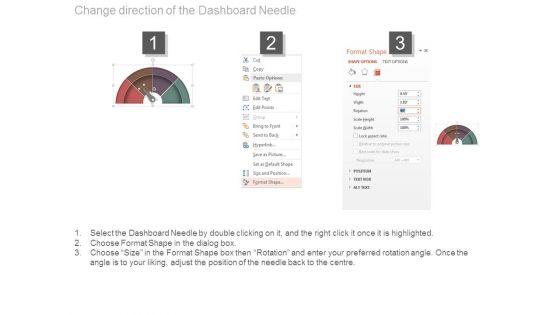
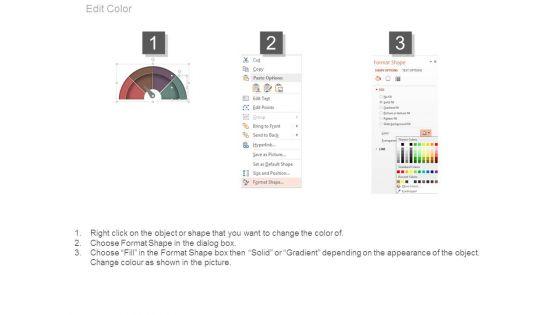
This is a dashboard business intelligence diagram powerpoint slides. This is a four stage process. The stages in this process are quickbase, flexible, simple, organized.


Slide 1 of 4
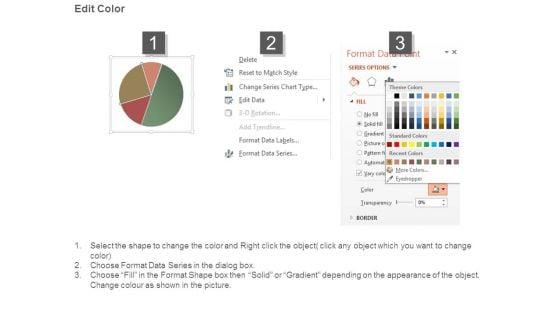
This is a business intelligence performance dashboard ppt powerpoint slides. This is a six stage process. The stages in this process are total revenue, detailed profit of top product line, part capacity allocation, market share, customer satisfaction, quality notification.
Slide 1 of 4
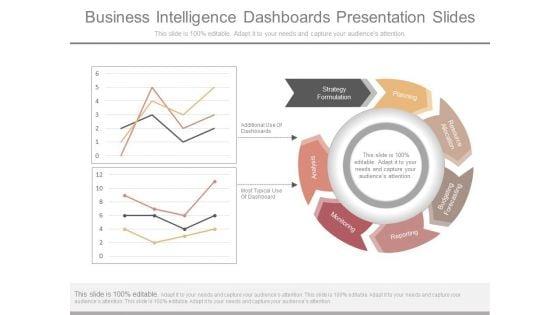
This is a business intelligence dashboards presentation slides. This is a seven stage process. The stages in this process are strategy formulation, planning, resource allocation, budgeting forecasting, reporting, monitoring, analysis, additional use of dashboards, most typical use of dashboard.
Slide 1 of 4
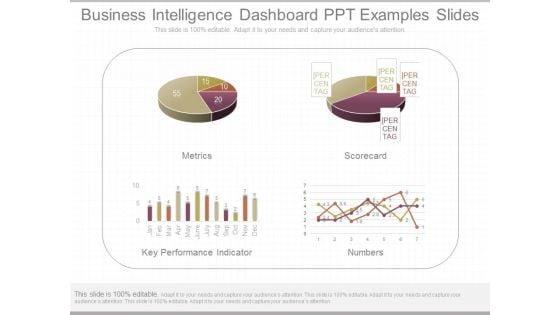
This is a business intelligence dashboard ppt examples slides. This is a four stage process. The stages in this process are metrics, scorecard, key performance indicator, numbers.

Slide 1 of 4
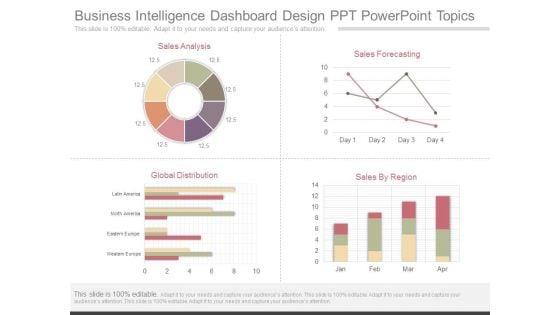
This is a business intelligence dashboard design ppt powerpoint topics. This is a four stage process. The stages in this process are sales analysis, sales forecasting, global distribution, sales by region, latin america, north america, eastern europe, western europe.
Slide 1 of 3
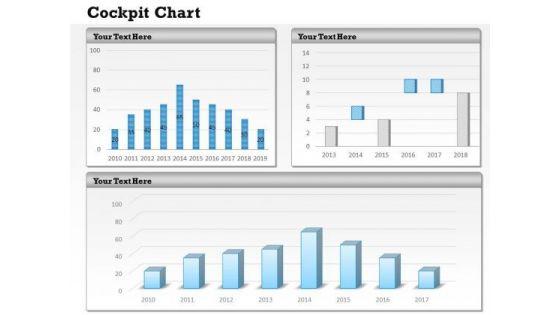
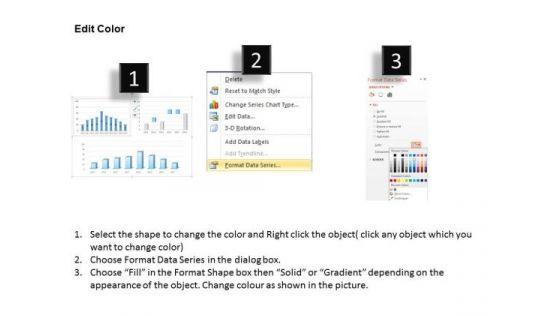
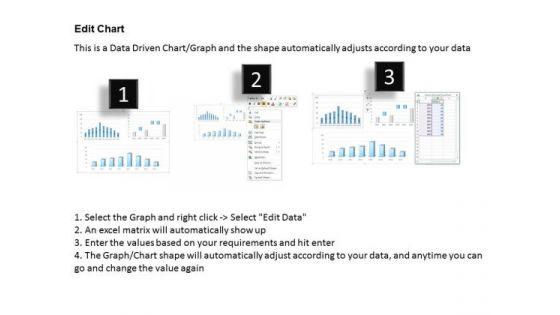
Our Marketing Diagram Business Intelligence Dashboard Design Sales Diagram Powerpoint Templates Team Are A Dogged Lot. They Keep At It Till They Get It Right.
Slide 1 of 2
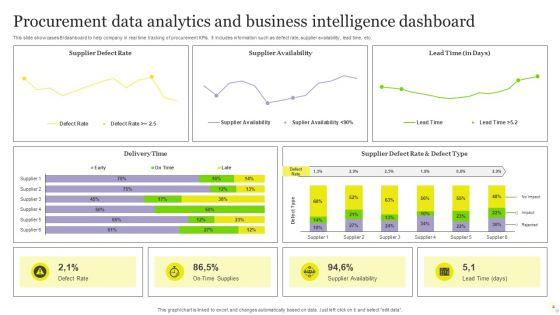
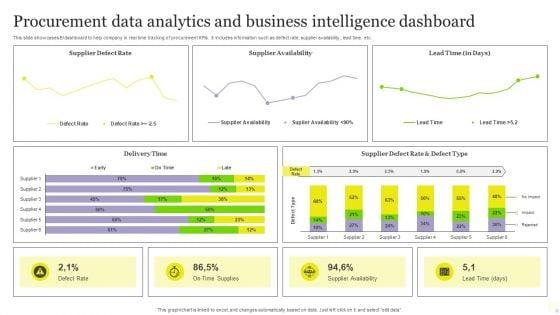
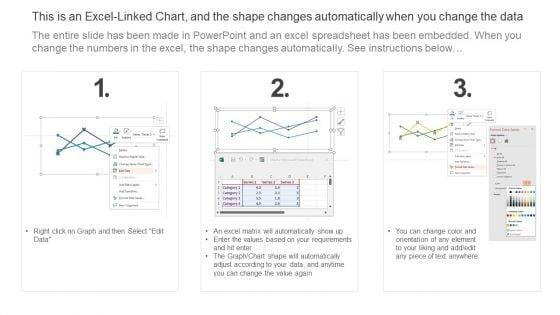
This slide showcases BI dashboard to help company in real time tracking of procurement KPIs. It includes information such as defect rate, supplier availability, lead time, etc. Pitch your topic with ease and precision using this Procurement Data Analytics And Business Intelligence Dashboard Pictures PDF. This layout presents information on Procurement Data Analytics, Business Intelligence Dashboard. It is also available for immediate download and adjustment. So, changes can be made in the color, design, graphics or any other component to create a unique layout.
Slide 1 of 2
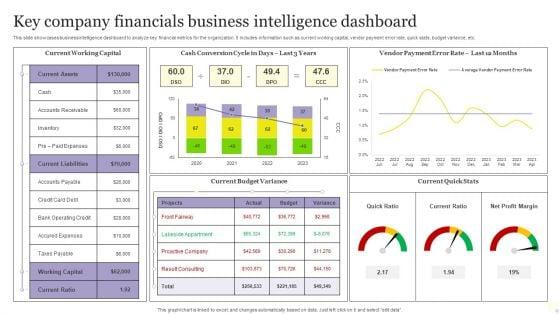
This slide showcases business intelligence dashboard to analyze key financial metrics for the organization. It includes information such as current working capital, vendor payment error rate, quick stats, budget variance, etc. Showcasing this set of slides titled Key Company Financials Business Intelligence Dashboard Graphics PDF. The topics addressed in these templates are Key Company Financials, Business Intelligence Dashboard. All the content presented in this PPT design is completely editable. Download it and make adjustments in color, background, font etc. as per your unique business setting.


Slide 1 of 2
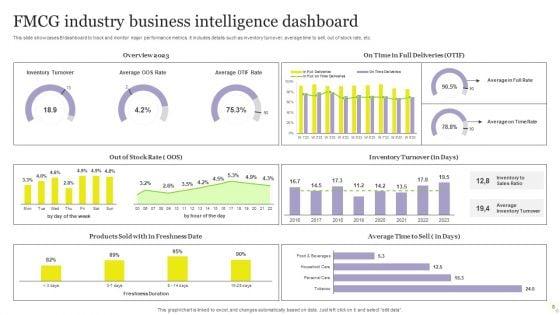
This slide showcases BI dashboard to track and monitor major performance metrics. It includes details such as inventory turnover, average time to sell, out of stock rate, etc. Pitch your topic with ease and precision using this FMCG Industry Business Intelligence Dashboard Mockup PDF. This layout presents information on Average, Inventory Turnover, Business Intelligence Dashboard. It is also available for immediate download and adjustment. So, changes can be made in the color, design, graphics or any other component to create a unique layout.

Slide 1 of 2
This slide displays BI dashboard to monitor financial health and profitability of the company. It includes metrics such as margin, number of stores, average lead time, store locations, etc. Showcasing this set of slides titled Business Intelligence Dashboard To Track Company Sales Rules PDF. The topics addressed in these templates are Business Intelligence Dashboard, Track Company Sales. All the content presented in this PPT design is completely editable. Download it and make adjustments in color, background, font etc. as per your unique business setting.


Slide 1 of 2
This slide showcases business intelligence dashboard to help organization track key performance metrics. It further includes details about top agents, close rate, calls handled, abandon rate, scheduled leads, average speed of answer, etc. Pitch your topic with ease and precision using this Business Intelligence Dashboard To Track Call Center Kpis Download PDF. This layout presents information on Business Intelligence Dashboard, Track Call Center Kpis. It is also available for immediate download and adjustment. So, changes can be made in the color, design, graphics or any other component to create a unique layout.

Slide 1 of 2
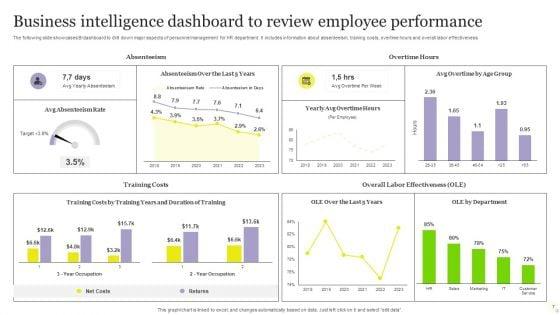
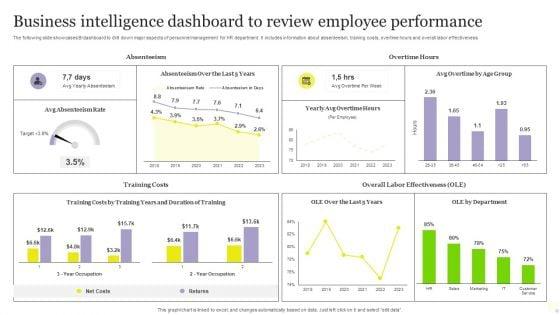
The following slide showcases BI dashboard to drill down major aspects of personnel management for HR department. It includes information about absenteeism, training costs, overtime hours and overall labor effectiveness. Showcasing this set of slides titled Business Intelligence Dashboard To Review Employee Performance Pictures PDF. The topics addressed in these templates are Business Intelligence Dashboard, Review Employee Performance. All the content presented in this PPT design is completely editable. Download it and make adjustments in color, background, font etc. as per your unique business setting.
Slide 1 of 2
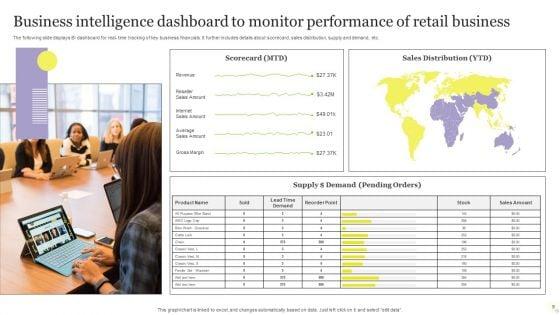
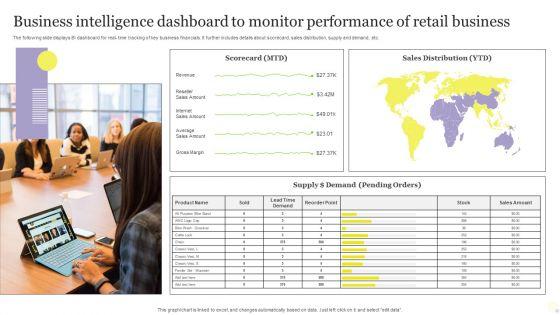
The following slide displays BI dashboard for real time tracking of key business financials. It further includes details about scorecard, sales distribution, supply and demand, etc. Pitch your topic with ease and precision using this Business Intelligence Dashboard To Monitor Performance Of Retail Business Infographics PDF. This layout presents information on Business Intelligence Dashboard, Monitor Performance, Retail Business. It is also available for immediate download and adjustment. So, changes can be made in the color, design, graphics or any other component to create a unique layout.

Slide 1 of 2
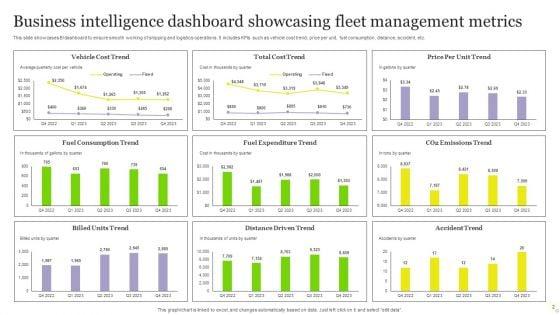
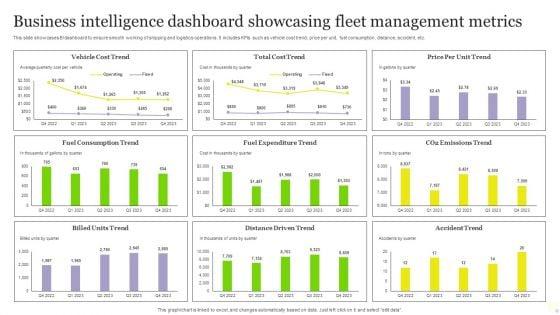
This slide showcases BI dashboard to ensure smooth working of shipping and logistics operations. It includes KPIs such as vehicle cost trend, price per unit, fuel consumption, distance, accident, etc. Showcasing this set of slides titled Business Intelligence Dashboard Showcasing Fleet Management Metrics Elements PDF. The topics addressed in these templates are Cost Trend, Price Per Unit Trend, Vehicle Cost Trend. All the content presented in this PPT design is completely editable. Download it and make adjustments in color, background, font etc. as per your unique business setting.
Slide 1 of 2
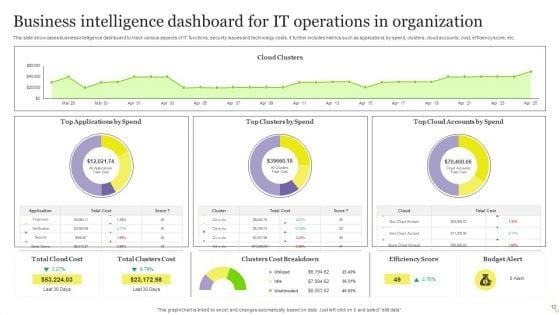
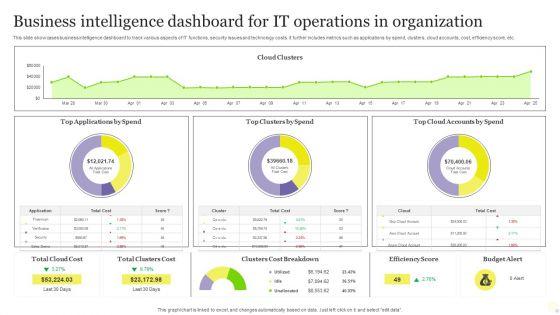
This slide showcases business intelligence dashboard to track various aspects of IT functions, security issues and technology costs. It further includes metrics such as applications by spend, clusters, cloud accounts, cost, efficiency score, etc. Showcasing this set of slides titled Business Intelligence Dashboard For It Operations In Organization Themes PDF. The topics addressed in these templates are Business Intelligence Dashboard, IT Operations, Organization. All the content presented in this PPT design is completely editable. Download it and make adjustments in color, background, font etc. as per your unique business setting.
Slide 1 of 2
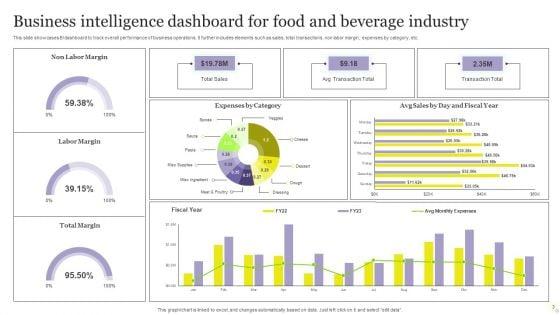
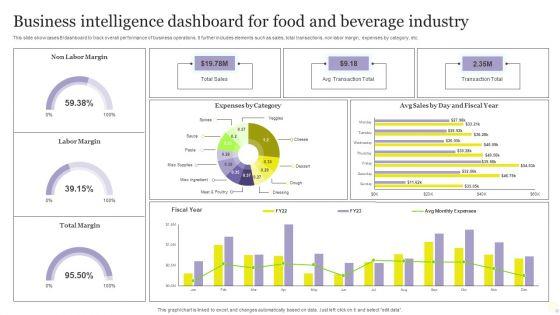
This slide showcases BI dashboard to track overall performance of business operations. It further includes elements such as sales, total transactions, non labor margin, expenses by category, etc. Pitch your topic with ease and precision using this Business Intelligence Dashboard For Food And Beverage Industry Diagrams PDF. This layout presents information on Expenses, Sales, Business Intelligence Dashboard. It is also available for immediate download and adjustment. So, changes can be made in the color, design, graphics or any other component to create a unique layout.

Slide 1 of 2
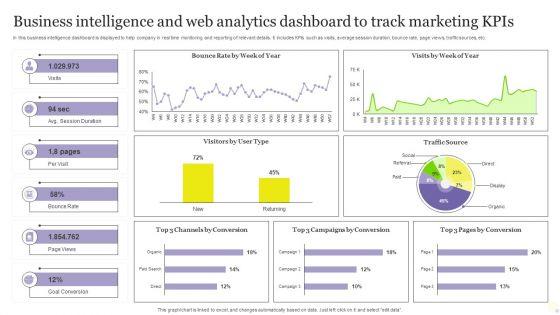
In this business intelligence dashboard is displayed to help company in real time monitoring and reporting of relevant details. It includes KPIs such as visits, average session duration, bounce rate, page views, traffic sources, etc. Showcasing this set of slides titled Business Intelligence And Web Analytics Dashboard To Track Marketing Kpis Inspiration PDF. The topics addressed in these templates are Goal Conversion, Track Marketing Kpis, Web Analytics Dashboard. All the content presented in this PPT design is completely editable. Download it and make adjustments in color, background, font etc. as per your unique business setting.
Slide 1 of 2
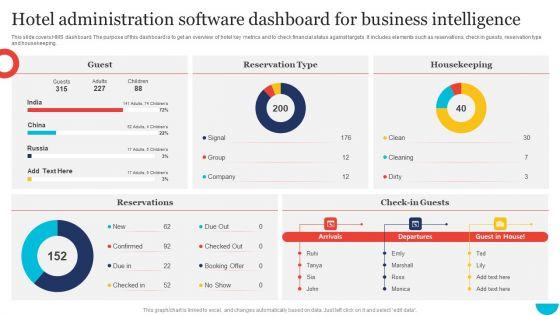
This slide covers HMS dashboard. The purpose of this dashboard is to get an overview of hotel key metrics and to check financial status against targets. It includes elements such as reservations, check in guests, reservation type and housekeeping. Pitch your topic with ease and precision using this Hotel Administration Software Dashboard For Business Intelligence Infographics PDF. This layout presents information on Guest, Housekeeping, Reservation Type. It is also available for immediate download and adjustment. So, changes can be made in the color, design, graphics or any other component to create a unique layout.
Slide 1 of 2
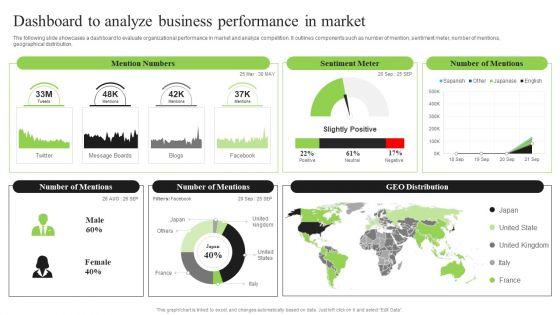
The following slide showcases a dashboard to evaluate organizational performance in market and analyze competition. It outlines components such as number of mention, sentiment meter, number of mentions, geographical distribution. Find a pre designed and impeccable Guidebook For Executing Business Market Intelligence Dashboard To Analyze Business Brochure PDF. The templates can ace your presentation without additional effort. You can download these easy to edit presentation templates to make your presentation stand out from others. So, what are you waiting for Download the template from Slidegeeks today and give a unique touch to your presentation.


Slide 1 of 2
The following slide include dashboard showing data of activities to monitor health of company, department and various processes. It covers active and complete activities, total duration, tasks and participants. Pitch your topic with ease and precision using this Procedure Analytics Data Dashboard With Business Intelligence Slides PDF. This layout presents information on Active Activities, Completed Activities, Active Tasks . It is also available for immediate download and adjustment. So, changes can be made in the color, design, graphics or any other component to create a unique layout.
Slide 1 of 2
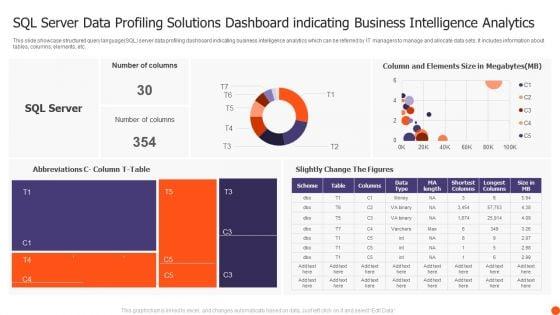
This slide showcase structured query language SQL server data profiling dashboard indicating business intelligence analytics which can be referred by IT managers to manage and allocate data sets. It includes information about tables, columns, elements, etc. Showcasing this set of slides titled SQL Server Data Profiling Solutions Dashboard Indicating Business Intelligence Analytics Structure PDF. The topics addressed in these templates are Number Columns, Slightly Change Figures, SQL Server. All the content presented in this PPT design is completely editable. Download it and make adjustments in color, background, font etc. as per your unique business setting.
Slide 1 of 2
This slide covers the digital marketing dashboard along with the lead breakdown, google analytics traffic, and social media channels.Deliver and pitch your topic in the best possible manner with this Digital Media Tracking Dashboard Deploying Artificial Intelligence In Business Portrait PDF. Use them to share invaluable insights on Digital Media, Tracking Dashboard and impress your audience. This template can be altered and modified as per your expectations. So, grab it now.
Slide 1 of 2
Mentioned slide portrays KPI dashboard that can be used by organizations to measure their business performance post AI introduction. KPIS covered here are progress, Before versus After AI Implementation, risks issues.Deliver an awe inspiring pitch with this creative Artificial Intelligence For IT Operations Playbook KPI Dashboard For Tracking Business Performance Slides PDF bundle. Topics like Kpi Dashboard, Tracking Business, Performance can be discussed with this completely editable template. It is available for immediate download depending on the needs and requirements of the user.
Slide 1 of 2
This slide portrays information regarding tracking essential activities in intelligence infrastructure dashboard in terms of IT operations, security, business analytics, internet of things, etc. Deliver an awe inspiring pitch with this creative Developing Business Analytics Framework Tracking Intelligence Infrastructure Activities Dashboard Brochure PDF bundle. Topics like Application Delivery, Business Analytics, Internet Of Things can be discussed with this completely editable template. It is available for immediate download depending on the needs and requirements of the user.
Slide 1 of 2
Mentioned slide portrays KPI dashboard that can be used by organizations to measure their business performance post AI introduction. KPIS covered here are progress, Before versus After AI Implementation, risks and issues. Deliver an awe inspiring pitch with this creative artificial intelligence playbook kpi dashboard for tracking business performance formats pdf bundle. Topics like performance kpis, progress, risk and issues can be discussed with this completely editable template. It is available for immediate download depending on the needs and requirements of the user.
Slide 1 of 2
Mentioned slide portrays KPI dashboard that can be used by organizations to measure their business performance post AI introduction. KPIS covered here are progress, Before versus After AI Implementation, risks and issues. Deliver an awe inspiring pitch with this creative artificial intelligence transformation playbook kpi dashboard for tracking business performance designs pdf bundle. Topics like risk and issues, progress, performance kpis, before versus after all implementation can be discussed with this completely editable template. It is available for immediate download depending on the needs and requirements of the user.
Slide 1 of 2
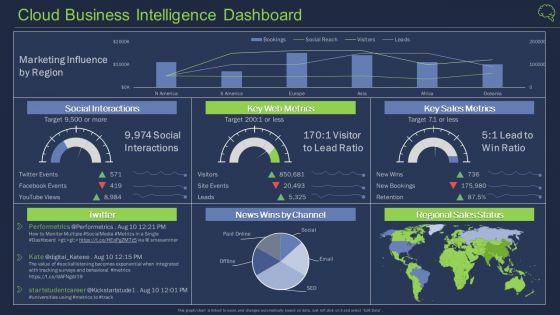
Deliver and pitch your topic in the best possible manner with this cloud business intelligence dashboard ppt outline display pdf. Use them to share invaluable insights on social interactions, sales metrics, sales and impress your audience. This template can be altered and modified as per your expectations. So, grab it now.

Slide 1 of 2
Deliver an awe inspiring pitch with this creative cloud business intelligence dashboard microsoft pdf bundle. Topics like social interactions, key web metrics, regional sales status can be discussed with this completely editable template. It is available for immediate download depending on the needs and requirements of the user.


Slide 1 of 2
Deliver an awe inspiring pitch with this creative cloud intelligence framework for application consumption cloud business intelligence dashboard slides pdf bundle. Topics like social interactions, key web metrics, key sales metrics, marketing influence by region can be discussed with this completely editable template. It is available for immediate download depending on the needs and requirements of the user.


Slide 1 of 2
Deliver an awe inspiring pitch with this creative data assimilation business intelligence kpi dashboard sky ppt background images pdf bundle. Topics like expenses, working capital, checking savings, revenues, assets can be discussed with this completely editable template. It is available for immediate download depending on the needs and requirements of the user.

Slide 1 of 2
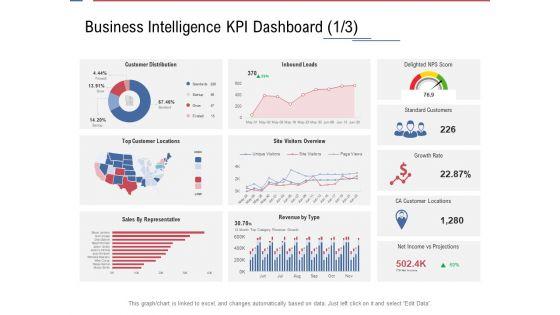
Deliver and pitch your topic in the best possible manner with this data assimilation business intelligence kpi dashboard score ppt graphics pdf. Use them to share invaluable insights on revenue, projections, locations, growth, sales and impress your audience. This template can be altered and modified as per your expectations. So, grab it now.

Slide 1 of 2
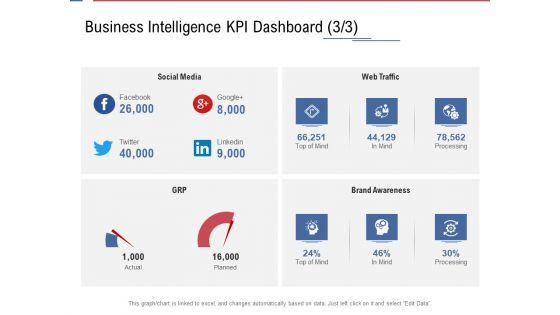
Deliver an awe inspiring pitch with this creative data assimilation business intelligence kpi dashboard media ppt layouts show pdf bundle. Topics like business intelligence kpi dashboard can be discussed with this completely editable template. It is available for immediate download depending on the needs and requirements of the user.
Slide 1 of 2
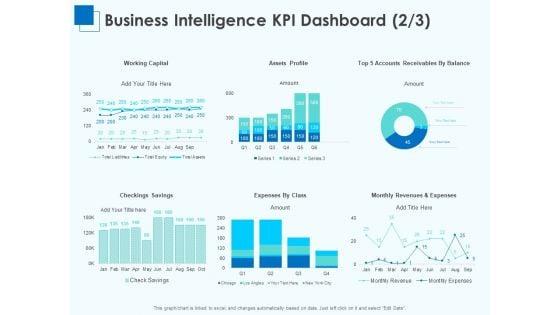
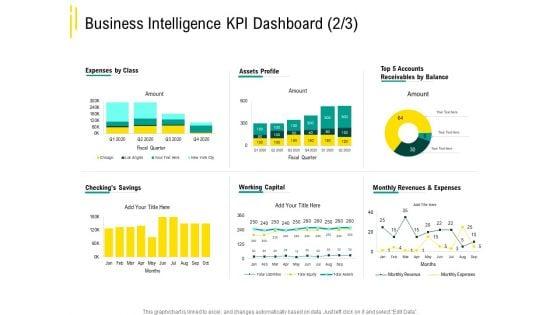
Deliver an awe-inspiring pitch with this creative corporate intelligence business analysis business intelligence kpi dashboard profile rules pdf bundle. Topics like working capital, assets profile, revenues and expenses, checkings savings can be discussed with this completely editable template. It is available for immediate download depending on the needs and requirements of the user.
Slide 1 of 2
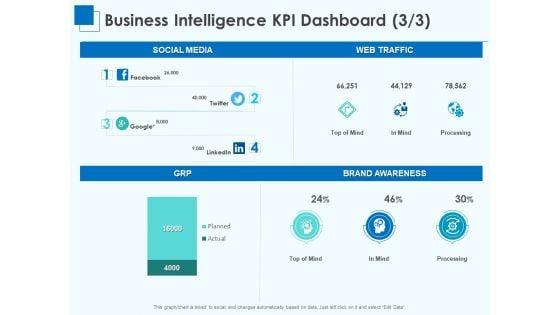
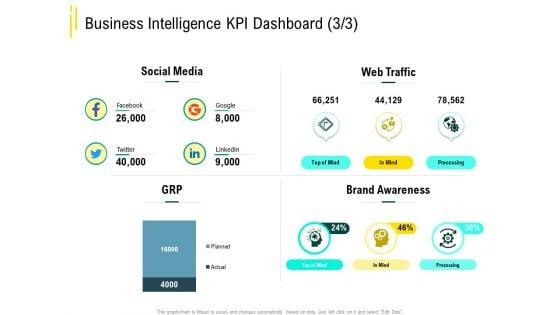
Deliver and pitch your topic in the best possible manner with this corporate intelligence business analysis business intelligence kpi dashboard media download pdf. Use them to share invaluable insights on social media, web traffic, brand awareness and impress your audience. This template can be altered and modified as per your expectations. So, grab it now.
Slide 1 of 2
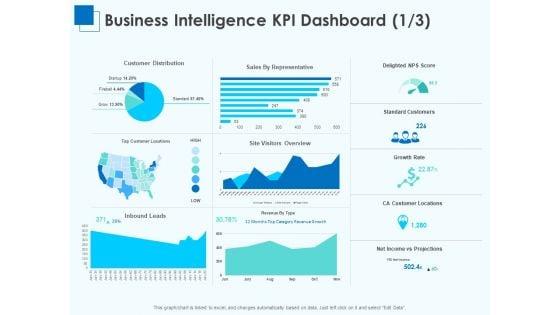
Deliver an awe-inspiring pitch with this creative corporate intelligence business analysis business intelligence kpi dashboard leads ideas pdf bundle. Topics like inbound leads, growth rate, standard customers, customer distribution, customer locations can be discussed with this completely editable template. It is available for immediate download depending on the needs and requirements of the user.

Slide 1 of 2
Deliver an awe inspiring pitch with this creative expert systems business intelligence kpi dashboard working formats pdf bundle. Topics like checking s savings, working capital can be discussed with this completely editable template. It is available for immediate download depending on the needs and requirements of the user.

Slide 1 of 2
Deliver and pitch your topic in the best possible manner with this expert systems business intelligence kpi dashboard standard diagrams pdf. Use them to share invaluable insights on delighted nps score, standard customers, growth rate, locations and impress your audience. This template can be altered and modified as per your expectations. So, grab it now.
Slide 1 of 2
Deliver an awe inspiring pitch with this creative expert systems business intelligence kpi dashboard social media themes pdf bundle. Topics like traffic, brand awareness, processing, social media can be discussed with this completely editable template. It is available for immediate download depending on the needs and requirements of the user.

Slide 1 of 2
Presenting this set of slides with name enterprise problem solving and intellect business intelligence kpi dashboard profile ppt powerpoint presentation summary structure pdf. The topics discussed in these slides are expenses class, top 5 accounts receivables balance, assets profile, working capital, checking savings, monthly revenues and expenses. This is a completely editable PowerPoint presentation and is available for immediate download. Download now and impress your audience.


Slide 1 of 2
Presenting this set of slides with name enterprise problem solving and intellect business intelligence kpi dashboard processing ppt powerpoint presentation show outfit pdf. The topics discussed in these slides are social media, web traffic, brand awareness, mind, processing. This is a completely editable PowerPoint presentation and is available for immediate download. Download now and impress your audience.

Slide 1 of 2
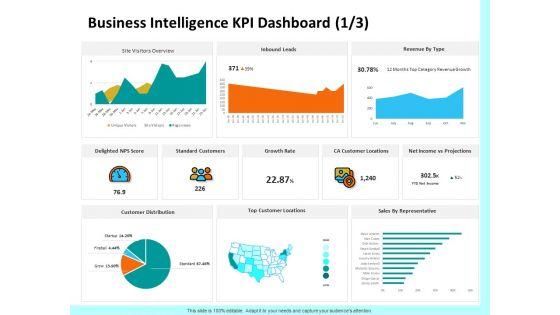
Presenting this set of slides with name enterprise problem solving and intellect business intelligence kpi dashboard growth ppt powerpoint presentation model images pdf. The topics discussed in these slides are sales representative, delighted nps score, standard customers, growth rate, ca customer locations, net income vs projections, revenue type, top customer locations, customer distribution. This is a completely editable PowerPoint presentation and is available for immediate download. Download now and impress your audience.
Slide 1 of 2
Presenting this set of slides with name firm productivity administration business intelligence kpi dashboard score ppt powerpoint presentation infographic template display pdf. The topics discussed in these slides are sales representative, delighted nps score, standard customers, growth rate, ca customer locations, net income vs projections, revenue type, top customer locations, customer distribution. This is a completely editable PowerPoint presentation and is available for immediate download. Download now and impress your audience.


Slide 1 of 2
Presenting this set of slides with name firm productivity administration business intelligence kpi dashboard mind ppt powerpoint presentation outline graphics pdf. This is a four stage process. The stages in this process are social media, web traffic, grp, brand awareness, mind, processing. This is a completely editable PowerPoint presentation and is available for immediate download. Download now and impress your audience.


Slide 1 of 2
Presenting this set of slides with name firm productivity administration business intelligence kpi dashboard assets ppt powerpoint presentation slides background designs pdf. The topics discussed in these slides are expenses class, top 5 accounts receivables balance, assets profile, working capital, checking savings, monthly revenues and expenses. This is a completely editable PowerPoint presentation and is available for immediate download. Download now and impress your audience.

Slide 1 of 2
Presenting this set of slides with name facts assessment business intelligence kpi dashboard expenses ppt powerpoint presentation layouts background images pdf. The topics discussed in these slides are sales representative, delighted nps score, standard customers, growth rate, ca customer locations, net income vs projections, revenue type, top customer locations, customer distribution. This is a completely editable PowerPoint presentation and is available for immediate download. Download now and impress your audience.

Slide 1 of 2
Presenting this set of slides with name facts assessment business intelligence kpi dashboard assets ppt powerpoint presentation slides show pdf. The topics discussed in these slides are expenses class, top 5 accounts receivables balance, assets profile, working capital, checking savings, monthly revenues and expenses. This is a completely editable PowerPoint presentation and is available for immediate download. Download now and impress your audience.
Slide 1 of 2
Presenting this set of slides with name business intelligence and analytics dashboard ppt powerpoint presentation icon example topics pdf. The topics discussed in these slides are geographic distribution of total revenue, top 5 product by total revenue, measuring running by total revenue, how close are we to tour planned total revenue. This is a completely editable PowerPoint presentation and is available for immediate download. Download now and impress your audience.

Slide 1 of 2
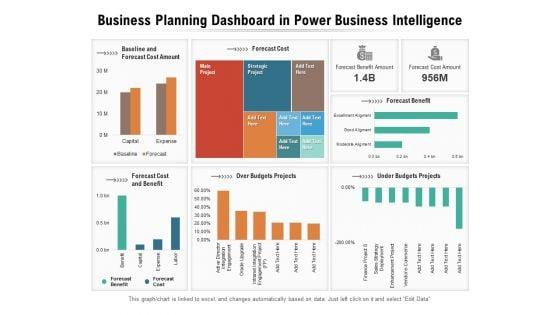
Presenting this set of slides with name business planning dashboard in power business intelligence ppt powerpoint presentation file format ideas pdf. The topics discussed in these slides are cost, budgets, finance. This is a completely editable PowerPoint presentation and is available for immediate download. Download now and impress your audience.
Slide 1 of 2
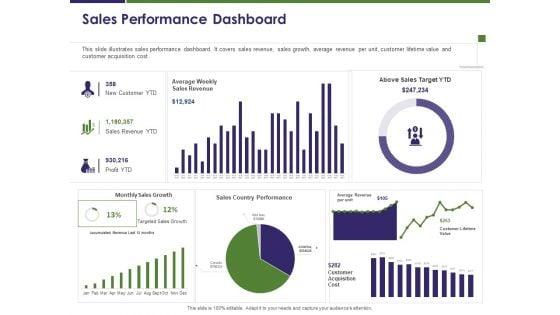
Presenting this set of slides with name business intelligence report sales performance dashboard ppt infographic template examples pdf. The topics discussed in these slides are new customer, sales revenue, profit, sales target, targeted sales growth. This is a completely editable PowerPoint presentation and is available for immediate download. Download now and impress your audience.

Slide 1 of 2
Presenting this set of slides with name business intelligence report customer satisfaction dashboard ppt infographics templates pdf. The topics discussed in these slides are quality, pricing, design, service. This is a completely editable PowerPoint presentation and is available for immediate download. Download now and impress your audience.


Slide 1 of 9
Persuade your audience using this Business Intelligence Dashboard Icon To Track Kpis Pictures PDF. This PPT design covers three stages, thus making it a great tool to use. It also caters to a variety of topics including Business Intelligence, Dashboard Icon, Track Kpis. Download this PPT design now to present a convincing pitch that not only emphasizes the topic but also showcases your presentation skills.


Slide 1 of 9
Persuade your audience using this Business Intelligence Dashboard Icon To Analyze Industry Trends Topics PDF. This PPT design covers three stages, thus making it a great tool to use. It also caters to a variety of topics including Business Intelligence Dashboard Icon, Analyze Industry Trends. Download this PPT design now to present a convincing pitch that not only emphasizes the topic but also showcases your presentation skills.


Slide 1 of 9
Persuade your audience using this Business Intelligence Dashboard Icon For Data Analysis And Visualization Information PDF. This PPT design covers three stages, thus making it a great tool to use. It also caters to a variety of topics including Business Intelligence Dashboard Icon, Data Analysis And Visualization. Download this PPT design now to present a convincing pitch that not only emphasizes the topic but also showcases your presentation skills.


Slide 1 of 9
This slide includes tips to enhance the overall user experience while making SAP analytics cloud dashboards. It includes tips such as utilize semantic and industry-specific colours, keep visualization clear, group related data, etc. Presenting Best Practices To Create SAP Cloud Based Business Intelligence Platform Dashboards Summary PDF to dispense important information. This template comprises four stages. It also presents valuable insights into the topics including Utilize Semantic Industry Specific, Keep Visualizations Clear, Group Related Data. This is a completely customizable PowerPoint theme that can be put to use immediately. So, download it and address the topic impactfully.


Slide 1 of 9
Deliver and pitch your topic in the best possible manner with this cloud business intelligence dashboard graphics pdf. Use them to share invaluable insights on social interactions, key web metrics, key sales metrics and impress your audience. This template can be altered and modified as per your expectations. So, grab it now.


Slide 1 of 9
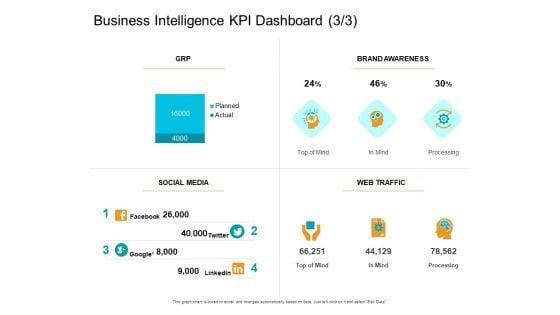
Presenting this set of slides with name facts assessment business intelligence kpi dashboard processing ppt powerpoint presentation summary graphics template pdf. This is a one stage process. The stages in this process are brand awareness, web traffic, social media, grp, mind, processing. This is a completely editable PowerPoint presentation and is available for immediate download. Download now and impress your audience.
Slide 1 of 2
This slide covers the key performance tracking dashboard of an organization prepared with the help of BI software. It includes key metrics such as data exchange trend, department distribution, data sampling etc. Slidegeeks is one of the best resources for PowerPoint templates. You can download easily and regulate Overview Of BI For Enhanced Decision Making Business Intelligence Key Metrics Dashboard Icons PDF for your personal presentations from our wonderful collection. A few clicks is all it takes to discover and get the most relevant and appropriate templates. Use our Templates to add a unique zing and appeal to your presentation and meetings. All the slides are easy to edit and you can use them even for advertisement purposes.


Slide 1 of 10
This slide presents a customer segmentation dashboard for reporting real time data. It includes key components such as delighted NPS score, standard customers, growth rate, CA customer location, net income vs. projection, customer distribution, etc. Pitch your topic with ease and precision using this Consumer Segmentation Dashboard For Business Intelligence Reporting Topics Pdf. This layout presents information on Consumer Segmentation Dashboard, Business Intelligence Reporting, Growth Rate. It is also available for immediate download and adjustment. So, changes can be made in the color, design, graphics or any other component to create a unique layout. This slide presents a customer segmentation dashboard for reporting real time data. It includes key components such as delighted NPS score, standard customers, growth rate, CA customer location, net income vs. projection, customer distribution, etc.
SHOW
- 60
- 120
- 180
DISPLAYING: 60 of 62 Item(s)
Page
