- Sign up
- Sign In
 AI PPT Maker
 Templates
 PPT Bundles
 Design Services
 Business PPTs
 Business Plan
 Management
 Strategy
 Introduction PPT
 Roadmap
 Self Introduction
 Timelines
 Process
 Marketing
 Agenda
 Technology
 Medical
 Startup Business Plan
 Cyber Security
 Dashboards
 SWOT
SWOT Proposals
 Education
 Pitch Deck
 Digital Marketing
 KPIs
KPIs Project Management
 Product Management
 Artificial Intelligence
 Target Market
 Communication
 Supply Chain
 Google Slides
 Research Services
 One Pagers
 All Categories
Businesses dashboards PowerPoint Presentation Templates and Google Slides
SHOW
- 60
- 120
- 180
DISPLAYING: 60 of 866 Item(s)
Page


Improve your presentation delivery using this Business Intelligence KPI Dashboard Ppt PowerPoint Presentation Complete Deck With Slides. Support your business vision and objectives using this well-structured PPT deck. This template offers a great starting point for delivering beautifully designed presentations on the topic of your choice. Comprising sixteen this professionally designed template is all you need to host discussion and meetings with collaborators. Each slide is self-explanatory and equipped with high-quality graphics that can be adjusted to your needs. Therefore, you will face no difficulty in portraying your desired content using this PPT slideshow. This PowerPoint slideshow contains every important element that you need for a great pitch. It is not only editable but also available for immediate download and utilization. The color, font size, background, shapes everything can be modified to create your unique presentation layout. Therefore, download it now.

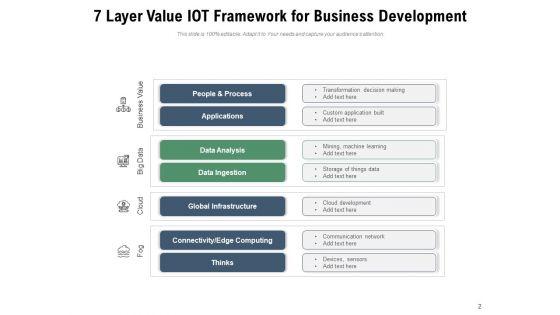
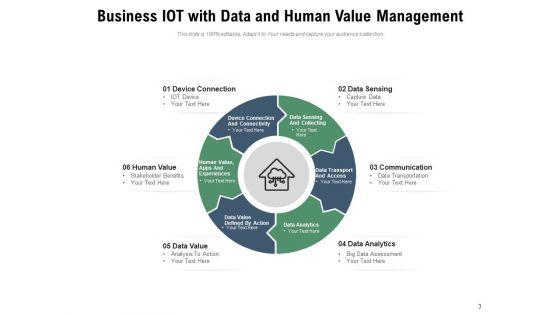
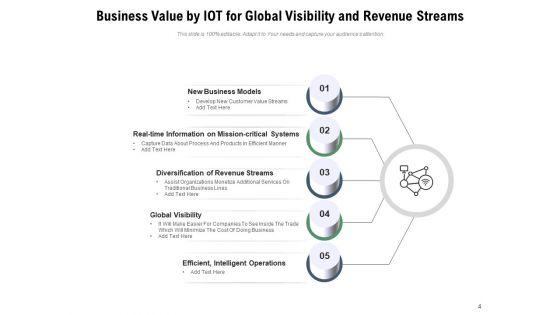


Improve your presentation delivery using this driving business value with internet of things dashboard ppt powerpoint presentation complete deck. Support your business vision and objectives using this well-structured PPT deck. This template offers a great starting point for delivering beautifully designed presentations on the topic of your choice. Comprising twelve slides this professionally designed template is all you need to host discussion and meetings with collaborators. Each slide is self-explanatory and equipped with high-quality graphics that can be adjusted to your needs. Therefore, you will face no difficulty in portraying your desired content using this PPT slideshow. This PowerPoint slideshow contains every important element that you need for a great pitch. It is not only editable but also available for immediate download and utilization. The color, font size, background, shapes everything can be modified to create your unique presentation layout. Therefore, download it now.


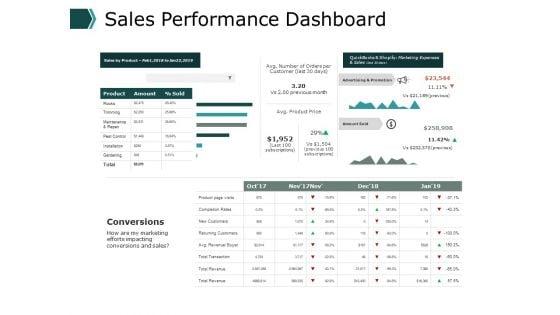


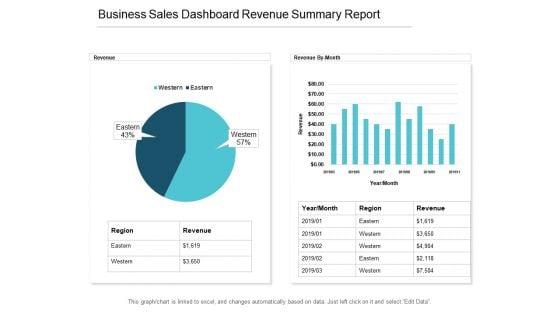


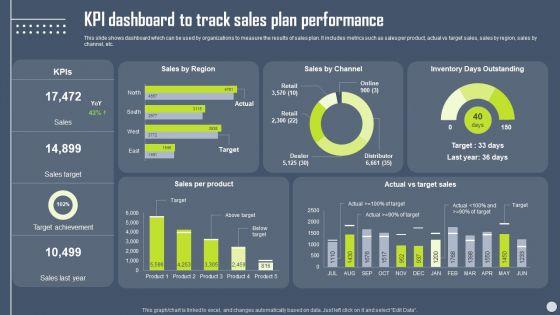
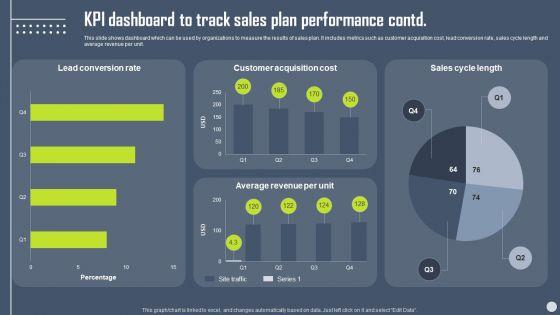
This slide shows dashboard which can be used by organizations to measure the results of sales plan. It includes metrics such as sales per product, actual vs target sales, sales by region, sales by channel, etc. Boost your pitch with our creative Boosting Yearly Business Revenue KPI Dashboard To Track Sales Plan Performance Topics PDF. Deliver an awe-inspiring pitch that will mesmerize everyone. Using these presentation templates you will surely catch everyones attention. You can browse the ppts collection on our website. We have researchers who are experts at creating the right content for the templates. So you dont have to invest time in any additional work. Just grab the template now and use them.
This slide provides information regarding activities tracking dashboard for umbrella brand in terms of customer retention, market share, etc. If you are looking for a format to display your unique thoughts, then the professionally designed Efficient Administration Of Product Business And Umbrella Branding Activity Tracking Dashboard For Umbrella Brand Icons PDF is the one for you. You can use it as a Google Slides template or a PowerPoint template. Incorporate impressive visuals, symbols, images, and other charts. Modify or reorganize the text boxes as you desire. Experiment with shade schemes and font pairings. Alter, share or cooperate with other people on your work. Download Efficient Administration Of Product Business And Umbrella Branding Activity Tracking Dashboard For Umbrella Brand Icons PDF and find out how to give a successful presentation. Present a perfect display to your team and make your presentation unforgettable.
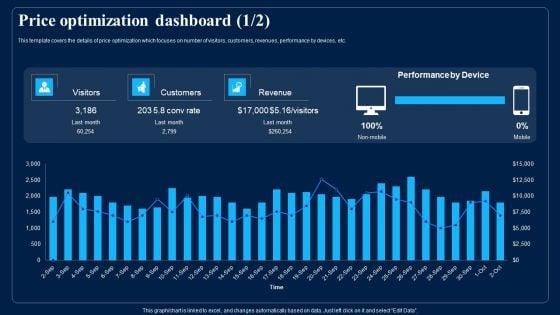
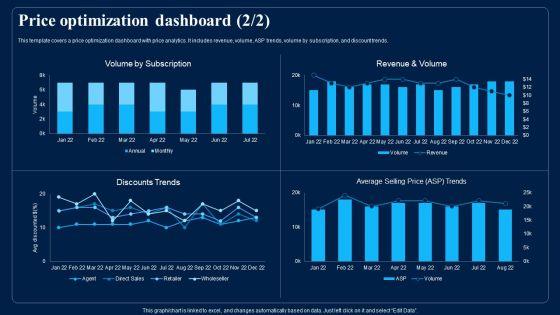

This template covers the details of price optimization which focuses on number of visitors, customers, revenues, performance by devices, etc. Deliver an awe inspiring pitch with this creative Identifying Optimum Pricing Methods For Business Price Optimization Dashboard Professional PDF bundle. Topics like Revenue, Customers, Performance By Device can be discussed with this completely editable template. It is available for immediate download depending on the needs and requirements of the user.
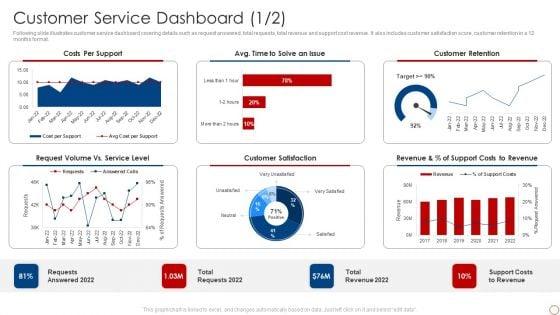
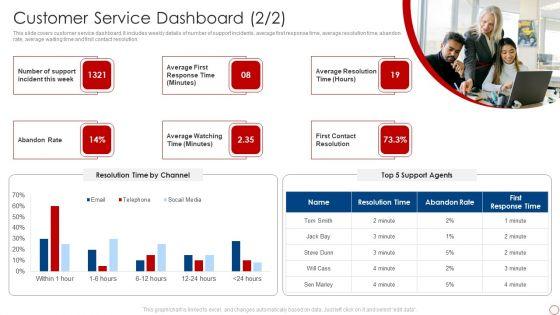
Following slide illustrates customer service dashboard covering details such as request answered, total requests, total revenue and support cost revenue. It also includes customer satisfaction score, customer retention in a 12 months format. Deliver and pitch your topic in the best possible manner with this Kpis For Evaluating Business Sustainability Customer Service Dashboard Designs PDF. Use them to share invaluable insights on Costs Per Support, Customer Retention, Customer Satisfaction and impress your audience. This template can be altered and modified as per your expectations. So, grab it now.
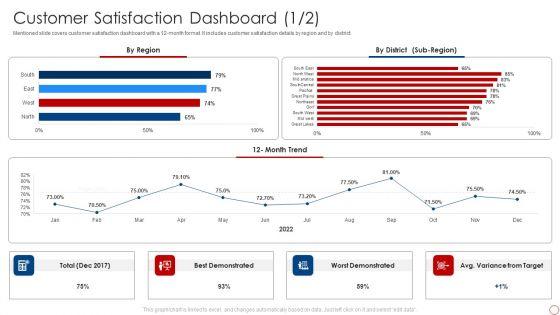


Mentioned slide covers customer satisfaction dashboard with a 12-month format. It includes customer satisfaction details by region and by district. Deliver an awe inspiring pitch with this creative Kpis For Evaluating Business Sustainability Customer Satisfaction Dashboard Clipart PDF bundle. Topics like Best Demonstrated, Worst Demonstrated, 12 Month Trend can be discussed with this completely editable template. It is available for immediate download depending on the needs and requirements of the user.


Following slide covers cash flow dashboard covering details like beginning cash on hand, cash going in, cash going out, profit or loss and ending cash on hand. It also includes detail of accounts receivable and payable. Deliver an awe inspiring pitch with this creative Kpis For Evaluating Business Sustainability Cash Flow Dashboard Background PDF bundle. Topics like Accounts Receivable, Accounts Payable, Cash Flow can be discussed with this completely editable template. It is available for immediate download depending on the needs and requirements of the user.


Following slide illustrates customer service dashboard covering details such as request answered, total requests, total revenue and support cost revenue. It also includes customer satisfaction score, customer retention in a 12 months format. Deliver and pitch your topic in the best possible manner with this Metrics To Measure Business Performance Customer Service Dashboard Sample PDF. Use them to share invaluable insights on Requests Answered 2022, Total Requests 2022, Total Revenue 2022 and impress your audience. This template can be altered and modified as per your expectations. So, grab it now.
SHOW
- 60
- 120
- 180
DISPLAYING: 60 of 866 Item(s)
Page