 AI PPT Maker
 Templates
 PPT Bundles
 Design Services
 Business PPTs
 Business Plan
 Management
 Strategy
 Introduction PPT
 Roadmap
 Self Introduction
 Timelines
 Process
 Marketing
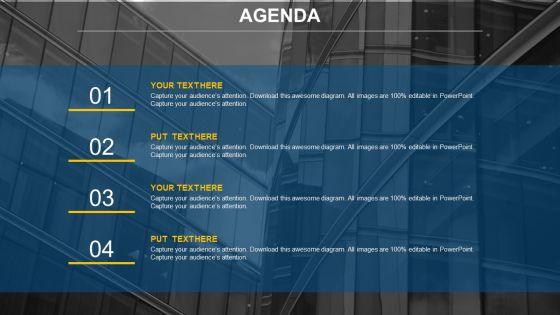
 Agenda
 Technology
 Medical
 Startup Business Plan
 Cyber Security
 Dashboards
 SWOT
SWOT Proposals
 Education
 Pitch Deck
 Digital Marketing
 KPIs
KPIs Project Management
 Product Management
 Artificial Intelligence
 Target Market
 Communication
 Supply Chain
 Google Slides
 Research Services
 One Pagers
 All Categories
Business-charts PowerPoint Presentation Templates and Google Slides
SHOW
- 60
- 120
- 180
DISPLAYING: 60 of 702 Item(s)
Page


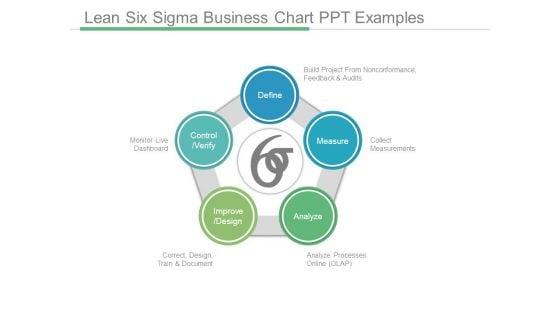


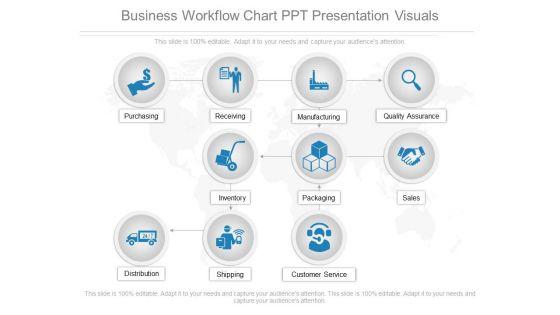
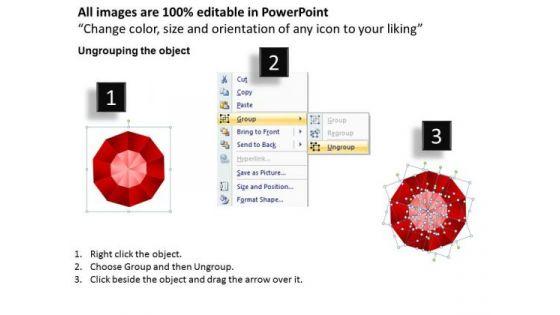
This is a lean six sigma business chart ppt examples. This is a five stage process. The stages in this process are define build project from nonconformance feedback and audits, measure collect measurements, analyze processes online olap, improve design correct design train and document, control verify monitor live dashboard.


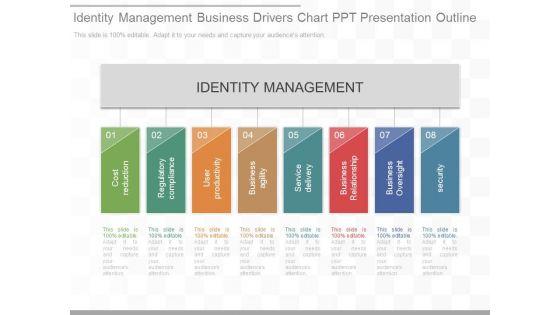


This is a identity management business drivers chart ppt presentation outline. This is a eight stage process. The stages in this process are identity management, cost reduction, regulatory compliance, user productivity, business agility, service delivery, business relationship, business oversight, security.


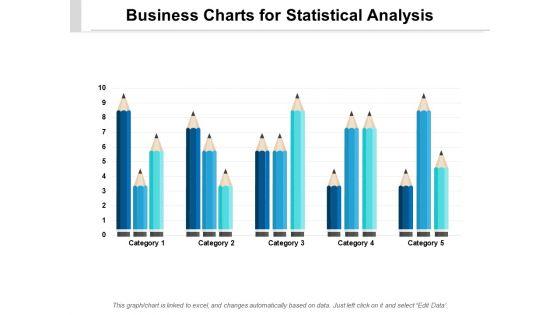


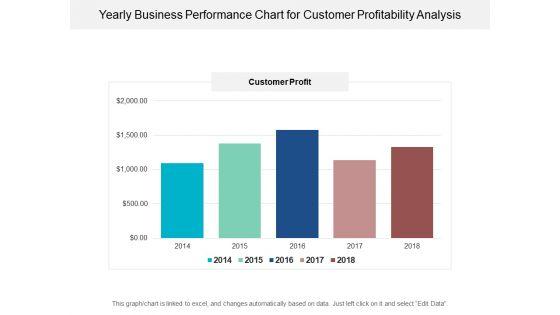
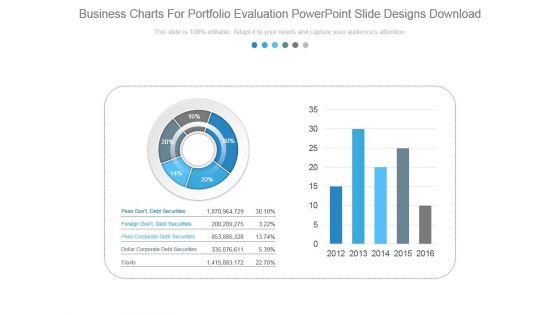
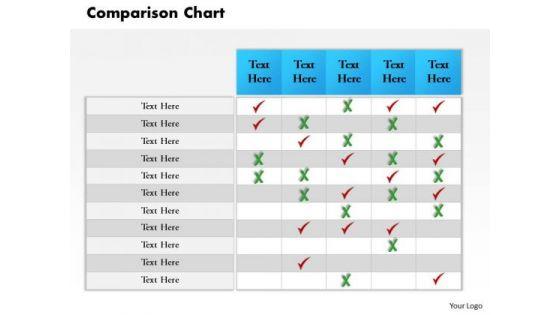
Presenting this set of slides with name business charts for statistical analysis ppt powerpoint presentation pictures gridlines. The topics discussed in these slides are education, growth, pencil bar graph. This is a completely editable PowerPoint presentation and is available for immediate download. Download now and impress your audience.


Presenting this set of slides with name business charts ppt powerpoint presentation icon outfit cpb. This is an editable Powerpoint eight stages graphic that deals with topics like business charts to help convey your message better graphically. This product is a premium product available for immediate download and is 100 percent editable in Powerpoint. Download this now and use it in your presentations to impress your audience.
Presenting this set of slides with name five steps business growth chart with icons ppt powerpoint presentation model sample. This is a five stage process. The stages in this process are education, growth, pencil bar graph. This is a completely editable PowerPoint presentation and is available for immediate download. Download now and impress your audience.


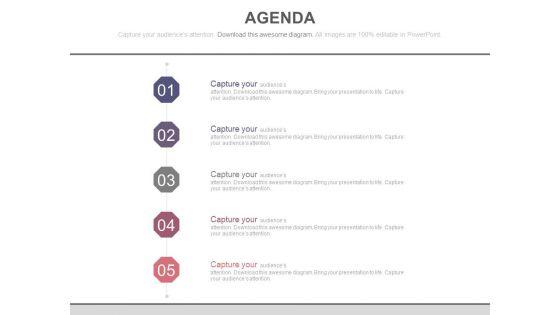
Create visually stunning and define your PPT presentations in a unique and inspiring manner using our above template. It contains five steps business agenda chart. This business agenda helps to provide guidelines as to what needs to be discussed and take place. The structure of our template allows you to effectively highlight the key issues concerning to your agenda.


This image slide displays charts on smartphone with modern info graphic. This image slide depicts info graphic. Use this PowerPoint template, in your presentations to express various business views on achievements and targets or population related presentations. This image slide will help you reach the target audience.


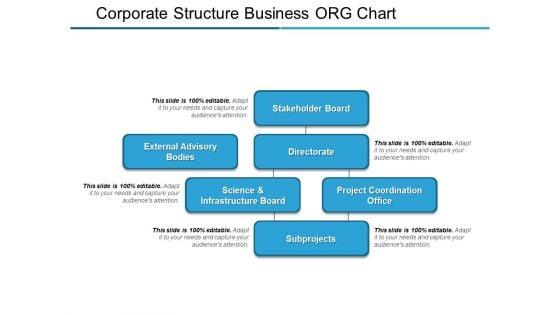
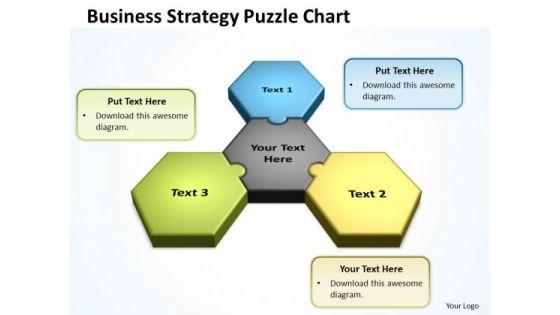
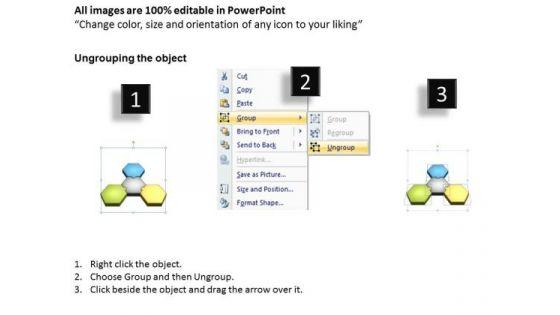
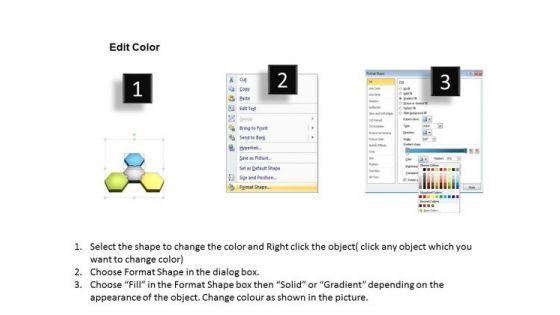
This business diagram is useful for business presentation that can incorporate the strategies that you need in order to include the details as well as the organization structure. This fabulous diagram transforms your boring, sleep-inducing presentations into an aggressive, professional, energetic PowerPoint presentation.

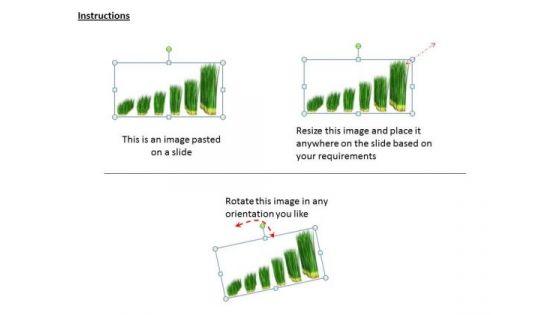
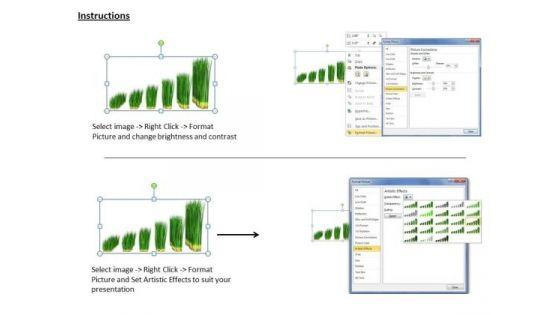
This PowerPoint slide display chart created with green grass. This image slide has been crafted with graphic of green grass bar graph. This image depicts business. Use this image slide to express views on targets, goals, growth and management in your presentations. This image slide exhibits various information which requires visual aid. Enhance the quality of your presentations using this image.
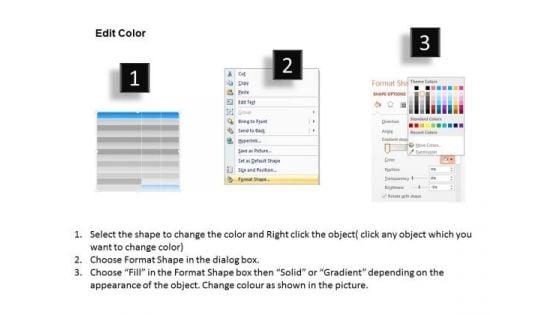
Open Up Doors That Lead To Success. Our MBA Models And Frameworks Business Financial Chart Diagram Sales Diagram Powerpoint Templates Provide The Handles. Opportunity Will Come Knocking At Your Door. Welcome It With Our MBA Models And Frameworks Business Financial Chart Diagram Sales Diagram Powerpoint Templates.

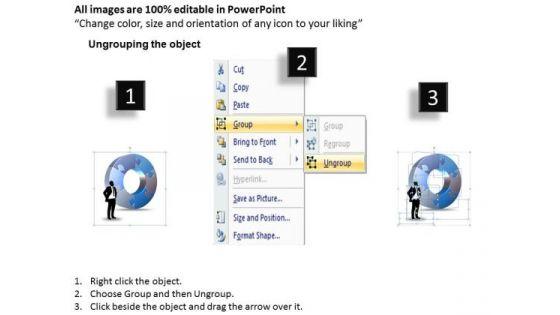
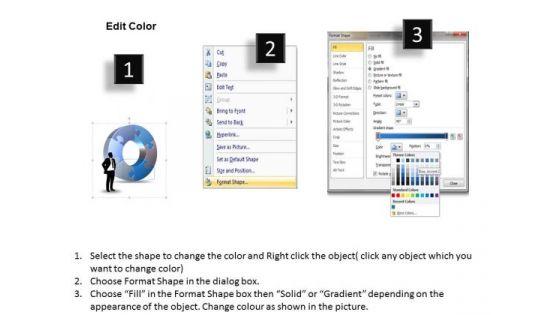
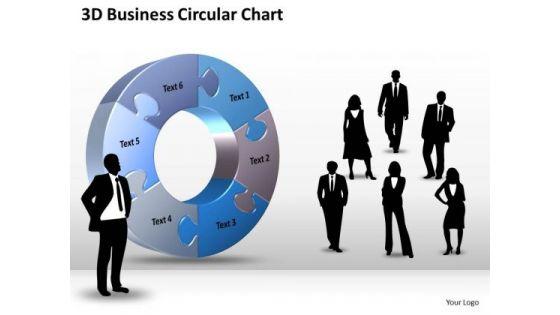
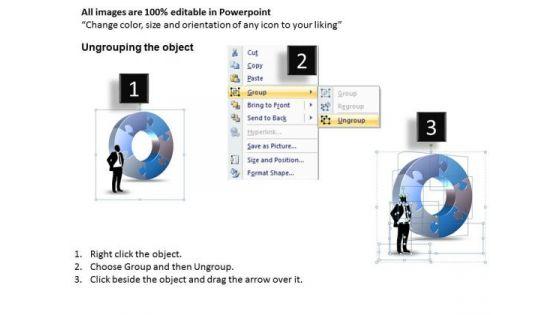
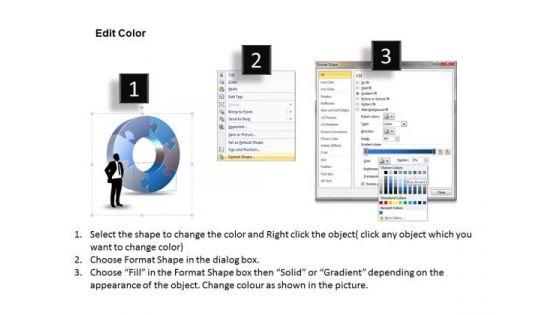
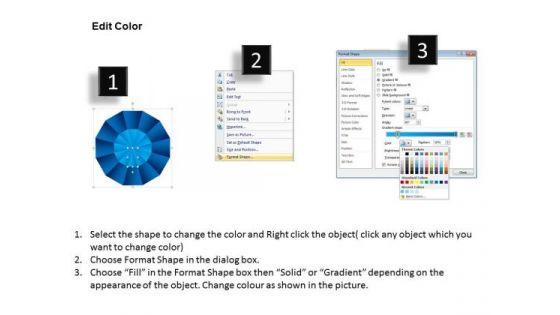
Doll Up Your Thoughts With Our Business Framework Model 3d Business Circular Chart Strategic Management Powerpoint Templates. They Will Make A Pretty Picture. They Say A Dog Is Man's Best Friend. Our Business Framework Model 3d Business Circular Chart Strategic Management Powerpoint Templates Come A Close Second.

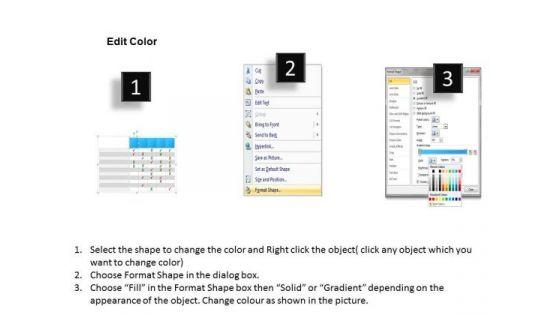


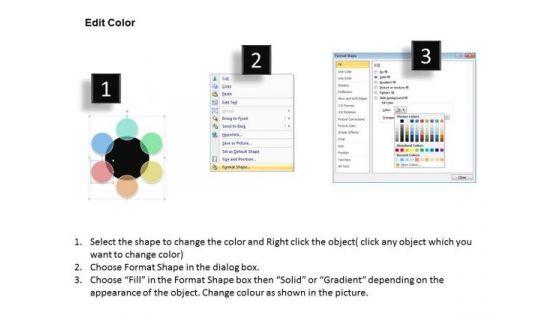
Analyze Ailments On Our Business Finance Strategy Development 3D Business Circular Chart Sales Diagram Powerpoint Templates. Bring Out The Thinking Doctor In You. Dock Your Thoughts With Our Business Finance Strategy Development 3D Business Circular Chart Sales Diagram Powerpoint Templates. They Will Launch Them Into Orbit.
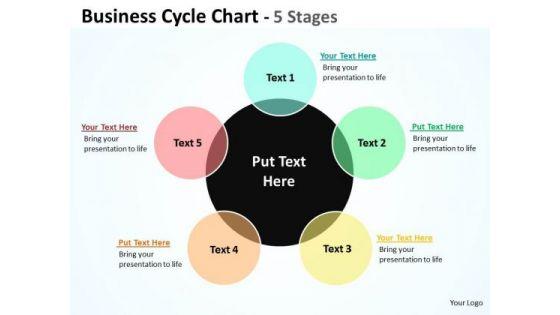


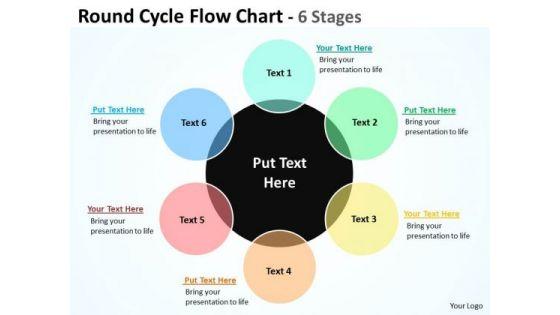
Get the domestics right with our Consulting diagram Business Cycle Chart diagrams MBA models and frameworks Powerpoint Templates. Create the base for thoughts to grow. Do away with dogmatic approaches. Establish the value of reason with our Consulting diagram Business Cycle Chart diagrams MBA models and frameworks Powerpoint Templates.


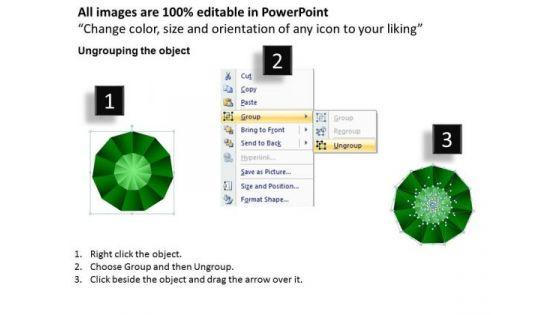
Analyse ailments on our Business Cycle Diagram Business Process Chart 11 Stages Business Framework Model Powerpoint Templates. Bring out the thinking doctor in you. Dock your thoughts with our Business Cycle Diagram Business Process Chart 11 Stages Business Framework Model Powerpoint Templates. They will launch them into orbit.


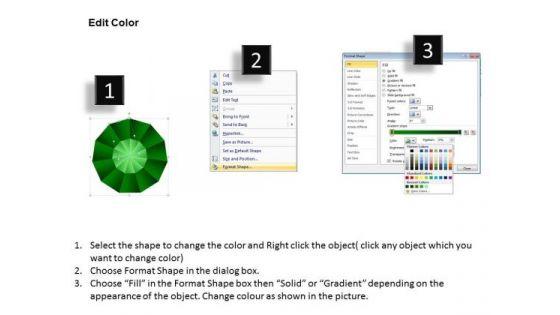
Analyse ailments on our Business Framework Model Business Process Chart 10 Stages Strategy Diagram Powerpoint Templates. Bring out the thinking doctor in you. Dock your thoughts with our Business Framework Model Business Process Chart 10 Stages Strategy Diagram Powerpoint Templates. They will launch them into orbit.


Analyse ailments on our Strategic Management Business Process Chart 9 Stages Marketing Diagram Powerpoint Templates. Bring out the thinking doctor in you. Dock your thoughts with our Strategic Management Business Process Chart 9 Stages Marketing Diagram Powerpoint Templates. They will launch them into orbit.
SHOW
- 60
- 120
- 180
DISPLAYING: 60 of 702 Item(s)
Page