AI PPT Maker
Templates
PPT Bundles
Design Services
Business PPTs
Business Plan
Management
Strategy
Introduction PPT
Roadmap
Self Introduction
Timelines
Process
Marketing
Agenda
Technology
Medical
Startup Business Plan
Cyber Security
Dashboards
SWOT
Proposals
Education
Pitch Deck
Digital Marketing
KPIs
Project Management
Product Management
Artificial Intelligence
Target Market
Communication
Supply Chain
Google Slides
Research Services
 One Pagers
All Categories
Communicate Results PowerPoint Presentation Templates and Google Slides
11 Item(s)
Slide 1 of 2
This slide covers the dashboard for monitoring various audience segments. It includes metrics such as ad mentions, engagement, top occupation of the audience, top interest of the audience, age, language, etc. Boost your pitch with our creative Dashboard For Tracking Brand Communication Campaign Results Building A Comprehensive Brand Elements PDF. Deliver an awe-inspiring pitch that will mesmerize everyone. Using these presentation templates you will surely catch everyones attention. You can browse the ppts collection on our website. We have researchers who are experts at creating the right content for the templates. So you do not have to invest time in any additional work. Just grab the template now and use them.
Slide 1 of 2
This slide covers the dashboard for monitoring various audience segments. It includes metrics such as ad mentions, engagement, top occupation of the audience, top interest of the audience, age, language, etc. The Dashboard For Tracking Brand Communication Campaign Results Executing Brand Communication Strategy Clipart PDF is a compilation of the most recent design trends as a series of slides. It is suitable for any subject or industry presentation, containing attractive visuals and photo spots for businesses to clearly express their messages. This template contains a variety of slides for the user to input data, such as structures to contrast two elements, bullet points, and slides for written information. Slidegeeks is prepared to create an impression.
Slide 1 of 2
This slide covers the dashboard for monitoring various audience segments. It includes metrics such as ad mentions, engagement, top occupation of the audience, top interest of the audience, age, language, etc.Create an editable Dashboard For Tracking Brand Communication Campaign Results Communication Strategy Professional PDF that communicates your idea and engages your audience. Whether you are presenting a business or an educational presentation, pre-designed presentation templates help save time. Dashboard For Tracking Brand Communication Campaign Results Communication Strategy Professional PDF is highly customizable and very easy to edit, covering many different styles from creative to business presentations. Slidegeeks has creative team members who have crafted amazing templates. So, go and get them without any delay.
Slide 1 of 2
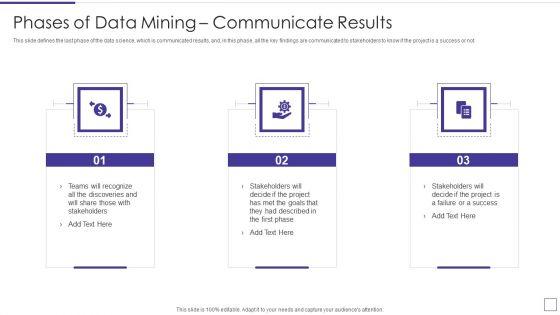
This slide defines the last phase of the data science, which is communicated results, and, in this phase, all the key findings are communicated to stakeholders to know if the project is a success or not.This is a data mining implementation phases of data mining communicate results sample pdf template with various stages. Focus and dispense information on three stages using this creative set, that comes with editable features. It contains large content boxes to add your information on topics like teams will recognize, stakeholders will decide, failure or a success You can also showcase facts, figures, and other relevant content using this PPT layout. Grab it now.
Slide 1 of 2
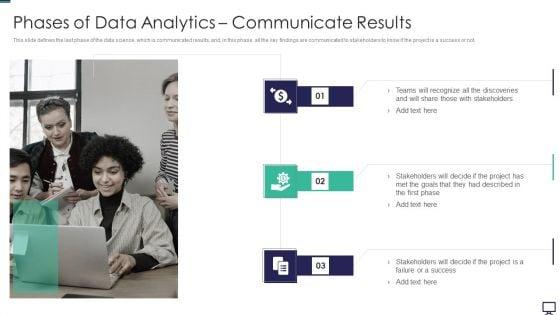
This slide defines the last phase of the data science, which is communicated results, and, in this phase, all the key findings are communicated to stakeholders to know if the project is a success or not. Presenting phases of data analytics communicate results ppt ideas inspiration pdf to provide visual cues and insights. Share and navigate important information on three stages that need your due attention. This template can be used to pitch topics like goals, project. In addtion, this PPT design contains high resolution images, graphics, etc, that are easily editable and available for immediate download.


Slide 1 of 2
This slide defines the last phase of the data science, which is communicated results, and, in this phase, all the key findings are communicated to stakeholders to know if the project is a success or not. Presenting data analytics it phases of data science communicate results ppt gallery slideshow pdf to provide visual cues and insights. Share and navigate important information on three stages that need your due attention. This template can be used to pitch topics like phases of data science communicate results. In addtion, this PPT design contains high resolution images, graphics, etc, that are easily editable and available for immediate download.
Slide 1 of 2
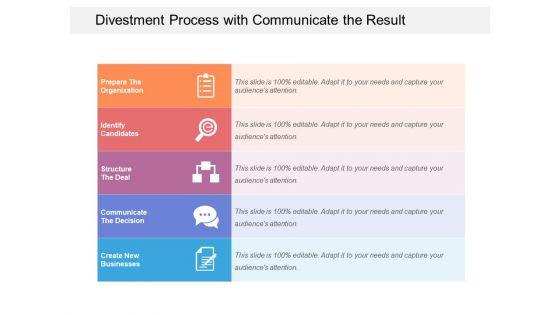
Presenting this set of slides with name divestment process with communicate the result ppt powerpoint presentation file show pdf. This is a five stage process. The stages in this process are communicate, businesses, organization. This is a completely editable PowerPoint presentation and is available for immediate download. Download now and impress your audience.


Slide 1 of 9
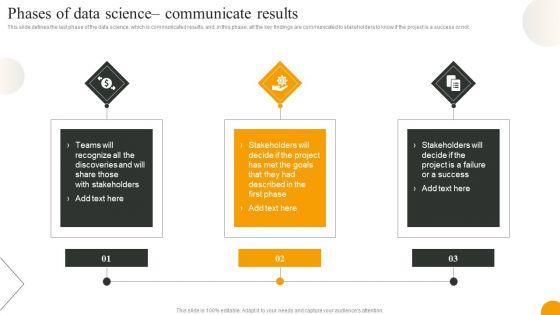
This slide defines the last phase of the data science, which is communicated results, and, in this phase, all the key findings are communicated to stakeholders to know if the project is a success or not. If your project calls for a presentation, then Slidegeeks is your go to partner because we have professionally designed, easy to edit templates that are perfect for any presentation. After downloading, you can easily edit Using Data Science Technologies For Business Transformation Phases Of Data Science Communicate Results Clipart PDF and make the changes accordingly. You can rearrange slides or fill them with different images. Check out all the handy templates.


Slide 1 of 9
This slide signifies the key performance indicator to evaluate business to business marketing communication results. It covers information about metrics, key description, forecast, actual, variance and strategies. Showcasing this set of slides titled Kpis To Measure B2B Promotional Communication Results Graphics PDF. The topics addressed in these templates are Key Description, Forecast, Actual, Variance. All the content presented in this PPT design is completely editable. Download it and make adjustments in color, background, font etc. as per your unique business setting.


Slide 1 of 9
This slide defines the last phase of the data science, which is communicated results, and, in this phase, all the key findings are communicated to stakeholders to know if the project is a success or not.This is a Information Science Phases Of Data Science Communicate Results Ppt PowerPoint Presentation Styles File Formats PDF template with various stages. Focus and dispense information on theree stages using this creative set, that comes with editable features. It contains large content boxes to add your information on topics like Teams Recognize, Stakeholders Decide, Failure Success. You can also showcase facts, figures, and other relevant content using this PPT layout. Grab it now.


Slide 1 of 9
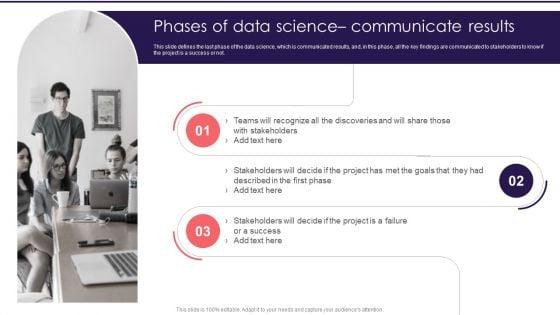
This slide defines the last phase of the data science, which is communicated results, and, in this phase, all the key findings are communicated to stakeholders to know if the project is a success or not. Presenting Information Studies Phases Of Data Science Communicate Results Structure PDF to provide visual cues and insights. Share and navigate important information on three stages that need your due attention. This template can be used to pitch topics like Goals, Project. In addtion, this PPT design contains high resolution images, graphics, etc, that are easily editable and available for immediate download.
11 Item(s)
