- Sign up
- Sign In
 AI PPT Maker
 Templates
 PPT Bundles
 Design Services
 Business PPTs
 Business Plan
 Management
 Strategy
 Introduction PPT
 Roadmap
 Self Introduction
 Timelines
 Process
 Marketing
 Agenda
 Technology
 Medical
 Startup Business Plan
 Cyber Security
 Dashboards
 SWOT
SWOT Proposals
 Education
 Pitch Deck
 Digital Marketing
 KPIs
KPIs Project Management
 Product Management
 Artificial Intelligence
 Target Market
 Communication
 Supply Chain
 Google Slides
 Research Services
 One Pagers
 All Categories
Sales-assessment-techniques PowerPoint Presentation Templates and Google Slides
2 Item(s)
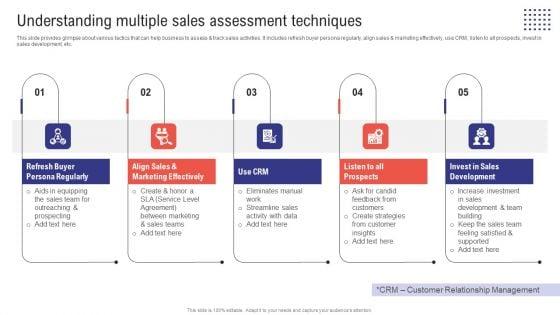


This slide provides glimpse about various tactics that can help business to assess and track sales activities. It includes refresh buyer persona regularly, align sales and marketing effectively, use CRM, listen to all prospects, invest in sales development, etc. There are so many reasons you need a Planning Sales Campaign To Improve Understanding Multiple Sales Assessment Techniques Portrait PDF. The first reason is you cant spend time making everything from scratch, Thus, Slidegeeks has made presentation templates for you too. You can easily download these templates from our website easily.

This slide provides glimpse about various tactics that can help business to assess and track sales activities. It includes refresh buyer persona regularly, align sales and marketing effectively, use CRM, listen to all prospects, invest in sales development, etc. Do you know about Slidesgeeks Enhance Customer Retention Understanding Multiple Sales Assessment Techniques Brochure Pdf These are perfect for delivering any kind od presentation. Using it, create PowerPoint presentations that communicate your ideas and engage audiences. Save time and effort by using our pre-designed presentation templates that are perfect for a wide range of topic. Our vast selection of designs covers a range of styles, from creative to business, and are all highly customizable and easy to edit. Download as a PowerPoint template or use them as Google Slides themes. This slide provides glimpse about various tactics that can help business to assess and track sales activities. It includes refresh buyer persona regularly, align sales and marketing effectively, use CRM, listen to all prospects, invest in sales development, etc.
2 Item(s)