Conduct analytics PowerPoint Presentation Templates and Google Slides
-
Tools To Conduct SEO Analytics Training Ppt
This slide provides an overview of major tools to perform SEO analytics such as Google Analytics, SE Ranking, Sitechecker, Moz Pro, Ahrefs and SEMrush.
-
Analytical Incrementalism Conducting A Strategic Gap Analysis Ppt Ideas Icon PDF
The purpose of this slide is to provide a glimpse of the companys strategic gap analysis considering the focus areas, current and future state and action plan. This is a analytical incrementalism conducting a strategic gap analysis ppt ideas icon pdf template with various stages. Focus and dispense information on three stages using this creative set, that comes with editable features. It contains large content boxes to add your information on topics like focus areas, current state, identified gap, action plan, desired future state. You can also showcase facts, figures, and other relevant content using this PPT layout. Grab it now.
-
Reasons To Conduct Customer Behavior Analytics Ppt Infographic Template Graphics Tutorials PDF
The following slide showcases essential reasons for conducting consumer behavior analysis. Key reasons included are content personalization, customer retention and value. Presenting Reasons To Conduct Customer Behavior Analytics Ppt Infographic Template Graphics Tutorials PDF to dispense important information. This template comprises three stages. It also presents valuable insights into the topics including Content Personalization, Customer Value, Segment Audience. This is a completely customizable PowerPoint theme that can be put to use immediately. So, download it and address the topic impactfully.
-
Ways To Conduct Customer Behavior Analytics Ppt Icon Inspiration PDF
The following slide showcases ways on the basis of which consumer behavior analysis can be done. Key ways included are segment audience, allocate and compare qualitative and quantitative data. Persuade your audience using this Ways To Conduct Customer Behavior Analytics Ppt Icon Inspiration PDF. This PPT design covers six stages, thus making it a great tool to use. It also caters to a variety of topics including Segment Audience, Identify Key Benefits, Allocate Quantitative Data. Download this PPT design now to present a convincing pitch that not only emphasizes the topic but also showcases your presentation skills.
-
Guide For Marketing Analytics To Improve Decisions Skills Required To Conduct Marketing Analysis Structure PDF
The following slide highlights some expertise to visualize technical data and boost campaign results. It includes elements such as data analytics, attribution modelling, customer service, market research, data interpretation, target audience etc. From laying roadmaps to briefing everything in detail, our templates are perfect for you. You can set the stage with your presentation slides. All you have to do is download these easy to edit and customizable templates. Guide For Marketing Analytics To Improve Decisions Skills Required To Conduct Marketing Analysis Structure PDF will help you deliver an outstanding performance that everyone would remember and praise you for. Do download this presentation today.
-
Steps To Effectively Conduct Market Research Brand Analytics KPI Dashboard For Organization Template PDF
The following slide outlines key performance indicator KPI dashboard that can assist marketers to evaluate brand performance on social media channels. The metrics covered are age group, gender, brand perception, branding themes, celebrity analysis, etc. Present like a pro with Steps To Effectively Conduct Market Research Brand Analytics KPI Dashboard For Organization Template PDF Create beautiful presentations together with your team, using our easy to use presentation slides. Share your ideas in real time and make changes on the fly by downloading our templates. So whether you are in the office, on the go, or in a remote location, you can stay in sync with your team and present your ideas with confidence. With Slidegeeks presentation got a whole lot easier. Grab these presentations today.
-
Procedure To Conduct Big Data Analytics For Insights Generation Introduction PDF
This slide illustrate procedure to conduct big data analysis to generate insights that is used in business decision making. It includes elements such as define questions, gather data, data wrangling, conduct analysis and interpret results Persuade your audience using this Procedure To Conduct Big Data Analytics For Insights Generation Introduction PDF. This PPT design covers six stages, thus making it a great tool to use. It also caters to a variety of topics including Define Questions, Gather Data, Data Wrangling. Download this PPT design now to present a convincing pitch that not only emphasizes the topic but also showcases your presentation skills.
-
Analysis Types Conducted With Product Data Analytics Download Pdf
This slide represents various types of analysis which can be conducted with product data analytics use to improve consumer experience. This includes cohort analysis, churn analysis, retention analysis, funnel analysis, etc. Showcasing this set of slides titled Analysis Types Conducted With Product Data Analytics Download Pdf. The topics addressed in these templates are Retention Analysis, Cohort Analysis, Conversion Analysis. All the content presented in this PPT design is completely editable. Download it and make adjustments in color, background, font etc. as per your unique business setting.
-
Step By Step Process To Conduct Trends Analysis Product Analytics Implementation Data Analytics V
This slide outlines phases to conduct market trends analysis aimed at identifying current patterns and make data driven decisions. It covers steps such as identify emerging competitors, analyse quantitative data, gather data, conduct primary research and create beta offerComing up with a presentation necessitates that the majority of the effort goes into the content and the message you intend to convey. The visuals of a PowerPoint presentation can only be effective if it supplements and supports the story that is being told. Keeping this in mind our experts created Step By Step Process To Conduct Trends Analysis Product Analytics Implementation Data Analytics V to reduce the time that goes into designing the presentation. This way, you can concentrate on the message while our designers take care of providing you with the right template for the situation.
-
Steps To Conduct Retention Analysis To Optimize Churn Product Analytics Implementation Data Analytics V
This slide provides phases to conduct retention analysis aimed at helping businesses improve churn rate. It covers six steps such as calculate rate, choose retention KPIs, flag behaviours, determine triggers, identify behaviours and generate feedback This Steps To Conduct Retention Analysis To Optimize Churn Product Analytics Implementation Data Analytics V is perfect for any presentation, be it in front of clients or colleagues. It is a versatile and stylish solution for organizing your meetings. The Steps To Conduct Retention Analysis To Optimize Churn Product Analytics Implementation Data Analytics V features a modern design for your presentation meetings. The adjustable and customizable slides provide unlimited possibilities for acing up your presentation. Slidegeeks has done all the homework before launching the product for you. So, do not wait, grab the presentation templates today
-
Key Steps To Conduct Heuristic Analysis Data Analytics SS V
This slide outlines major steps to conduct heuristics analysis aimed at helping businesses conduct evaluation and generate meaningful changes. It covers steps such as define analysis scope, end user knowledge, define heuristics, choose reporting style, set up scoring system and analyze.Do you have an important presentation coming up Are you looking for something that will make your presentation stand out from the rest Look no further than Key Steps To Conduct Heuristic Analysis Data Analytics SS V. With our professional designs, you can trust that your presentation will pop and make delivering it a smooth process. And with Slidegeeks, you can trust that your presentation will be unique and memorable. So why wait Grab Key Steps To Conduct Heuristic Analysis Data Analytics SS V today and make your presentation stand out from the rest
-
Key Statistical Terms For Conducting Data Analytics For Informed Decision Ppt Template
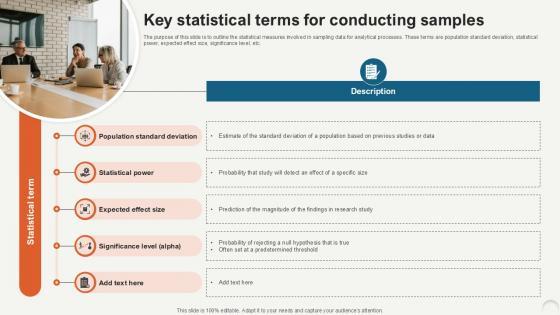
The purpose of this slide is to outline the statistical measures involved in sampling data for analytical processes. These terms are population standard deviation, statistical power, expected effect size, significance level, etc. Welcome to our selection of the Key Statistical Terms For Conducting Data Analytics For Informed Decision Ppt Template. These are designed to help you showcase your creativity and bring your sphere to life. Planning and Innovation are essential for any business that is just starting out. This collection contains the designs that you need for your everyday presentations. All of our PowerPoints are 100Percent editable, so you can customize them to suit your needs. This multi-purpose template can be used in various situations. Grab these presentation templates today.
-
Timeline To Conduct Statistical Data Analytics For Informed Decision Ppt Presentation
This slide shows the timeline for performing statistical data analysis. The key steps include writing hypothesis and plan research design, collect data from a sample, summarize data with descriptive statistics, test hypotheses, result interpretation, etc. Slidegeeks is here to make your presentations a breeze with Timeline To Conduct Statistical Data Analytics For Informed Decision Ppt Presentation With our easy-to-use and customizable templates, you can focus on delivering your ideas rather than worrying about formatting. With a variety of designs to choose from, you are sure to find one that suits your needs. And with animations and unique photos, illustrations, and fonts, you can make your presentation pop. So whether you are giving a sales pitch or presenting to the board, make sure to check out Slidegeeks first