 AI PPT Maker
 Templates
 PPT Bundles
 Design Services
 Business PPTs
 Business Plan
 Management
 Strategy
 Introduction PPT
 Roadmap
 Self Introduction
 Timelines
 Process
 Marketing
 Agenda
 Technology
 Medical
 Startup Business Plan
 Cyber Security
 Dashboards
 SWOT
SWOT Proposals
 Education
 Pitch Deck
 Digital Marketing
 KPIs
KPIs Project Management
 Product Management
 Artificial Intelligence
 Target Market
 Communication
 Supply Chain
 Google Slides
 Research Services
 One Pagers
 All Categories
Conducting-data-analysis PowerPoint Presentation Templates and Google Slides
2 Item(s)


Persuade your audience using this Steps To Conduct Quantitative Data Analysis Ppt Portfolio Aids PDF. This PPT design covers four stages, thus making it a great tool to use. It also caters to a variety of topics including Relate Measurement, Connect Descriptive, Present Data. Download this PPT design now to present a convincing pitch that not only emphasizes the topic but also showcases your presentation skills.
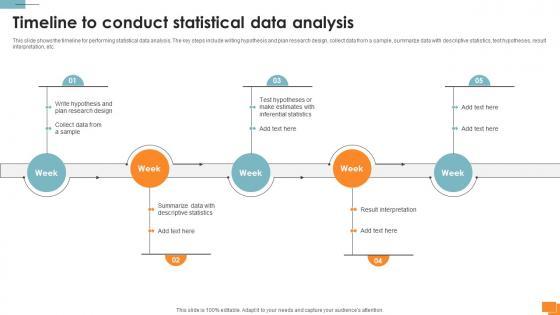
This slide shows the timeline for performing statistical data analysis. The key steps include writing hypothesis and plan research design, collect data from a sample, summarize data with descriptive statistics, test hypotheses, result interpretation, etc. From laying roadmaps to briefing everything in detail, our templates are perfect for you. You can set the stage with your presentation slides. All you have to do is download these easy-to-edit and customizable templates. Statistical Tools For Evidence Timeline To Conduct Statistical Data Analysis will help you deliver an outstanding performance that everyone would remember and praise you for. Do download this presentation today. This slide shows the timeline for performing statistical data analysis. The key steps include writing hypothesis and plan research design, collect data from a sample, summarize data with descriptive statistics, test hypotheses, result interpretation, etc.
2 Item(s)