 AI PPT Maker
 Templates
 PPT Bundles
 Design Services
 Business PPTs
 Business Plan
 Management
 Strategy
 Introduction PPT
 Roadmap
 Self Introduction
 Timelines
 Process
 Marketing
 Agenda
 Technology
 Medical
 Startup Business Plan
 Cyber Security
 Dashboards
 SWOT
SWOT Proposals
 Education
 Pitch Deck
 Digital Marketing
 KPIs
KPIs Project Management
 Product Management
 Artificial Intelligence
 Target Market
 Communication
 Supply Chain
 Google Slides
 Research Services
 One Pagers
 All Categories
Dashboard With Revenue PowerPoint Presentation Templates and Google Slides
38 Item(s)
This slide shows the KPI dashboard of the catering industry to evaluate the actual and potential targets. It includes KPIs such as expenditure, sales revenue, beverage, etc. Showcasing this set of slides titled Catering Business Advertisement Plan KPI Dashboard With Revenue Comparison Icons PDF. The topics addressed in these templates are Expenditure, Revenue Comparison, Department. All the content presented in this PPT design is completely editable. Download it and make adjustments in color, background, font etc. as per your unique business setting.


This slide showcases KPI dashboard for monitoring financial health of business to ensure smooth flow of business operations. It includes details such as COGS, net profit, cost breakdown, etc. Showcasing this set of slides titled Monthly Financial Metrics Dashboard With Revenue And Expenditure Rules PDF. The topics addressed in these templates are Net Profit, Costs, Expenditure. All the content presented in this PPT design is completely editable. Download it and make adjustments in color, background, font etc. as per your unique business setting.
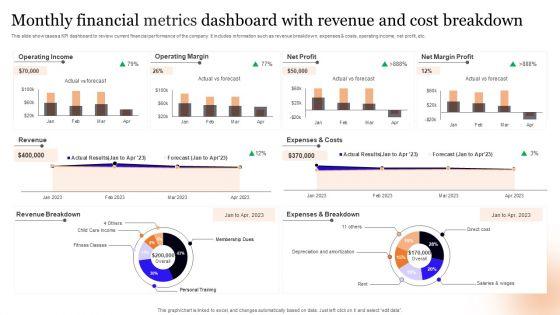

This slide showcases a KPI dashboard to review current financial performance of the company. It includes information such as revenue breakdown, expenses and costs, operating income, net profit, etc. Pitch your topic with ease and precision using this Monthly Financial Metrics Dashboard With Revenue And Cost Breakdown Information PDF. This layout presents information on Operating Income, Operating Margin, Net Profit. It is also available for immediate download and adjustment. So, changes can be made in the color, design, graphics or any other component to create a unique layout.
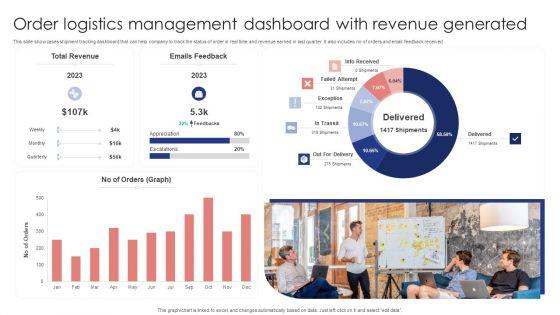

This slide showcases shipment tracking dashboard that can help company to track the status of order in real time and revenue earned in last quarter. It also includes no of orders and email feedback received. Showcasing this set of slides titled Order Logistics Management Dashboard With Revenue Generated Slides PDF. The topics addressed in these templates are Total Revenue, Emails Feedback, Orders Graph. All the content presented in this PPT design is completely editable. Download it and make adjustments in color, background, font etc. as per your unique business setting.

This slide showcases shipping dashboard that can help company to calculate the revenue generated from delivered products and track the monthly order status. Its key components are highest revenue days, subscription revenue, order status, order revenue and transaction paid status. Showcasing this set of slides titled Logistics Management Revenue Analysis Dashboard With Orders Revenue Brochure PDF. The topics addressed in these templates are Order Revenue, Transaction Paid, Subscription Revenue. All the content presented in this PPT design is completely editable. Download it and make adjustments in color, background, font etc. as per your unique business setting.
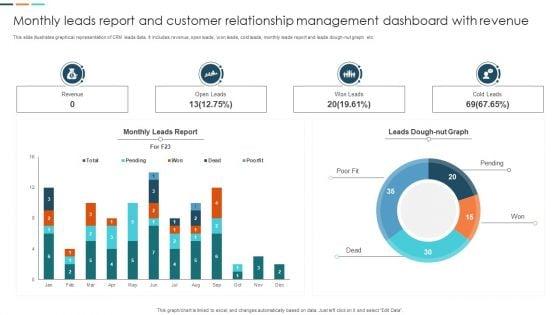
This slide illustrates graphical representation of CRM leads data. It includes revenue, open leads, won leads, cold leads, monthly leads report and leads dough nut graph etc. Pitch your topic with ease and precision using this Monthly Leads Report And Customer Relationship Management Dashboard With Revenue Information PDF. This layout presents information on Monthly Leads Report, Customer Relationship Management, Dashboard With Revenue. It is also available for immediate download and adjustment. So, changes can be made in the color, design, graphics or any other component to create a unique layout.


Pitch your topic with ease and precision using this Branch Performance Evaluation Management Dashboard With Revenue And Product Mockup PDF. This layout presents information on Five Revenue, Revenue Product, Total Revenue. It is also available for immediate download and adjustment. So, changes can be made in the color, design, graphics or any other component to create a unique layout.
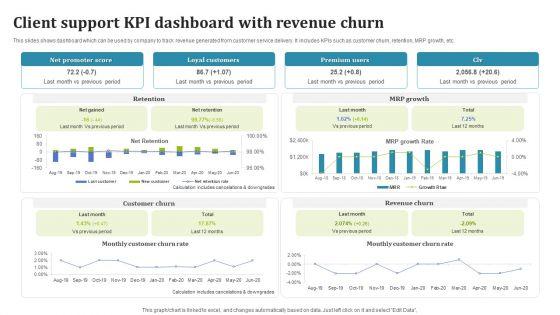
This slides shows dashboard which can be used by company to track revenue generated from customer service delivery. It includes KPIs such as customer churn, retention, MRP growth, etc. Showcasing this set of slides titled Client Support KPI Dashboard With Revenue Churn Information PDF. The topics addressed in these templates are Customer Churn, Loyal Customers, Premium Users. All the content presented in this PPT design is completely editable. Download it and make adjustments in color, background, font etc. as per your unique business setting.
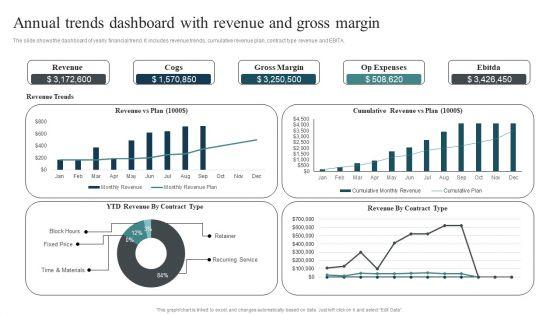

The slide shows the dashboard of yearly financial trend. It includes revenue trends, cumulative revenue plan, contract type revenue and EBITA. Showcasing this set of slides titled Annual Trends Dashboard With Revenue And Gross Margin Designs PDF. The topics addressed in these templates are Cumulative Revenue, Time Materials, Recurring Service. All the content presented in this PPT design is completely editable. Download it and make adjustments in color, background, font etc. as per your unique business setting.


The purpose of this slide is to monitor and evaluate service delivery KPIs to improve the customer support process. The major KPIs included are total requests, percentage of requests answered, total revenue, and support cost. Pitch your topic with ease and precision using this Customer Service Delivery And Management Dashboard With Revenue Brochure PDF. This layout presents information on Customer Service Delivery, Management Dashboard With Revenue. It is also available for immediate download and adjustment. So, changes can be made in the color, design, graphics or any other component to create a unique layout.
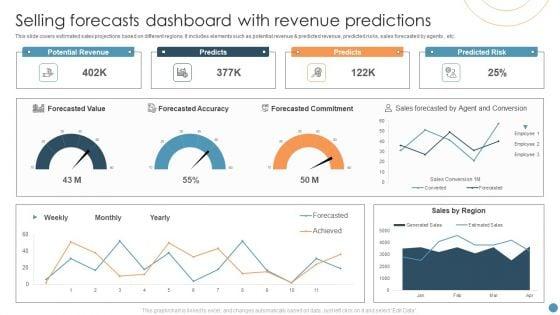
This slide covers estimated sales projections based on different regions. It includes elements such as potential revenue and predicted revenue, predicted risks, sales forecasted by agents , etc. Showcasing this set of slides titled Selling Forecasts Dashboard With Revenue Predictions Elements PDF. The topics addressed in these templates are Forecasted Value, Potential Revenue, Predicted Risk. All the content presented in this PPT design is completely editable. Download it and make adjustments in color, background, font etc. as per your unique business setting.
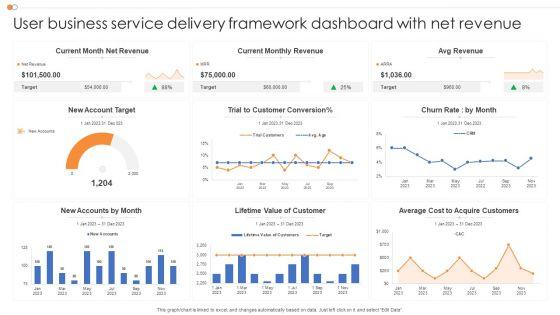

Showcasing this set of slides titled User Business Service Delivery Framework Dashboard With Net Revenue Microsoft PDF. The topics addressed in these templates are Service Delivery, Framework Dashboard, Net Revenue. All the content presented in this PPT design is completely editable. Download it and make adjustments in color, background, font etc. as per your unique business setting.


Pitch your topic with ease and precision using this Customer Business Service Delivery Framework Dashboard With Total Revenue Structure PDF. This layout presents information on Requests Answered, Total Requests, Total Revenue. It is also available for immediate download and adjustment. So, changes can be made in the color, design, graphics or any other component to create a unique layout.


This slide illustrates sales revenue and costs tracking dashboard. It provides information about sales count, profit, expenses, sales revenue, expenses breakdown, up or cross selling, etc. Showcasing this set of slides titled Sales Performance Monitoring Dashboard With Revenue And Cost Metric Ppt Portfolio Good PDF. The topics addressed in these templates are Sales Count, Revenue, Profit, Expenses. All the content presented in this PPT design is completely editable. Download it and make adjustments in color, background, font etc. as per your unique business setting.
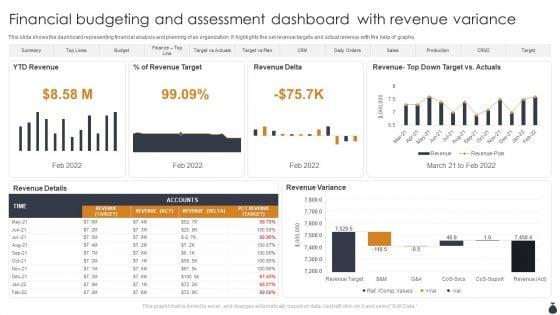

This slide shows the dashboard representing financial analysis and planning of an organization. It highlights the set revenue targets and actual revenue with the help of graphs. Showcasing this set of slides titled Financial Budgeting And Assessment Dashboard With Revenue Variance Designs PDF. The topics addressed in these templates are YTD Revenue, Revenue Delta, Revenue Variance. All the content presented in this PPT design is completely editable. Download it and make adjustments in color, background, font etc. as per your unique business setting.
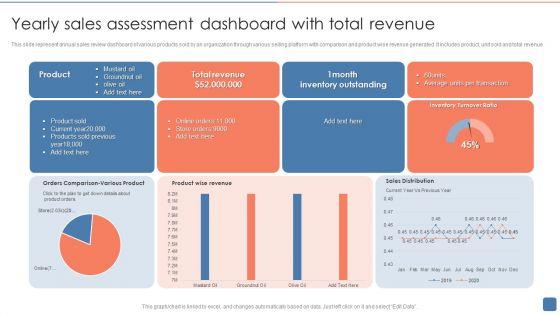
This slide represent annual sales review dashboard of various products sold by an organization through various selling platform with comparison and product wise revenue generated .It includes product, unit sold and total revenue. Showcasing this set of slides titled Yearly Sales Assessment Dashboard With Total Revenue Introduction PDF. The topics addressed in these templates are Product Sold, Inventory Outstanding, Average. All the content presented in this PPT design is completely editable. Download it and make adjustments in color, background, font etc. as per your unique business setting.
This slide shows the project management dashboard which covers the name, priorities, indicators and status which includes strategic priorities, research and development, administration, performance management, etc. With purchases in last 30 days and tasks. Showcasing this set of slides titled Project Metrics Dashboard With Revenues And Expenses Icons PDF. The topics addressed in these templates are Performance Management, Research And Development, Strategic Priorities. All the content presented in this PPT design is completely editable. Download it and make adjustments in color, background, font etc. as per your unique business setting.


The following slide highlights the service promotional marketing dashboard with revenue. It illustrates costs, revenue, net income, net income customer, cost per lead, cost per marketing qualified leads, cost per sales qualified leads and cost per customer. Pitch your topic with ease and precision using this Services Promotional Campaign Marketing Dashboard With Revenue Brochure PDF. This layout presents information on Costs, Revenue, Net Income. It is also available for immediate download and adjustment. So, changes can be made in the color, design, graphics or any other component to create a unique layout.
This slide showcases dashboard that can help organization to evaluate the revenue generated and expenses incurred in conducting operations. It also showcases gross profit and margin of last financial year. Pitch your topic with ease and precision using this Gross Profit Margin Dashboard With Revenue Vs Expenses Icons PDF. This layout presents information on Gross Profit Margin, EBITDA Margin, Net Profit Margin. It is also available for immediate download and adjustment. So, changes can be made in the color, design, graphics or any other component to create a unique layout.

Showcasing this set of slides titled Content Marketing Freelance Metrics Dashboard With Revenue Generated Demonstration PDF. The topics addressed in these templates are Content Marketing, Freelance Metrics Dashboard, Revenue Generated. All the content presented in this PPT design is completely editable. Download it and make adjustments in color, background, font etc. as per your unique business setting.
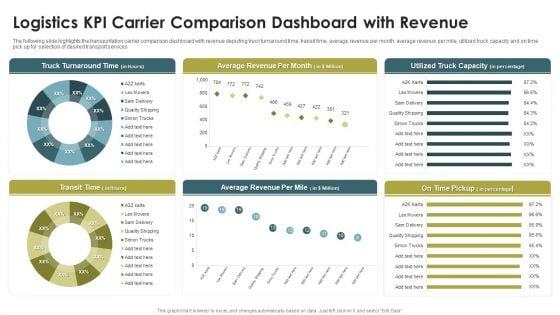
The following slide highlights the transportation carrier comparison dashboard with revenue depicting truck turnaround time, transit time, average revenue per month, average revenue per mile, utilized truck capacity and on time pick up for selection of desired transport services. Pitch your topic with ease and precision using this Logistics KPI Carrier Comparison Dashboard With Revenue Ppt Infographics Portfolio PDF. This layout presents information on Truck Turnaround Time, Average Revenue, Per Month, Transit Time. It is also available for immediate download and adjustment. So, changes can be made in the color, design, graphics or any other component to create a unique layout.

This slide illustrates insurance agent sales statistics. It includes his total proposals, total policies, total claims and monthly revenue graph etc. Showcasing this set of slides titled Non Life Insurance Analytics Agent Dashboard With Revenue Chart Infographics PDF. The topics addressed in these templates are Revenue, Cost, Total Proposals. All the content presented in this PPT design is completely editable. Download it and make adjustments in color, background, font etc. as per your unique business setting.
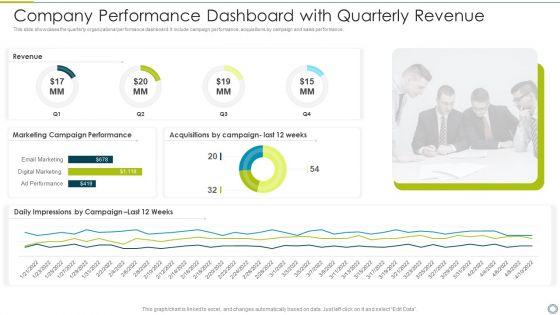
This slide showcases the quarterly organizational performance dashboard. It include campaign performance, acquisitions by campaign and sales performance. Showcasing this set of slides titled company performance dashboard with quarterly revenue download pdf. The topics addressed in these templates are marketing, performance. All the content presented in this PPT design is completely editable. Download it and make adjustments in color, background, font etc. as per your unique business setting.
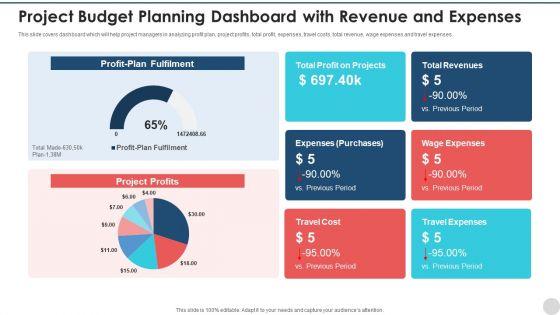

This slide covers dashboard which will help project managers in analyzing profit plan, project profits, total profit, expenses, travel costs, total revenue, wage expenses and travel expenses. Showcasing this set of slides titled project budget planning dashboard with revenue and expenses ideas pdf. The topics addressed in these templates are project budget planning dashboard with revenue and expenses. All the content presented in this PPT design is completely editable. Download it and make adjustments in color, background, font etc. as per your unique business setting.


The following slide displays a brand awareness dashboard as it highlights the key metrics for measuring brand awareness such as brand search, social media searches, links, brand and mentions. Deliver and pitch your topic in the best possible manner with this how make impactful product marketing message build product differentiation product performance dashboard with total revenues information pdf. Use them to share invaluable insights on social, organic, performance, traffic and impress your audience. This template can be altered and modified as per your expectations. So, grab it now.
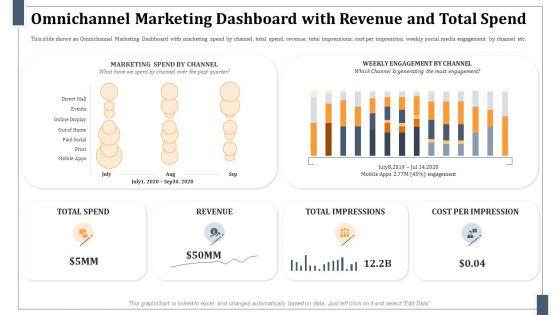

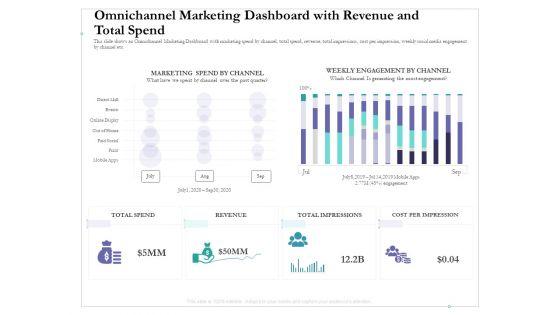
This slide shows an Omnichannel Marketing Dashboard with marketing spend by channel, total spend, revenue, total impressions, cost per impression, weekly social media engagement by channel etc. Deliver and pitch your topic in the best possible manner with this omnichannel marketing dashboard with revenue and total spend formats pdf. Use them to share invaluable insights on revenue, impressions, marketing and impress your audience. This template can be altered and modified as per your expectations. So, grab it now.
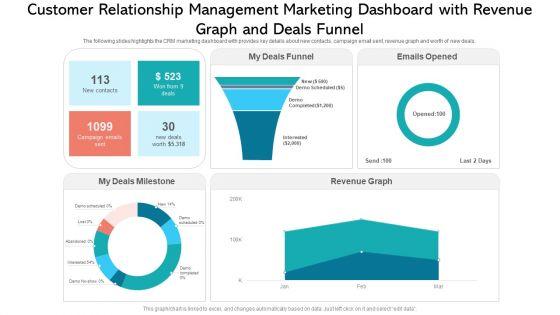

The following slides highlights the CRM marketing dashboard with provides key details about new contacts, campaign email sent, revenue graph and worth of new deals. Showcasing this set of slides titled customer relationship management marketing dashboard with revenue graph and deals funnel ideas pdf. The topics addressed in these templates are funnel, revenue graph, campaign. All the content presented in this PPT design is completely editable. Download it and make adjustments in color, background, font etc. as per your unique business setting.
This slide shows an Omnichannel Marketing Dashboard with marketing spend by channel, total spend, revenue, total impressions, cost per impression, weekly social media engagement by channel etc. Deliver an awe inspiring pitch with this creative omnichannel marketing dashboard with revenue and total spend revenue ppt icon gridlines pdf bundle. Topics like marketing spend by channel, weekly engagement by channel, revenue, cost per impression, total spend can be discussed with this completely editable template. It is available for immediate download depending on the needs and requirements of the user.
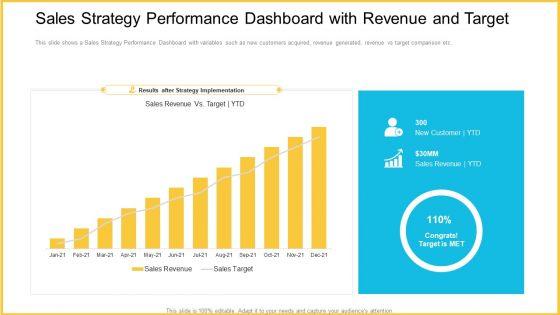
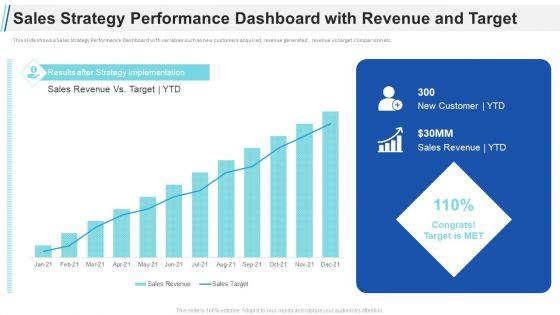
This slide shows a Sales Strategy Performance Dashboard with variables such as new customers acquired, revenue generated, revenue vs target comparison etc. Deliver and pitch your topic in the best possible manner with this sales strategy performance dashboard with revenue and target designs pdf. Use them to share invaluable insights on sales strategy performance dashboard with revenue and target and impress your audience. This template can be altered and modified as per your expectations. So, grab it now.


This slide shows a Sales Strategy Performance Dashboard with variables such as new customers acquired, revenue generated, revenue vs target comparison etc. Deliver and pitch your topic in the best possible manner with this strategic plan to increase sales volume and revenue sales strategy performance dashboard with revenue and target summary pdf. Use them to share invaluable insights on sales, revenue, target and impress your audience. This template can be altered and modified as per your expectations. So, grab it now.


This slide shows a Sales Strategy Performance Dashboard with variables such as new customers acquired, revenue generated, revenue vs target comparison etc. Deliver and pitch your topic in the best possible manner with this tools for improving sales plan effectiveness sales strategy performance dashboard with revenue and target professional pdf. Use them to share invaluable insights on sales, revenue, target and impress your audience. This template can be altered and modified as per your expectations. So, grab it now.
This slide shows a Sales Strategy Performance Dashboard with variables such as new customers acquired, revenue generated, revenue vs target comparison etc. Deliver and pitch your topic in the best possible manner with this maximizing profitability earning through sales initiatives sales strategy performance dashboard with revenue and target elements pdf. Use them to share invaluable insights on sales strategy performance dashboard with revenue and target and impress your audience. This template can be altered and modified as per your expectations. So, grab it now.

This slide shows an Omnichannel Marketing Dashboard with marketing spend by channel, total spend, revenue, total impressions, cost per impression, weekly social media engagement by channel etc. Deliver and pitch your topic in the best possible manner with this omnichannel marketing dashboard with revenue and total spend structure pdf. Use them to share invaluable insights on marketing spend by channel, weekly engagement by channel, cost per impression and impress your audience. This template can be altered and modified as per your expectations. So, grab it now.

Showcasing this set of slides titled sales performance dashboard with weekly revenue ppt powerpoint presentation file pictures pdf. The topics addressed in these templates are sales, performance, revenue. All the content presented in this PPT design is completely editable. Download it and make adjustments in color, background, font etc. as per your unique business setting.


Presenting this set of slides with name sales management dashboard with revenue and count ppt powerpoint presentation layouts template pdf. The topics discussed in these slides are revenue, by organization, industry type, close won, close lost, by organization, industry type. This is a completely editable PowerPoint presentation and is available for immediate download. Download now and impress your audience.
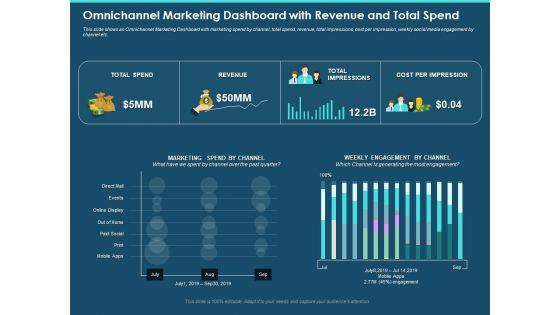
Presenting this set of slides with name cross channel marketing plan for clients omnichannel marketing dashboard with revenue and total spend slides pdf. The topics discussed in these slides are direct mall, events, online display, paid social. This is a completely editable PowerPoint presentation and is available for immediate download. Download now and impress your audience.


This slide showcases a sales dashboard that provides the team with real time view of their performance by displaying key metrics such as total accounts, orders per month, average contract, growth rate, sales growth by market segment, etc. The Monthly Sales Dashboard With Revenue Efficient Sales Territory Management To Build SA SS V is a compilation of the most recent design trends as a series of slides. It is suitable for any subject or industry presentation, containing attractive visuals and photo spots for businesses to clearly express their messages. This template contains a variety of slides for the user to input data, such as structures to contrast two elements, bullet points, and slides for written information. Slidegeeks is prepared to create an impression. This slide showcases a sales dashboard that provides the team with real time view of their performance by displaying key metrics such as total accounts, orders per month, average contract, growth rate, sales growth by market segment, etc.
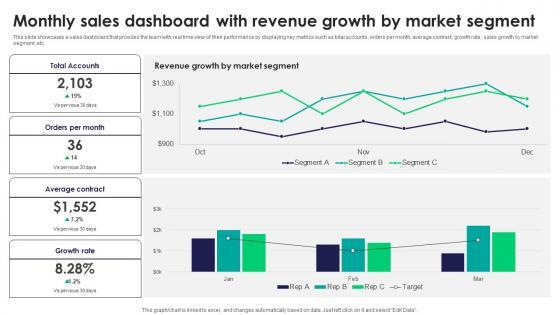
This slide showcases a sales dashboard that provides the team with real time view of their performance by displaying key metrics such as total accounts, orders per month, average contract, growth rate, sales growth by market segment, etc. The Monthly Sales Dashboard With Revenue Growth By Tactics For Improving Field Sales Team SA SS V is a compilation of the most recent design trends as a series of slides. It is suitable for any subject or industry presentation, containing attractive visuals and photo spots for businesses to clearly express their messages. This template contains a variety of slides for the user to input data, such as structures to contrast two elements, bullet points, and slides for written information. Slidegeeks is prepared to create an impression. This slide showcases a sales dashboard that provides the team with real time view of their performance by displaying key metrics such as total accounts, orders per month, average contract, growth rate, sales growth by market segment, etc.
38 Item(s)