 AI PPT Maker
 Templates
 PPT Bundles
 Design Services
 Business PPTs
 Business Plan
 Management
 Strategy
 Introduction PPT
 Roadmap
 Self Introduction
 Timelines
 Process
 Marketing
 Agenda
 Technology
 Medical
 Startup Business Plan
 Cyber Security
 Dashboards
 SWOT
SWOT Proposals
 Education
 Pitch Deck
 Digital Marketing
 KPIs
KPIs Project Management
 Product Management
 Artificial Intelligence
 Target Market
 Communication
 Supply Chain
 Google Slides
 Research Services
 One Pagers
 All Categories
Data And Analysis PowerPoint Presentation Templates and Google Slides
SHOW
- 60
- 120
- 180
DISPLAYING: 60 of 121 Item(s)
Page


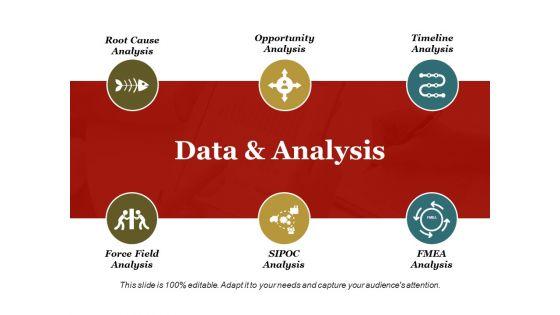
This complete deck acts as a great communication tool. It helps you in conveying your business message with personalized sets of graphics, icons etc. Comprising a set of thirty nine slides, this complete deck can help you persuade your audience. It also induces strategic thinking as it has been thoroughly researched and put together by our experts. Not only is it easily downloadable but also editable. The color, graphics, theme any component can be altered to fit your individual needs. So grab it now.


Presenting this set of slides with name example of data management and analysis process diagram slides. This is a six stage process. The stages in this process are data governance, data structure, data architecture, master data and metadata, data security, data quality. This is a completely editable PowerPoint presentation and is available for immediate download. Download now and impress your audience.


This is a data processing and analysis powerpoint slides. This is a five stage process. The stages in this process are financial reporting and business excellence, competitive intelligence and strategy support, analysis and tool creation, planning and performance management support, data processing and analysis.
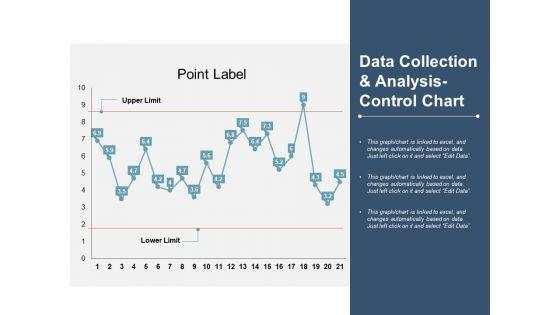


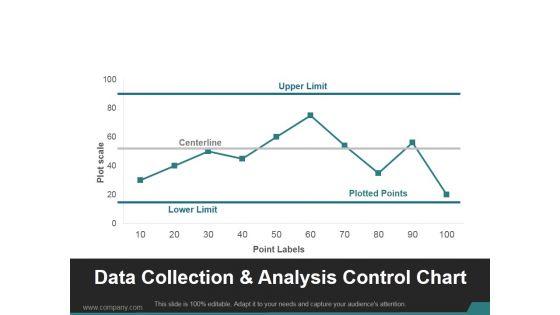
Presenting this set of slides with name data collection and analysis ppt powerpoint presentation infographics good. This is a four stage process. The stages in this process are productivity improvement, output improvement, productivity enhancement. This is a completely editable PowerPoint presentation and is available for immediate download. Download now and impress your audience.


The purpose of this template is to explain the analysis of employee demographics and designation dashboard. The slide provides information about gender, ethnicity, location and structure. Pitch your topic with ease and precision using this Employee Demographics Data And Designation Analysis Dashboard Introduction PDF. This layout presents information on Job Functions, Top Locations, Employee Structure It is also available for immediate download and adjustment. So, changes can be made in the color, design, graphics or any other component to create a unique layout.
Presenting QA Plan Set 1 Data Collection And Analysis Tools Infographics PDF to provide visual cues and insights. Share and navigate important information on five stages that need your due attention. This template can be used to pitch topics like Data Clustering, Business Strategy, Customer Satisfaction Assessment. In addtion, this PPT design contains high resolution images, graphics, etc, that are easily editable and available for immediate download.
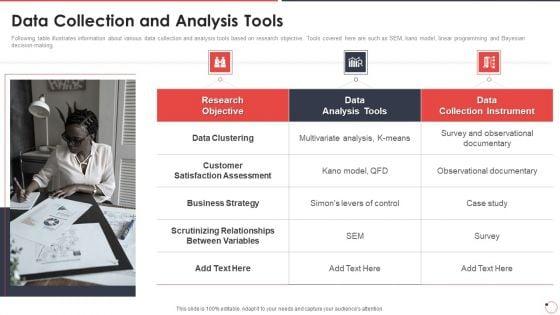

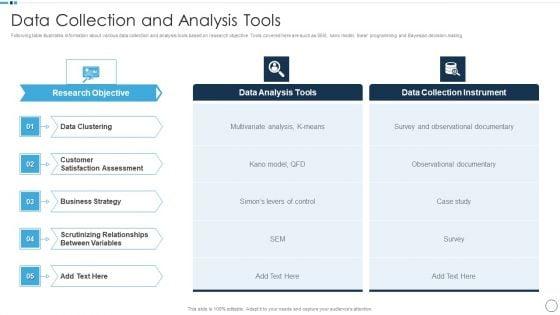
Following table illustrates information about various data collection and analysis tools based on research objective. Tools covered here are such as SEM, kano model, linear programming and Bayesian decision making. This is a quality assurance templates set 1 data collection and analysis tools ppt styles example topics pdf template with various stages. Focus and dispense information on three stages using this creative set, that comes with editable features. It contains large content boxes to add your information on topics like data clustering, customer satisfaction assessment, business strategy, scrutinizing relationships between variables. You can also showcase facts, figures, and other relevant content using this PPT layout. Grab it now.


The following slide highlights the keywords performance data profiling and analysis dashboard illustrating spend vs cost per click, campaign report, high performing keywords, low performing keywords and advertisement performance Showcasing this set of slides titled keywords performance data mining and analysis dashboard microsoft pdf . The topics addressed in these templates are keywords performance data mining and analysis dashboard . All the content presented in this PPT design is completely editable. Download it and make adjustments in color, background, font etc. as per your unique business setting.


Showcasing this set of slides titled major issues associated with firm data collection and analysis demonstration pdf. The topics addressed in these templates are major issues associated with firm data collection and analysis. All the content presented in this PPT design is completely editable. Download it and make adjustments in color, background, font etc. as per your unique business setting.


This template depicts that intuitive search-driven analytics gives users an easy way to ask questions, receive suggestions on what to query, and visualize their data. Deliver and pitch your topic in the best possible manner with this data interpretation and analysis playbook how to overcome search driven analytics barriers summary pdf. Use them to share invaluable insights on how to overcome search driven analytics barriers and impress your audience. This template can be altered and modified as per your expectations. So, grab it now.
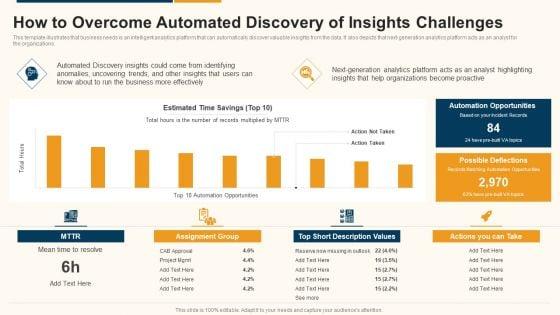

This template illustrates that business needs is an intelligent analytics platform that can automatically discover valuable insights from the data. It also depicts that next-generation analytics platform acts as an analyst for the organizations. Deliver an awe inspiring pitch with this creative data interpretation and analysis playbook how to overcome automated discovery of insights challenges rules pdf bundle. Topics like opportunities, organizations, analytics, business can be discussed with this completely editable template. It is available for immediate download depending on the needs and requirements of the user.


This template illustrates that automated discovery of insights utilizes machine learning algorithms to analyze billions of data points in seconds to perform complex segmentation, anomaly detection, and trend-based analysis without coding. Deliver and pitch your topic in the best possible manner with this data interpretation and analysis playbook how to overcome automated data analysis powered by ml challenges summary pdf. Use them to share invaluable insights on opportunity, service, analytics, industry and impress your audience. This template can be altered and modified as per your expectations. So, grab it now.

This template depicts that with interactive BI visualization and predictive modeling in the same enterprise analytics platform, organizations can easily collaborate on initiatives that make recommended actions accessible to the business. Deliver an awe inspiring pitch with this creative data interpretation and analysis playbook how to bridge business intelligence and predictive analytics challenges designs pdf bundle. Topics like how to bridge business intelligence and predictive analytics challenges can be discussed with this completely editable template. It is available for immediate download depending on the needs and requirements of the user.
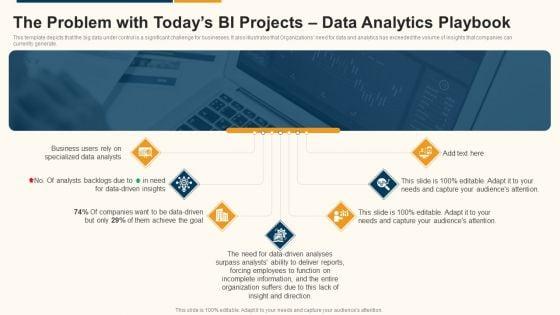

This template depicts that the big data under control is a significant challenge for businesses. It also illustrates that Organizations need for data and analytics has exceeded the volume of insights that companies can currently generate. This is a data interpretation and analysis playbook the problem with todays bi projects data analytics playbook introduction pdf template with various stages. Focus and dispense information on seven stages using this creative set, that comes with editable features. It contains large content boxes to add your information on topics like organization, analysts, business, data driven. You can also showcase facts, figures, and other relevant content using this PPT layout. Grab it now.


This template covers the facts about bigdata, business intelligence and data analytics. It also depicts that enterprise data and analytics solutions will drive growth and revenue, when optimized for different businesses. Presenting data interpretation and analysis playbook the escalating value of data and analytics template pdf to provide visual cues and insights. Share and navigate important information on seven stages that need your due attention. This template can be used to pitch topics like telecommunications, manufacturing, business, analytics, service. In addtion, this PPT design contains high resolution images, graphics, etc, that are easily editable and available for immediate download.


Deliver an awe inspiring pitch with this creative data interpretation and analysis playbook table of contents for data interpretation and analysis playbook rules pdf bundle. Topics like six critical elements, data management framework, solutions to the barriers, data management in bi projects, final thoughts can be discussed with this completely editable template. It is available for immediate download depending on the needs and requirements of the user.
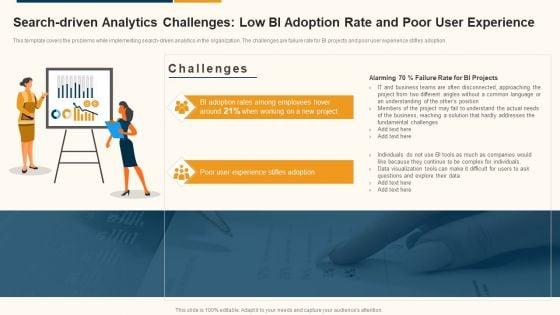

This template covers the problems while implementing search-driven analytics in the organization. The challenges are failure rate for BI projects and poor user experience stifles adoption. Presenting data interpretation and analysis playbook search driven analytics challenges low bi adoption rate and poor demonstration pdf to provide visual cues and insights. Share and navigate important information on two stages that need your due attention. This template can be used to pitch topics like business, data visualization, fundamental challenges. In addtion, this PPT design contains high resolution images, graphics, etc, that are easily editable and available for immediate download.


This slide covers the reasons for data management in an organisation such as minimizing the data movement and attention to data security. This is a data interpretation and analysis playbook requirement of data management in bi projects topics pdf template with various stages. Focus and dispense information on three stages using this creative set, that comes with editable features. It contains large content boxes to add your information on topics like attend to data security, use existing skills, minimize data movement. You can also showcase facts, figures, and other relevant content using this PPT layout. Grab it now.
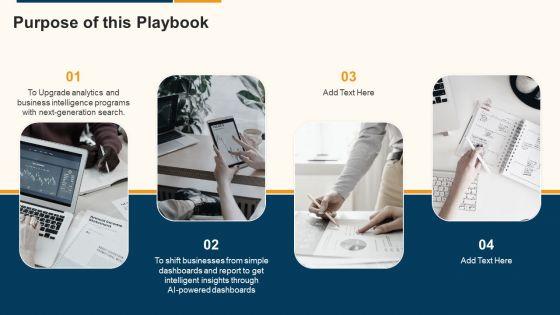

Presenting data interpretation and analysis playbook purpose of this playbook formats pdf to provide visual cues and insights. Share and navigate important information on four stages that need your due attention. This template can be used to pitch topics like purpose of this playbook. In addtion, this PPT design contains high resolution images, graphics, etc, that are easily editable and available for immediate download.


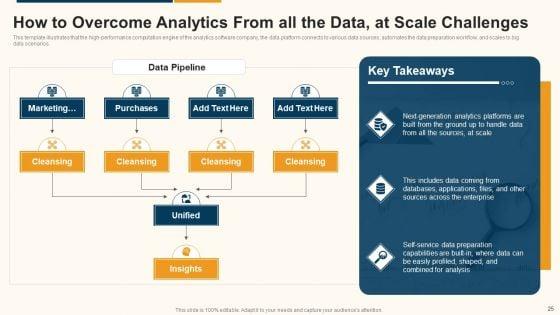
This template illustrates that the high-performance computation engine of the analytics software company, the data platform connects to various data sources, automates the data preparation workflow, and scales to big data scenarios. This is a data interpretation and analysis playbook how to overcome analytics from all the data at scale challenges designs pdf template with various stages. Focus and dispense information on three stages using this creative set, that comes with editable features. It contains large content boxes to add your information on topics like marketing, analysis, capabilities, service, databases, sources. You can also showcase facts, figures, and other relevant content using this PPT layout. Grab it now.


This template covers the solution for BI problems such as analytics transformation and business intelligence program. It also depicts that switching to next-generation analytics platform that gives business users data-driven insights. Presenting data interpretation and analysis playbook how to fix the business intelligence problem data analytics playbook sample pdf to provide visual cues and insights. Share and navigate important information on six stages that need your due attention. This template can be used to pitch topics like analytics, business intelligence, predictive analytics. In addtion, this PPT design contains high resolution images, graphics, etc, that are easily editable and available for immediate download.
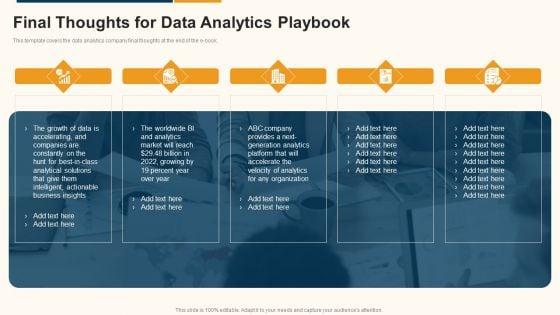
This template covers the data analytics company final thoughts at the end of the e-book. This is a data interpretation and analysis playbook final thoughts for data analytics playbook graphics pdf template with various stages. Focus and dispense information on five stages using this creative set, that comes with editable features. It contains large content boxes to add your information on topics like business, analytics, growth, organization. You can also showcase facts, figures, and other relevant content using this PPT layout. Grab it now.


This template covers the problems while implementing BI and predictive analytics in the organization. The challenges are undefined KPIs and metrics, and unable to hire right data science talent. Presenting data interpretation and analysis playbook business intelligence and predictive analytics challenges template pdf to provide visual cues and insights. Share and navigate important information on two stages that need your due attention. This template can be used to pitch topics like security vulnerabilities, operationalizing, perform analysis, deployed. In addtion, this PPT design contains high resolution images, graphics, etc, that are easily editable and available for immediate download.


This template covers the problems while implementing automated discovery of insights in the organization. The challenges are that traditional BI only succeeds when users know the right questions to ask and organizations are missing out on the hidden interpretation of the data, which might be useful. This is a data interpretation and analysis playbook automated discovery of insights challenges clipart pdf template with various stages. Focus and dispense information on two stages using this creative set, that comes with editable features. It contains large content boxes to add your information on topics like opportunities, organizations, business. You can also showcase facts, figures, and other relevant content using this PPT layout. Grab it now.


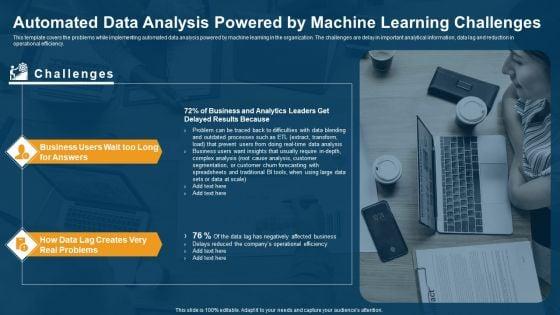
This template covers the problems while implementing automated data analysis powered by machine learning in the organization. The challenges are delay in important analytical information, data lag and reduction in operational efficiency. Presenting data interpretation and analysis playbook automated data analysis powered by machine learning challenges summary pdf to provide visual cues and insights. Share and navigate important information on two stages that need your due attention. This template can be used to pitch topics like operational, efficiency, business, analysis. In addtion, this PPT design contains high resolution images, graphics, etc, that are easily editable and available for immediate download.


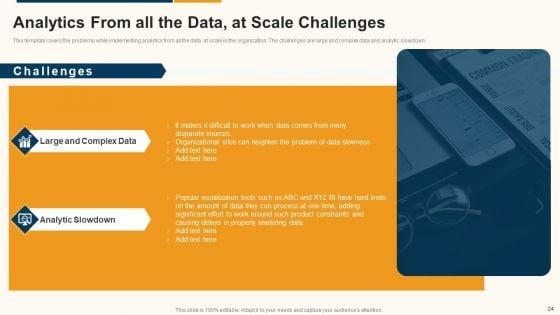
This template covers the problems while implementing analytics from all the data, at scale in the organization. The challenges are large and complex data and analytic slowdown. This is a data interpretation and analysis playbook analytics from all the data at scale challenges structure pdf template with various stages. Focus and dispense information on two stages using this creative set, that comes with editable features. It contains large content boxes to add your information on topics like large and complex data, analytic slowdown. You can also showcase facts, figures, and other relevant content using this PPT layout. Grab it now.
Presenting our innovatively structured data interpretation and analysis playbook icons slide for data interpretation and analysis playbook designs pdf set of slides. The slides contain a hundred percent editable icons. You can replace these icons without any inconvenience. Therefore, pick this set of slides and create a striking presentation.

Data Interpretation And Analysis Playbook Data Science Depends On Six Critical Elements Diagrams PDF
This template depicts that data science depends on six critical elements, including analytic opportunities, data, analytic techniques, people, technology, and culture, also known as ADAPT pluse C. Presenting data interpretation and analysis playbook data science depends on six critical elements diagrams pdf to provide visual cues and insights. Share and navigate important information on six stages that need your due attention. This template can be used to pitch topics like analytic opportunities, data, analytic techniques, people, technology, culture. In addtion, this PPT design contains high resolution images, graphics, etc, that are easily editable and available for immediate download.
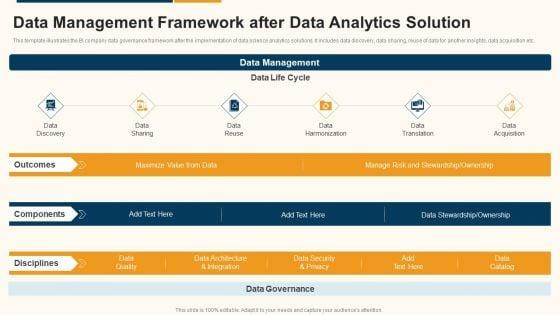

This template illustrates the BI company data governance framework after the implementation of data science analytics solutions. It includes data discovery, data sharing, reuse of data for another insights, data acquisition etc. This is a data interpretation and analysis playbook data management framework after data analytics solution structure pdf template with various stages. Focus and dispense information on six stages using this creative set, that comes with editable features. It contains large content boxes to add your information on topics like data discovery, data sharing, data reuse, data harmonization, data translation, data acquisition. You can also showcase facts, figures, and other relevant content using this PPT layout. Grab it now.
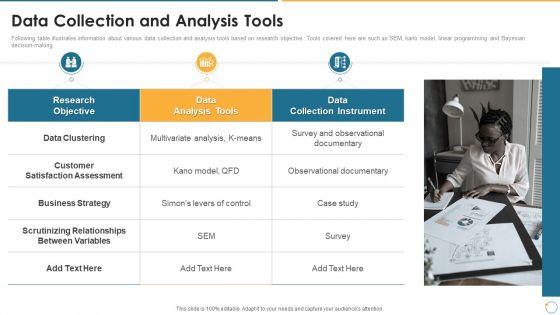

Following table illustrates information about various data collection and analysis tools based on research objective. Tools covered here are such as SEM, kano model, linear programming and Bayesian decision making. This is a collection of quality assurance ppt data collection and analysis tools background pdf template with various stages. Focus and dispense information on three stages using this creative set, that comes with editable features. It contains large content boxes to add your information on topics like data clustering, business strategy, data clustering, multivariate analysis. You can also showcase facts, figures, and other relevant content using this PPT layout. Grab it now.
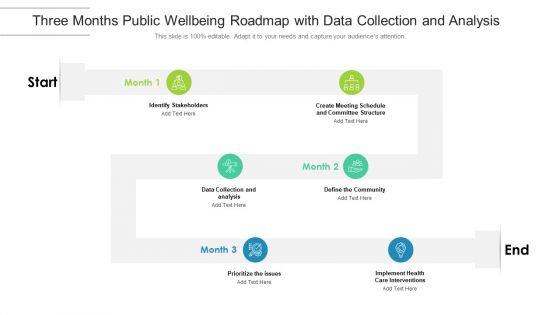

Presenting the three months public wellbeing roadmap with data collection and analysis guidelines. The template includes a roadmap that can be used to initiate a strategic plan. Not only this, the PowerPoint slideshow is completely editable and you can effortlessly modify the font size, font type, and shapes according to your needs. This PPT slide can be easily reached in standard screen and widescreen aspect ratios. The set is also available in various formats like PDF, PNG, and JPG. So download and use it multiple times as per your knowledge.
SHOW
- 60
- 120
- 180
DISPLAYING: 60 of 121 Item(s)
Page