AI PPT Maker
Templates
PPT Bundles
Design Services
Business PPTs
Business Plan
Management
Strategy
Introduction PPT
Roadmap
Self Introduction
Timelines
Process
Marketing
Agenda
Technology
Medical
Startup Business Plan
Cyber Security
Dashboards
SWOT
Proposals
Education
Pitch Deck
Digital Marketing
KPIs
Project Management
Product Management
Artificial Intelligence
Target Market
Communication
Supply Chain
Google Slides
Research Services
One Pagers
All Categories
Data Graphics PowerPoint Presentation Templates and Google Slides
53 Item(s)


Slide 1 of 3
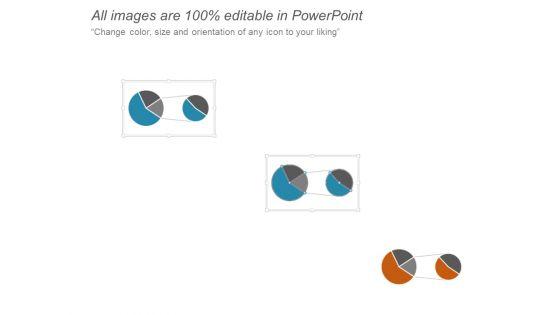
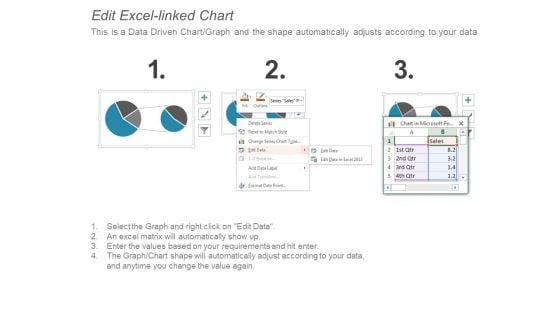
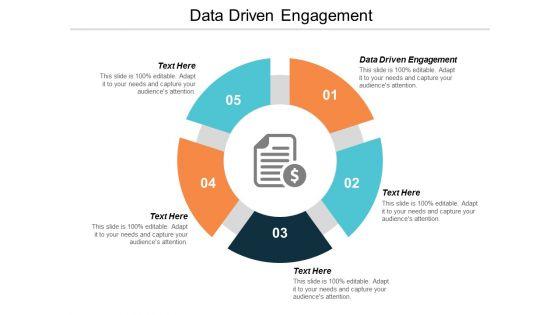
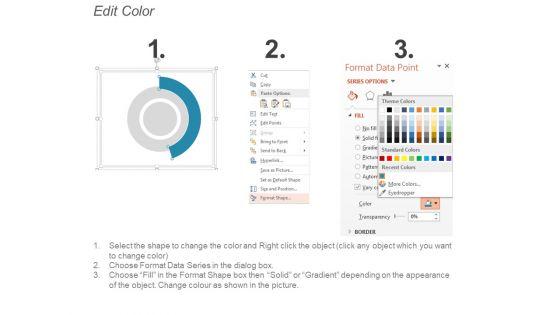
PowerPoint Data Driven Graphic Pie Drilled Down PPT Theme-The Circle of Life - a concept emmbedded in our minds and hence easy to comprehend. Life and Business is made up of processes comprising stages that flow from one to another. An excellent graphic to attract the attention of and understanding by your audience to improve earnings.-These amazing PowerPoint pre-designed slides and PowerPoint templates have been carefully created by our team of experts to help you impress your audience. Our stunning collection of Powerpoint slides are 100% editable and can easily fit in any PowerPoint presentations. By using these animations and graphics in PowerPoint and you can easily make professional presentations. Any text can be entered at any point in the PowerPoint template or slide. Just DOWNLOAD our awesome PowerPoint templates and you are ready to go. Our PowerPoint Data Driven Graphic Pie Drilled Down Ppt Theme are like an excellent buffet. An array of delicious dishes to choose from.


Slide 1 of 2
This slide outlines brief introduction of interview method for collecting data in market intelligence. It highlights various types of interviews such as structured interviews, unstructured interviews and semi structured interviews. Welcome to our selection of the Guidebook For Executing Business Market Intelligence Interview Method For Data Collection Graphics PDF. These are designed to help you showcase your creativity and bring your sphere to life. Planning and Innovation are essential for any business that is just starting out. This collection contains the designs that you need for your everyday presentations. All of our PowerPoints are 100 percent editable, so you can customize them to suit your needs. This multi purpose template can be used in various situations. Grab these presentation templates today.


Slide 1 of 2
This slide showcase the dashboard for big data analytics in healthcare. It includes elements such as bed occupancy rate, patient turnover rate, efficiency and costs, missed and cancelled appointment rate. Showcasing this set of slides titled Dashboard For Big Healthcare Data Analytics Graphics PDF. The topics addressed in these templates are Satisfaction Service Indicators, Occupancy, Forecasted Patient Turnover. All the content presented in this PPT design is completely editable. Download it and make adjustments in color, background, font etc. as per your unique business setting.


Slide 1 of 2
Outline Of Data Preprocessing Strategies And Importance The Five Ds Of Data Preparation Graphics PDF
This slide shows the five Ds of data preparation that are referred by the professionals to understand the ins and outs of data preparation process. Presenting Outline Of Data Preprocessing Strategies And Importance The Five Ds Of Data Preparation Graphics PDF to provide visual cues and insights. Share and navigate important information on five stages that need your due attention. This template can be used to pitch topics like Preparation Process, Data Quality, Data Collected During. In addtion, this PPT design contains high resolution images, graphics, etc, that are easily editable and available for immediate download.


Slide 1 of 2
This slide shows the fourth step that is involved in the data preparation process i.e. transform data along with the details. Presenting Outline Of Data Preprocessing Strategies And Importance Data Preparation Process Step 4 Transform Data Graphics PDF to provide visual cues and insights. Share and navigate important information on four stages that need your due attention. This template can be used to pitch topics like Data Transformation, Data Determines, Research Project. In addtion, this PPT design contains high resolution images, graphics, etc, that are easily editable and available for immediate download.


Slide 1 of 2
Persuade your audience using this Environmental Scanning Icon For Data Analysis Graphics PDF. This PPT design covers four stages, thus making it a great tool to use. It also caters to a variety of topics including Environmental Scanning Icon For Data Analysis. Download this PPT design now to present a convincing pitch that not only emphasizes the topic but also showcases your presentation skills.


Slide 1 of 2
This slide depicts the elements of data privacy, including individuals having the right to privacy and control over personal information, laws being followed, and processing data properly. This is a information privacy it elements of data privacy graphics pdf template with various stages. Focus and dispense information on seven stages using this creative set, that comes with editable features. It contains large content boxes to add your information on topics like elements of data privacy. You can also showcase facts, figures, and other relevant content using this PPT layout. Grab it now.


Slide 1 of 2
This slide describes the California Consumer Privacy Act, which allows people of California to inquire about their information. Presenting information privacy it ccpa law governing data privacy graphics pdf to provide visual cues and insights. Share and navigate important information on seven stages that need your due attention. This template can be used to pitch topics like ccpa law governing data privacy. In addtion, this PPT design contains high resolution images, graphics, etc, that are easily editable and available for immediate download.


Slide 1 of 2
Persuade your audience using this multi device cloud storage data management graphics pdf This PPT design covers four stages, thus making it a great tool to use. It also caters to a variety of topics including multi device cloud storage data management Download this PPT design now to present a convincing pitch that not only emphasizes the topic but also showcases your presentation skills.


Slide 1 of 2
This slide provides information about information security process in order to manage firms sensitive data in terms of firewall audit checklist, VPN configuration, penetrating testing. Deliver and pitch your topic in the best possible manner with this project security administration it information security process to manage firms sensitive data contd graphics pdf. Use them to share invaluable insights on firewall audit checklist, vpn configuration, penetrating testing and impress your audience. This template can be altered and modified as per your expectations. So, grab it now.


Slide 1 of 2
Presenting our innovatively-structured 6 months development and strategy roadmap for big data analysis graphics Template. Showcase your roadmap process in different formats like PDF, PNG, and JPG by clicking the download button below. This PPT design is available in both Standard Screen and Widescreen aspect ratios. It can also be easily personalized and presented with modified font size, font type, color, and shapes to measure your progress in a clear way.


Slide 1 of 2
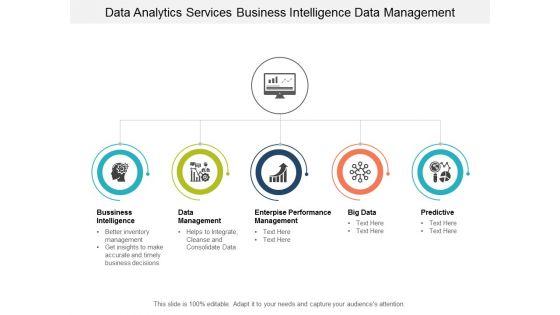
Presenting agenda for data management graphics pdf to provide visual cues and insights. Share and navigate important information on five stages that need your due attention. This template can be used to pitch topics like agenda. In addtion, this PPT design contains high resolution images, graphics, etc, that are easily editable and available for immediate download.


Slide 1 of 2
Deliver and pitch your topic in the best possible manner with this after hours trading competitive analysis financial and operational data graphics pdf. Use them to share invaluable insights on competitive factor, number of branches, interest rate and impress your audience. This template can be altered and modified as per your expectations. So, grab it now.


Slide 1 of 2
The slide provides the Competitive landscape of the company on the basis of financial data sales and profit and operational data employee count, locations, year of existence etc. Deliver and pitch your topic in the best possible manner with this mezzanine debt financing pitch deck competitive analysis by operational and financial data graphics pdf. Use them to share invaluable insights on sales, profit, product, service, interest rate and impress your audience. This template can be altered and modified as per your expectations. So, grab it now.


Slide 1 of 2
Presenting expert systems data integration model conceptual data graphics pdf to provide visual cues and insights. Share and navigate important information on one stages that need your due attention. This template can be used to pitch topics like data integration model. In addtion, this PPT design contains high-resolution images, graphics, etc, that are easily editable and available for immediate download.


Slide 1 of 2
The success rate of business plans is hugely dependent on the plan of action, and this editable half yearly roadmap timeline for data rationalization graphics rightly serves the purpose. Encapsulate all the information related to the project in a well structured manner to obtain maximum efficiency by incorporating our stunning PowerPoint theme. State the critical deliverable, steps involved, time frame, workforce allocation, and lots more in an easy to understand manner by utilizing this pre designed roadmap PowerPoint layout. You can also prioritize your tasks and discuss the problem areas with your colleagues by incorporating this tailor made PPT layout. Empower your work plan by employing this professionally designed PPT theme. Entrepreneurs can download half yearly roadmap timeline for data rationalization graphics as a beneficial communication tool that facilitates in collaborating with different tasks and achieve targets.


Slide 1 of 9
This slides signifies the application testing practises to increase data security. It covers information about steps like build secure environment, create team, simulate end user, adopt shifting left testing methodology and focus on regression testing. Presenting Software Testing Methodologies To Improve Data Security Graphics PDF to dispense important information. This template comprises six stages. It also presents valuable insights into the topics including Build Secure Testing Environment, Simulate End User Environment, Focus Regression Testing. This is a completely customizable PowerPoint theme that can be put to use immediately. So, download it and address the topic impactfully.


Slide 1 of 9
This slide depicts the overview of data provenance, including the type of questions it answers, such as the reason behind data generation, method of info generation, time of data generation, and the owner of the generated data. It also covers the provenance model in World Wide Web Consortium W3C. There are so many reasons you need a Comprehensive Analysis Of Different Data Lineage Classification Overview Of Data Provenance Graphics PDF. The first reason is you can not spend time making everything from scratch, Thus, Slidegeeks has made presentation templates for you too. You can easily download these templates from our website easily.


Slide 1 of 9
The following slide showcases steps to enhance strategic sourcing. The steps covered are purchasing data, create strategic procurement plan, analyze supplier market, define criteria, negotiation, incorporate new vendors and track performance. Persuade your audience using this Steps To Improve Strategic Resource Using Data Evaluation Graphics PDF. This PPT design covers seven stages, thus making it a great tool to use. It also caters to a variety of topics including Negotiation, Track Suppliers Performance, Define Criteria, Analyze Supplier Market, Incorporate New Suppliers. Download this PPT design now to present a convincing pitch that not only emphasizes the topic but also showcases your presentation skills.


Slide 1 of 9
Following slide exhibits automation process of shipment data processing. Purpose of this slide is to assure proper track and update of shipment status using automation tools. It include steps such as get excel files, update excel data, open to run system, navigate right menu etc. Showcasing this set of slides titled Robotics Process Automation In Supply Chain Process For Processing Shipment Data Graphics PDF. The topics addressed in these templates are Automated Steps, Acquire Excel Data Sheets, Update Excel Data. All the content presented in this PPT design is completely editable. Download it and make adjustments in color, background, font etc. as per your unique business setting.


Slide 1 of 9
The firm will explore various essential attributes of customer data in terms of demographic data, behavior data, etc. The available data is analyzed per user basis. This Data Monetization And Management Identifying Essential Attributes From Customer Data Graphics PDF is perfect for any presentation, be it in front of clients or colleagues. It is a versatile and stylish solution for organizing your meetings. The Data Monetization And Management Identifying Essential Attributes From Customer Data Graphics PDF features a modern design for your presentation meetings. The adjustable and customizable slides provide unlimited possibilities for acing up your presentation. Slidegeeks has done all the homework before launching the product for you. So, dont wait, grab the presentation templates today


Slide 1 of 9
This slide explains why you should choose us, including faster product delivery to market, decreased complexity, and secured integrations. Slidegeeks is here to make your presentations a breeze with Information Security Why Choose Us For Data Privacy Graphics PDF With our easy to use and customizable templates, you can focus on delivering your ideas rather than worrying about formatting. With a variety of designs to choose from, you are sure to find one that suits your needs. And with animations and unique photos, illustrations, and fonts, you can make your presentation pop. So whether you are giving a sales pitch or presenting to the board, make sure to check out Slidegeeks first.


Slide 1 of 9
Do you have to make sure that everyone on your team knows about any specific topic. I yes, then you should give Data Structure IT Characteristics And Advantages Of Logical Data Structure Graphics PDF a try. Our experts have put a lot of knowledge and effort into creating this impeccable Data Structure IT Characteristics And Advantages Of Logical Data Structure Graphics PDF. You can use this template for your upcoming presentations, as the slides are perfect to represent even the tiniest detail. You can download these templates from the Slidegeeks website and these are easy to edit. So grab these today.


Slide 1 of 9
This slide shows the roadmap of essential considerations for performing data analytics in business. Find a pre-designed and impeccable Data Evaluation And Processing Toolkit Key Consideration To Implement Data Analytics Graphics PDF. The templates can ace your presentation without additional effort. You can download these easy-to-edit presentation templates to make your presentation stand out from others. So, what are you waiting for Download the template from Slidegeeks today and give a unique touch to your presentation.


Slide 1 of 9
This slide depicts the doubly linked list in the linked data structure, including its representation and basic operations, such as insertion, deletion, insert last, delete last, insert after, delete, display forward, and display backward. Presenting Data Structure Doubly Linked List Associated Data IT Graphics PDF to provide visual cues and insights. Share and navigate important information on five stages that need your due attention. This template can be used to pitch topics like Information, Doubly Linked List, Data Structure. In addtion, this PPT design contains high resolution images, graphics, etc, that are easily editable and available for immediate download.


Slide 1 of 9
This slide depicts the business best practices to implement a data warehouse, including describing the required data, team building, prioritizing data warehouse applications, etc.Presenting Management Information System Business Best Practices To Implement Data Warehouse Graphics PDF to provide visual cues and insights. Share and navigate important information on six stages that need your due attention. This template can be used to pitch topics like Warehouse Applications, Prioritization Data, Choose A Reliable. In addtion, this PPT design contains high resolution images, graphics, etc, that are easily editable and available for immediate download.


Slide 1 of 9
This slide depicts the bottom-up design approach of the data warehouse and how data mart is built firstly in this approach to satisfy specific business operation needs.Deliver an awe inspiring pitch with this creative Management Information System Bottom Up Design Approach Data Warehouse Graphics PDF bundle. Topics like Extract Transform, Conformed Dimensions, Bottom Approach can be discussed with this completely editable template. It is available for immediate download depending on the needs and requirements of the user.


Slide 1 of 9
This slide represents the maturity stages of the data lake, including handling and ingesting data at scale, building the analytical muscle, EDW and data lake work in unison, and enterprise capability in the lake. Presenting Data Lake Development With Azure Cloud Software Overview Of Maturity Stages Of Data Lake Graphics PDF to provide visual cues and insights. Share and navigate important information on four stages that need your due attention. This template can be used to pitch topics like Analysis Capabilities, Warehouse, Enterprise. In addtion, this PPT design contains high resolution images, graphics, etc, that are easily editable and available for immediate download.


Slide 1 of 9
This slide represents the data lake foundation elements such as data lake provisioning, data ingestion sources, landing zones, processing zone, analytics zone, insight zone, and data lake decommissioning. This is a Data Lake Development With Azure Cloud Software Foundational Elements Of Centralized Repository Data Lake Graphics PDF template with various stages. Focus and dispense information on seven stages using this creative set, that comes with editable features. It contains large content boxes to add your information on topics like Analytics Zone, Data Ingestion Sources, Data Lake Provisioning. You can also showcase facts, figures, and other relevant content using this PPT layout. Grab it now.


Slide 1 of 9
Identifying the data which needs to be migrated to a cloud server is a key step in the process of digital transformation. Purpose of the following slide is to show the key sources through which the data is selected. These data sources can be product website data, customer relationship data and enterprise management data etc. This is a Digitalization Of Transportation Enterprise Identifying The Data Sources Graphics PDF template with various stages. Focus and dispense information on four stages using this creative set, that comes with editable features. It contains large content boxes to add your information on topics like Product Website Data, Enterprise Resource Management, Customer Relationship Management. You can also showcase facts, figures, and other relevant content using this PPT layout. Grab it now.


Slide 1 of 9
This is a Table Of Contents Information Analytics And Ml Strategy Playbook Data Graphics PDF template with various stages. Focus and dispense information on one stages using this creative set, that comes with editable features. It contains large content boxes to add your information on topics like Automated Data Analysis, Strategy Playbook, Information. You can also showcase facts, figures, and other relevant content using this PPT layout. Grab it now.


Slide 1 of 9
This slide represents the securing information in big data challenge of big data and solutions to this challenge, such as encryption data, separation of data, security monitoring in real-time, and so on.Deliver an awe inspiring pitch with this creative Big Data Architect Security Of Information In Big Data Graphics PDF bundle. Topics like Most Challenging, Securing Massive, Data Collections can be discussed with this completely editable template. It is available for immediate download depending on the needs and requirements of the user.


Slide 1 of 9
This slide represents the 30 60 90 days plan for big data implementation by representing the tasks performed in 30 days, 60 days, and 90 days intervals.This is a 30 60 90 Days Plan For Big Data Management Graphics PDF template with various stages. Focus and dispense information on three stages using this creative set, that comes with editable features. It contains large content boxes to add your information on topics like Data Architecture, Integrating Big, Applications Systems. You can also showcase facts, figures, and other relevant content using this PPT layout. Grab it now.


Slide 1 of 9
This slide depicts the schemas in data warehouses such as star schema and snowflake schema and how they store information within a data warehouse.Deliver an awe inspiring pitch with this creative Executive Information Database System Schemas In Data Warehouses Graphics PDF bundle. Topics like Denormalized Dimension, Snowflake Schema, Expense Query can be discussed with this completely editable template. It is available for immediate download depending on the needs and requirements of the user.


Slide 1 of 2
This template covers dashboard to measure and analyze target marketing campaign performance. It also helps in tracking and reporting online and offline marketing campaigns through KPIs such as traffic sources, lead generation metrics, offline product sales, store visitations, customer acquisition, and offline retention and advocacy. If you are looking for a format to display your unique thoughts, then the professionally designed Analyze Online And Offline Marketing Campaigns Data Graphics PDF is the one for you. You can use it as a Google Slides template or a PowerPoint template. Incorporate impressive visuals, symbols, images, and other charts. Modify or reorganize the text boxes as you desire. Experiment with shade schemes and font pairings. Alter, share or cooperate with other people on your work. Download Analyze Online And Offline Marketing Campaigns Data Graphics PDF and find out how to give a successful presentation. Present a perfect display to your team and make your presentation unforgettable.


Slide 1 of 9
Find a pre designed and impeccable Agenda For Predictive Analytics In The Age Of Big Data Graphics PDF. The templates can ace your presentation without additional effort. You can download these easy to edit presentation templates to make your presentation stand out from others. So, what are you waiting for Download the template from Slidegeeks today and give a unique touch to your presentation.


Slide 1 of 9
Following slide highlights the use of splunk big data for improving supply chain. The purpose of this slide is to help organizations make better decisions and improve overall efficiency. It includes elements such as real-time visibility, demand forecasting, risk mitigation, etc. Showcasing this set of slides titled Supply Chain Optimization With Splunk Big Data Graphics Pdf The topics addressed in these templates are Real-Time Visibility, Demand Forecasting, Risk Mitigation All the content presented in this PPT design is completely editable. Download it and make adjustments in color, background, font etc. as per your unique business setting. Following slide highlights the use of splunk big data for improving supply chain. The purpose of this slide is to help organizations make better decisions and improve overall efficiency. It includes elements such as real-time visibility, demand forecasting, risk mitigation, etc.


Slide 1 of 9
This slide covers procedure of performing qualitative analysis. The purpose of this slide is to draw useful insights by conducting research and analyzing data. It includes various steps such as gathering feedback, coding comments, running queries and reporting. Showcasing this set of slides titled Four Step Evaluation To Conduct Qualitative Data Graphics Pdf The topics addressed in these templates are Gather Feedback, Coding Comments, Run Queries All the content presented in this PPT design is completely editable. Download it and make adjustments in color, background, font etc. as per your unique business setting. This slide covers procedure of performing qualitative analysis. The purpose of this slide is to draw useful insights by conducting research and analyzing data. It includes various steps such as gathering feedback, coding comments, running queries and reporting.


Slide 1 of 9
The following slide represents the stages of big data processing which assists the organizations to harness the data and use it to identify new opportunities. It also includes drawing the data, data modification, data sorting, BI analytics, machine learning application etc. Showcasing this set of slides titled Five Key Stages Of Big Data Processing Graphics Pdf The topics addressed in these templates are Drawing The Data, Data Modification, Data Loading All the content presented in this PPT design is completely editable. Download it and make adjustments in color, background, font etc. as per your unique business setting. The following slide represents the stages of big data processing which assists the organizations to harness the data and use it to identify new opportunities. It also includes drawing the data, data modification, data sorting, BI analytics, machine learning application etc.


Slide 1 of 9
This slide represents the timeline to implement data model, including key approaches such as checking for data mismatch, visualizing the to be model, using necessary data, etc. The best PPT templates are a great way to save time, energy, and resources. Slidegeeks have 100 percent editable powerpoint slides making them incredibly versatile. With these quality presentation templates, you can create a captivating and memorable presentation by combining visually appealing slides and effectively communicating your message. Download Database Modeling Timeline To Implement Data Model Graphics Pdf from Slidegeeks and deliver a wonderful presentation. This slide represents the timeline to implement data model, including key approaches such as checking for data mismatch, visualizing the to be model, using necessary data, etc.


Slide 1 of 9
This slide shows the overview of physical model with its cardinality and relations in a more specific manner. It also contains block diagram of physical data model with customer, product, sales, and store entities. Make sure to capture your audiences attention in your business displays with our gratis customizable Database Modeling Phase 3 Physical Data Model Graphics Pdf. These are great for business strategies, office conferences, capital raising or task suggestions. If you desire to acquire more customers for your tech business and ensure they stay satisfied, create your own sales presentation with these plain slides. This slide shows the overview of physical model with its cardinality and relations in a more specific manner. It also contains block diagram of physical data model with customer, product, sales, and store entities.


Slide 1 of 9
This slide represents the difference between main models of data modeling, such as conceptual, logical, and physical. The comparison is based on features covering entity names, relationships, attributes, primary and foreign keys, and so on. There are so many reasons you need a Database Modeling Comparison Between Conceptual Logical Physical Data Graphics Pdf. The first reason is you can not spend time making everything from scratch, Thus, Slidegeeks has made presentation templates for you too. You can easily download these templates from our website easily. This slide represents the difference between main models of data modeling, such as conceptual, logical, and physical. The comparison is based on features covering entity names, relationships, attributes, primary and foreign keys, and so on.


Slide 1 of 9
This slide showcases various methods to collect data which are subscription and registration data, in store traffic monitoring, forms, transactional data and observations. Its purpose is to ensure reliable data is gathered for statistical analysis. Here you can discover an assortment of the finest PowerPoint and Google Slides templates. With these templates, you can create presentations for a variety of purposes while simultaneously providing your audience with an eye catching visual experience. Download Other Methods Data Collection Marketing Intelligence Guide Data Gathering Graphics Pdf to deliver an impeccable presentation. These templates will make your job of preparing presentations much quicker, yet still, maintain a high level of quality. Slidegeeks has experienced researchers who prepare these templates and write high quality content for you. Later on, you can personalize the content by editing the Other Methods Data Collection Marketing Intelligence Guide Data Gathering Graphics Pdf. This slide showcases various methods to collect data which are subscription and registration data, in store traffic monitoring, forms, transactional data and observations. Its purpose is to ensure reliable data is gathered for statistical analysis.


Slide 1 of 9
The following slide showcases various sources of market intelligence which are customer insights, market understanding, competitive intelligence and product intelligence. It is done to gain better understanding of market position and conduct competitive research. Whether you have daily or monthly meetings, a brilliant presentation is necessary. Elements Of Market Intelligence Marketing Intelligence Guide Data Gathering Graphics Pdf can be your best option for delivering a presentation. Represent everything in detail using Elements Of Market Intelligence Marketing Intelligence Guide Data Gathering Graphics Pdf and make yourself stand out in meetings. The template is versatile and follows a structure that will cater to your requirements. All the templates prepared by Slidegeeks are easy to download and edit. Our research experts have taken care of the corporate themes as well. So, give it a try and see the results. The following slide showcases various sources of market intelligence which are customer insights, market understanding, competitive intelligence and product intelligence. It is done to gain better understanding of market position and conduct competitive research.


Slide 1 of 9
This slide shows the overview of network data modeling technique and also explains the structure of network data model. The purpose of this slide is to explain the relationships connection between two entities of the table. Slidegeeks is here to make your presentations a breeze with Data Modeling Approaches For Modern Analytics Introduction To Network Data Modeling Graphics Pdf With our easy to use and customizable templates, you can focus on delivering your ideas rather than worrying about formatting. With a variety of designs to choose from, you are sure to find one that suits your needs. And with animations and unique photos, illustrations, and fonts, you can make your presentation pop. So whether you are giving a sales pitch or presenting to the board, make sure to check out Slidegeeks first This slide shows the overview of network data modeling technique and also explains the structure of network data model. The purpose of this slide is to explain the relationships connection between two entities of the table.


Slide 1 of 9
This slide describes the tools and processes for the data stewardship program covering functions, symptoms, causes and solutions. The functions include naming data, defining data, designing data, managing data quality, and integrating data. This Data Stewardship In Business Processes Tools And Processes For Data Stewardship Graphics Pdf is perfect for any presentation, be it in front of clients or colleagues. It is a versatile and stylish solution for organizing your meetings. The Data Stewardship In Business Processes Tools And Processes For Data Stewardship Graphics Pdf features a modern design for your presentation meetings. The adjustable and customizable slides provide unlimited possibilities for acing up your presentation. Slidegeeks has done all the homework before launching the product for you. So, do not wait, grab the presentation templates today This slide describes the tools and processes for the data stewardship program covering functions, symptoms, causes and solutions. The functions include naming data, defining data, designing data, managing data quality, and integrating data.


Slide 1 of 9
This slide talks about the business or functional data steward, including critical characteristics and considerations. It also contains examples of these data stewards, such as sales data stewards, marketing data stewards, and business and data analysts. Retrieve professionally designed Data Stewardship In Business Processes Business Or Functional Data Steward Graphics Pdf to effectively convey your message and captivate your listeners. Save time by selecting pre made slideshows that are appropriate for various topics, from business to educational purposes. These themes come in many different styles, from creative to corporate, and all of them are easily adjustable and can be edited quickly. Access them as PowerPoint templates or as Google Slides themes. You do not have to go on a hunt for the perfect presentation because Slidegeeks got you covered from everywhere. This slide talks about the business or functional data steward, including critical characteristics and considerations. It also contains examples of these data stewards, such as sales data stewards, marketing data stewards, and business and data analysts.


Slide 1 of 9
This slide outlines the advantages of the project oriented data stewardship model, including implementing data stewardship for a particular projects desired objective and then enhanced for a wider level, data stewardship and project success are inter connected, and so on. Explore a selection of the finest Data Stewardship In Business Processes Benefits Project Oriented Data Graphics Pdf here. With a plethora of professionally designed and pre made slide templates, you can quickly and easily find the right one for your upcoming presentation. You can use our Data Stewardship In Business Processes Benefits Project Oriented Data Graphics Pdf to effectively convey your message to a wider audience. Slidegeeks has done a lot of research before preparing these presentation templates. The content can be personalized and the slides are highly editable. Grab templates today from Slidegeeks. This slide outlines the advantages of the project oriented data stewardship model, including implementing data stewardship for a particular projects desired objective and then enhanced for a wider level, data stewardship and project success are inter connected, and so on.


Slide 1 of 9
Mentioned slide illustrates six steps of diverse data collection process which can be used by managers to increase business productivity. It includes steps such as communicate about data collection, setting baseline evidence, identify measurable goals, report on trend, determine reporting points and diversity data analysis. Persuade your audience using this Six Step Process For Collection Of Workplace Diversity Data Graphics PDF. This PPT design covers six stages, thus making it a great tool to use. It also caters to a variety of topics including Baseline Evidence Setting, Diversity Data Analysis, Determine Necessary Reporting Points. Download this PPT design now to present a convincing pitch that not only emphasizes the topic but also showcases your presentation skills.


Slide 1 of 2
This slide covers contact center team performance metrics KPI dashboard. It involves details such as resolutions, response time, call data management and daily response time. Showcasing this set of slides titled Call Center Kpis Dashboard With Data Graphics PDF. The topics addressed in these templates are Response Time, Data Management, Resolution Rate. All the content presented in this PPT design is completely editable. Download it and make adjustments in color, background, font etc. as per your unique business setting.


Slide 1 of 9
The slide carries a maturity table highlighting the training plan for data management. Various elements included are training , start week, end week and resource name Presenting Maturity Priority Planning Chart For Data Management Graphics PDF to dispense important information. This template comprises one stages. It also presents valuable insights into the topics including Data Management, Resource, Maturity Priority Planning. This is a completely customizable PowerPoint theme that can be put to use immediately. So, download it and address the topic impactfully.


Slide 1 of 9
Persuade your audience using this Internet Of Things Technology Icon For Patient Data Transfer Graphics PDF. This PPT design covers three stages, thus making it a great tool to use. It also caters to a variety of topics including Internet Of Things Technology, Icon Patient Data Transfer. Download this PPT design now to present a convincing pitch that not only emphasizes the topic but also showcases your presentation skills.


Slide 1 of 9
This slide represents the data management component of grid computing that is essential for grid environments. It is used for safe and reliable transmission or for making information available to other nodes within a grid. This modern and well arranged Grid Computing For High Performance Solutions Key Components Of Grid Computing Data Graphics PDF provides lots of creative possibilities. It is very simple to customize and edit with the Powerpoint Software. Just drag and drop your pictures into the shapes. All facets of this template can be edited with Powerpoint no extra software is necessary. Add your own material, put your images in the places assigned for them, adjust the colors, and then you can show your slides to the world, with an animated slide included.
53 Item(s)