AI PPT Maker
Templates
PPT Bundles
Design Services
Business PPTs
Business Plan
Management
Strategy
Introduction PPT
Roadmap
Self Introduction
Timelines
Process
Marketing
Agenda
Technology
Medical
Startup Business Plan
Cyber Security
Dashboards
SWOT
Proposals
Education
Pitch Deck
Digital Marketing
KPIs
Project Management
Product Management
Artificial Intelligence
Target Market
Communication
Supply Chain
Google Slides
Research Services
 One Pagers
All Categories
Data templates PowerPoint Presentation Templates and Google Slides
SHOW
- 60
- 120
- 180
DISPLAYING: 60 of 1452 Item(s)
Page













Slide 1 of 36
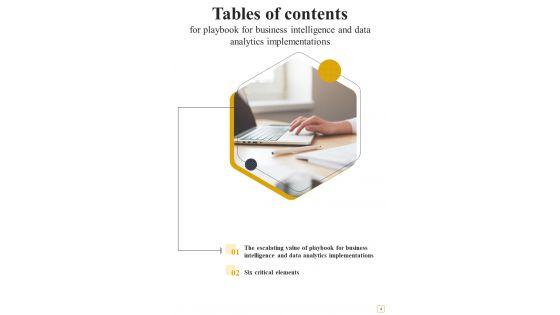
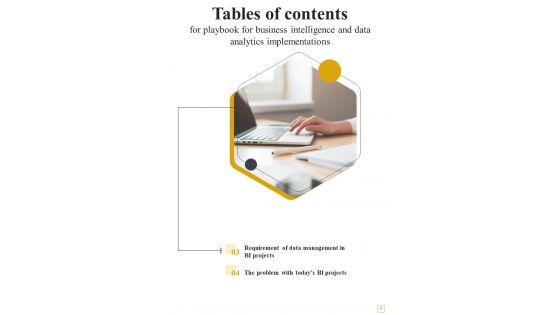
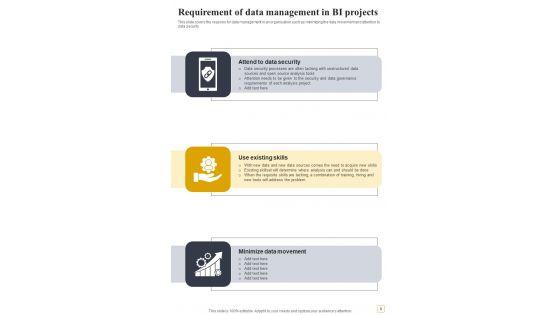
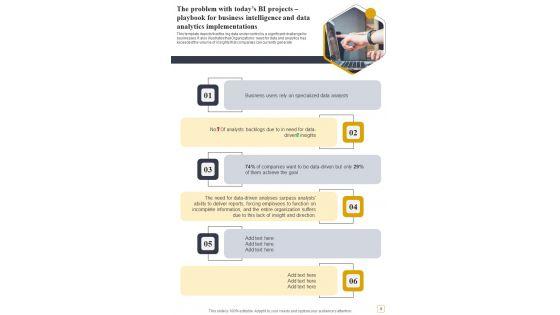
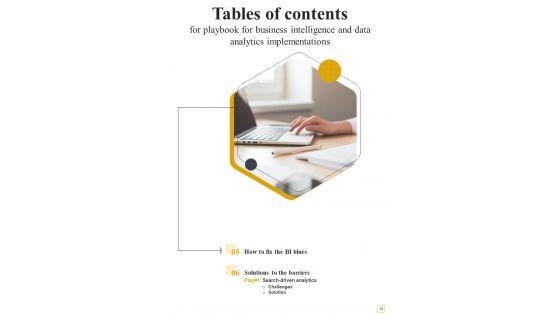
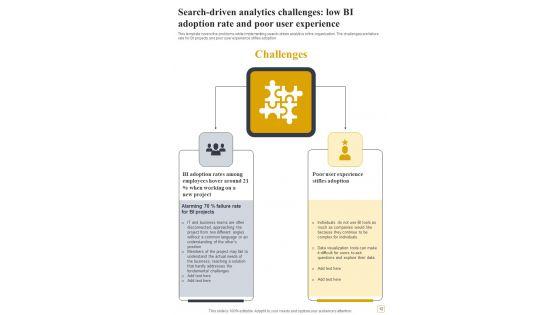
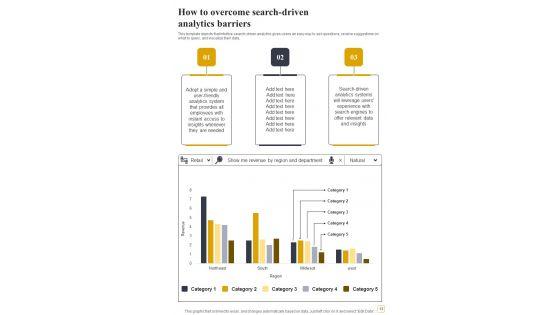
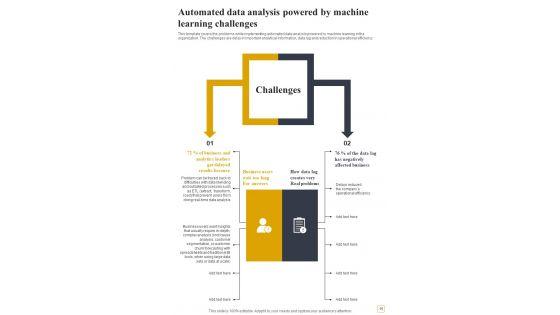
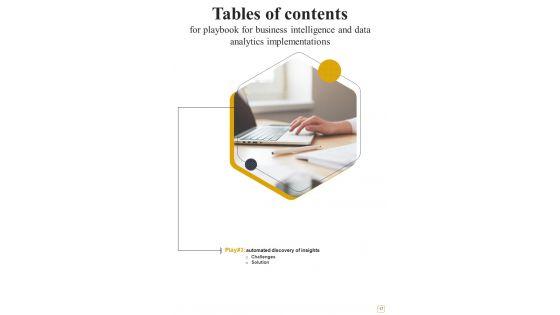
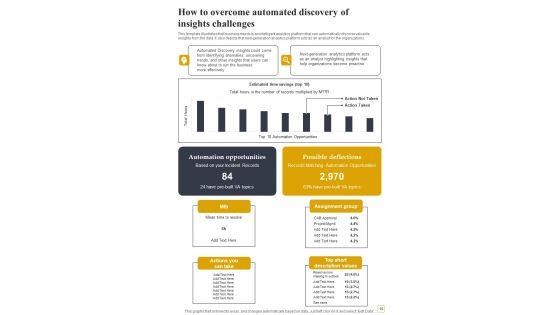
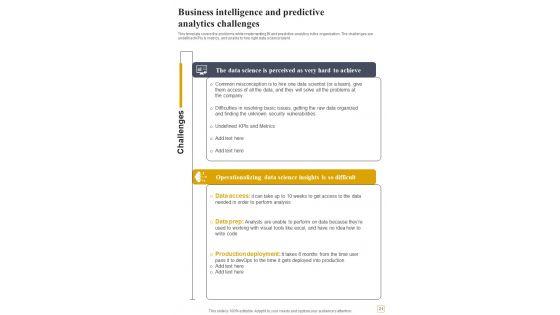
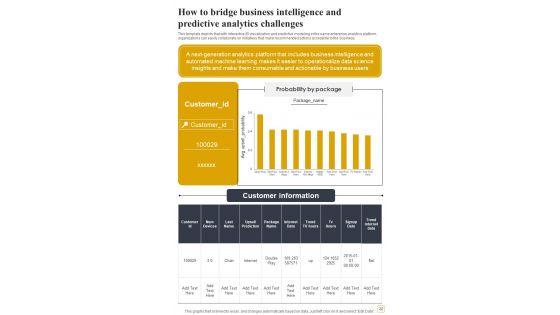
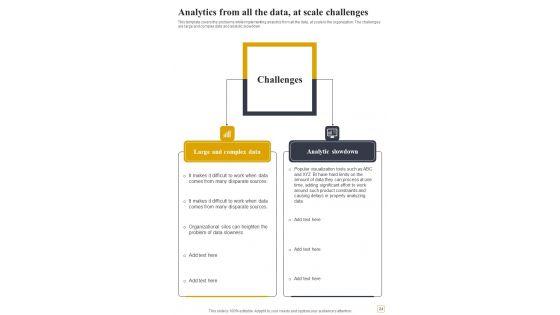
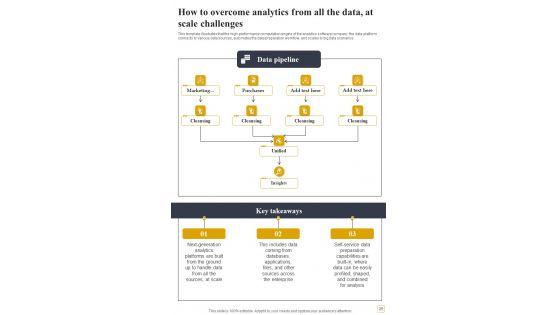
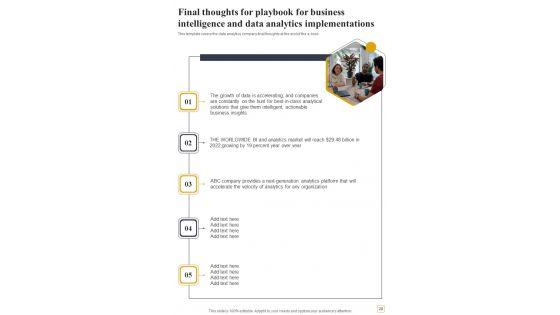
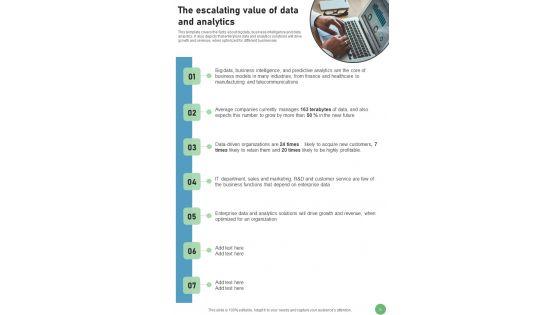
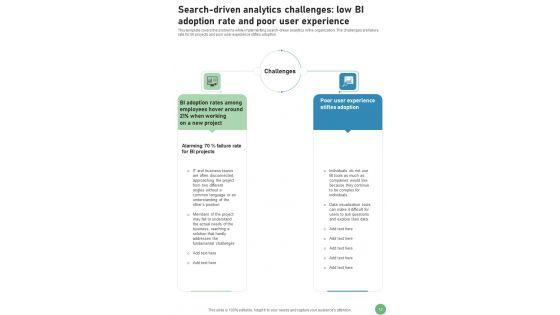
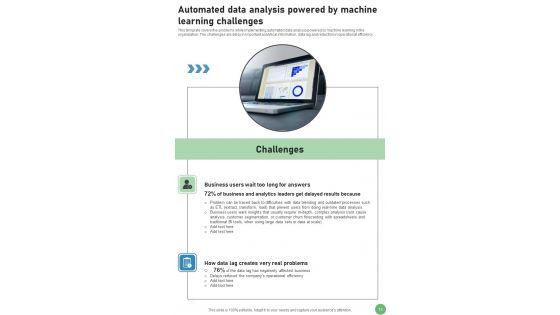
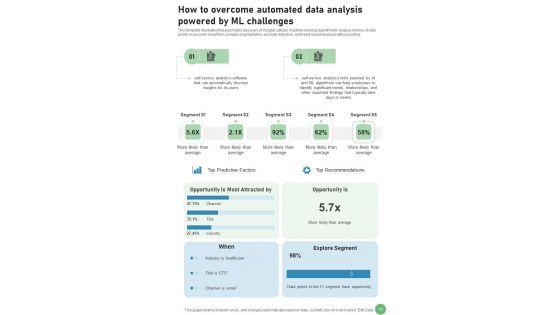
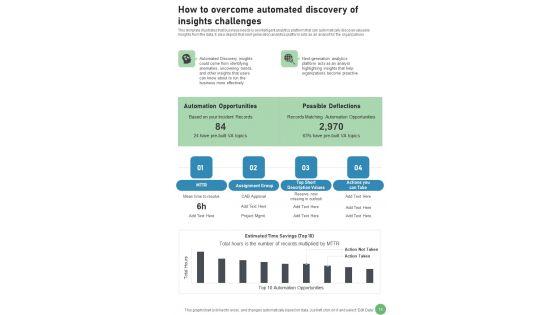
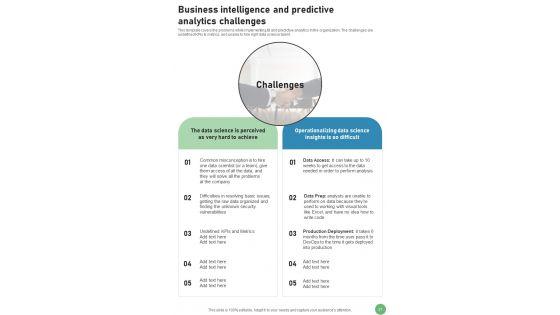
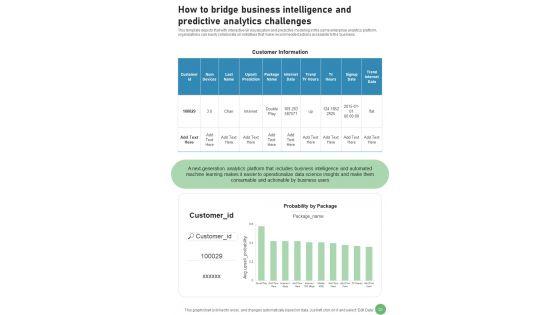
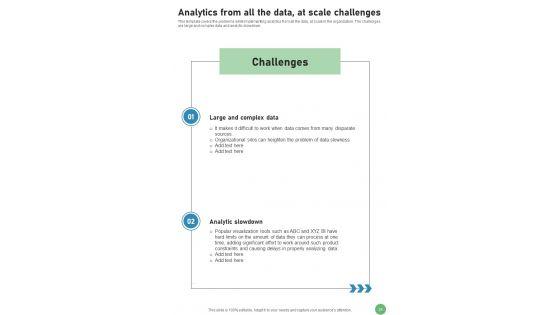
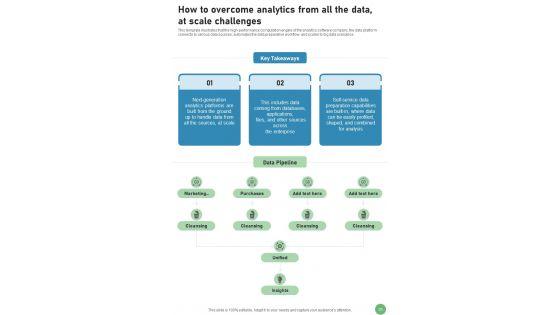
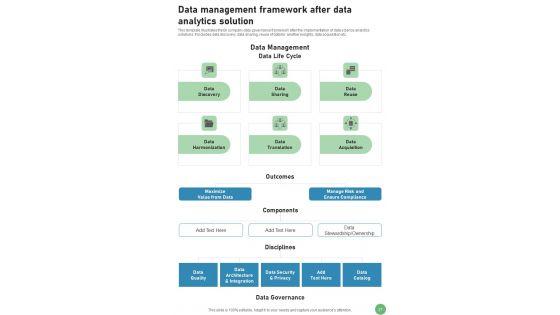
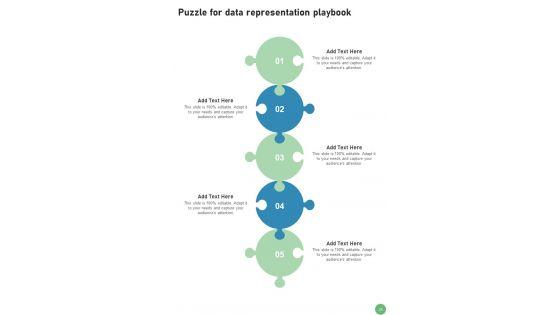
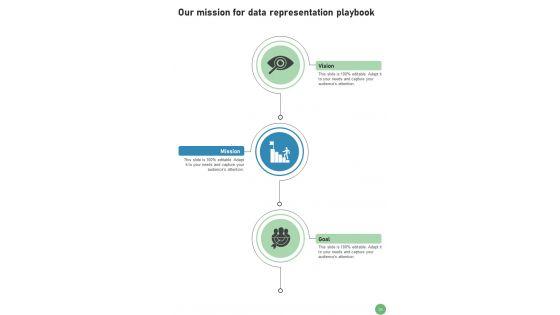
Are you tired of boring presentations that fail to captivate your audience Look no further than our Playbook For Business Intelligence And Data Analytics Implementations Template. It is designed to impress and capture attention. With 100 percent editable slides and visually-stunning graphics, you will be able to create presentations that wow. Do not settle for mediocrity, elevate your game with our A4 Playbook PPT Template.












Slide 1 of 36
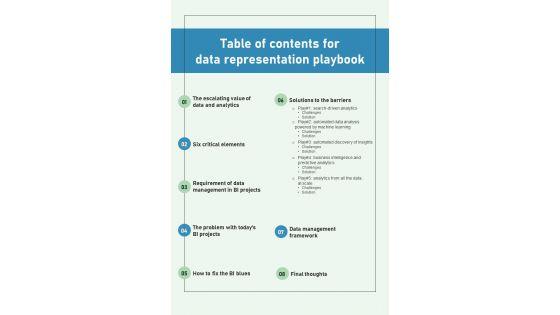
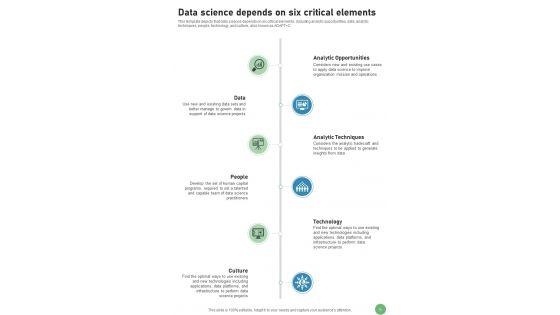
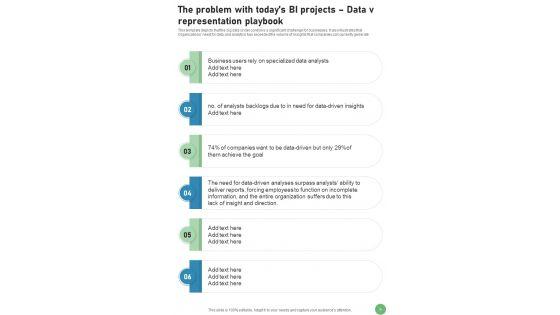
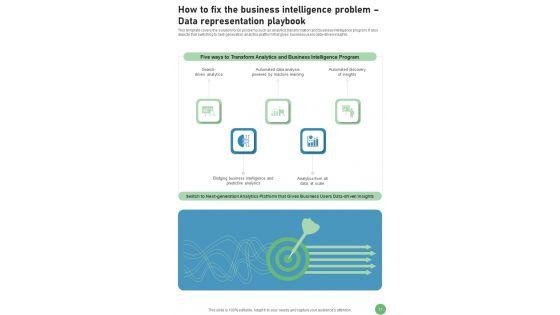
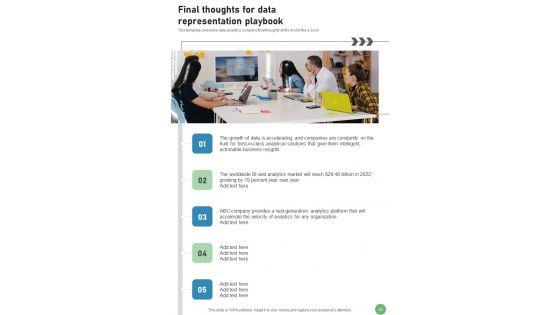
Create winning presentations effortlessly with our Data Representation Playbook Template. Designed to impress, each template is 100 percent editable, visually-stunning, and easy-to-use. Our team of researchers has meticulously crafted the right content for each template, so you do not have to worry about anything. Just select the perfect template for your project, personalize it, and deliver a memorable presentation that leaves a lasting impact.




Slide 1 of 7
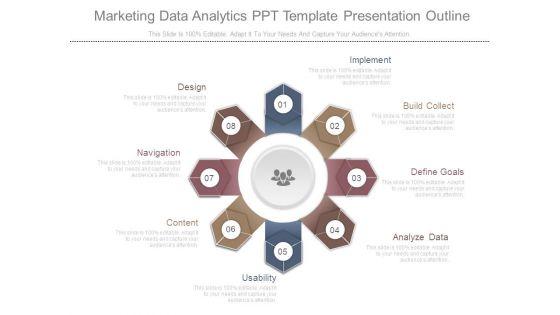
This is a marketing data analytics ppt template presentation outline. This is a eight stage process. The stages in this process are design, navigation, content, usability, analyze data, define goals, build collect, implement.



Slide 1 of 7
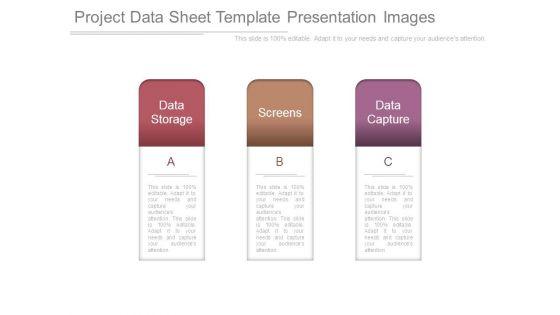
This is a project data sheet template presentation images. This is a three stage process. The stages in this process are data storage, screens, data capture.


Slide 1 of 7
This is a strategic data management template powerpoint slide show. This is a six stage process. The stages in this process are research, analysis, execution and deployment, quality and monitoring, coding, data entry.



Slide 1 of 7
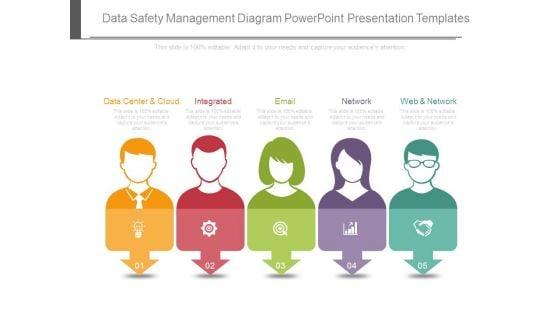
This is a data safety management diagram powerpoint presentation templates. This is a five stage process. The stages in this process are data center and cloud, integrated, email, network, web and network.




Slide 1 of 7
This is a company data model diagram powerpoint slide templates download. This is a eight stage process. The stages in this process are txn and operational, distribution and subscription services, master data management, down stream applications, enterprise data model, information value chain analysis, data delivery architecture, security architecture.

Slide 1 of 7
This is a big data risk management template ppt sample presentations. This is a eight stage process. The stages in this process are understanding social context and meaning, semantic, optimizing systems, prescriptive, business intelligence, predictive, forecasting and probabilities.


Slide 1 of 7
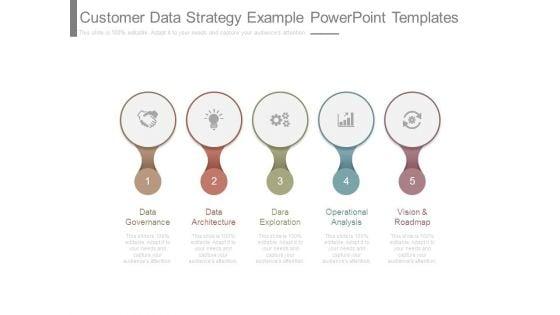
This is a customer data strategy example powerpoint templates. This is a five stage process. The stages in this process are data governance, data architecture, data exploration, operational analysis, vision and roadmap.



Slide 1 of 7
This is a data driven insights template powerpoint slides templates. This is a five stage process. The stages in this process are choosing the right data, identify customer behavior, collaborating throughout, annalise credit risk, involving creative agencies.



Slide 1 of 7
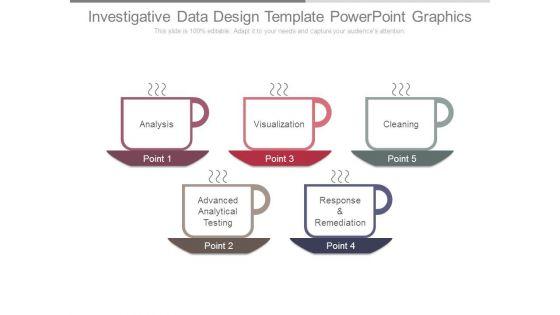
This is a investigative data design template powerpoint graphics. This is a five stage process. The stages in this process are analysis, visualization, cleaning, response and remediation, advanced analytical testing.




Slide 1 of 7
This is a data security challenges template powerpoint templates. This is a four stage process. The stages in this process are policy compliance, data management, data privacy, infrastructure security.
Slide 1 of 7
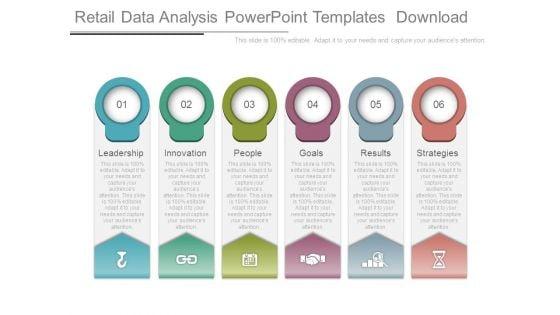
This is a retail data analysis powerpoint templates download. This is a six stage process. The stages in this process are leadership, innovation, people, goals, results, strategies.

Slide 1 of 7
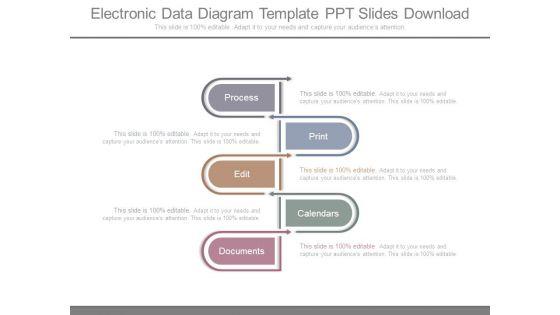
This is a electronic data diagram template ppt slides download. This is a five stage process. The stages in this process are process, print, calendars, edit, documents.


Slide 1 of 7
This is a adaptive data quality framework sample diagram powerpoint templates. This is a three stage process. The stages in this process are review, assess, analyse, summaries, plan, execute, resolve, verify, prevent, monitor, govern, refine.




Slide 1 of 7
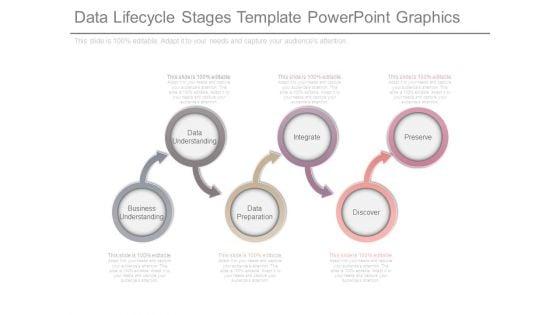
This is a data lifecycle stages template powerpoint graphics. This is a six stage process. The stages in this process are data understanding, business understanding, data preparation, integrate, discover, preserve.
Slide 1 of 7
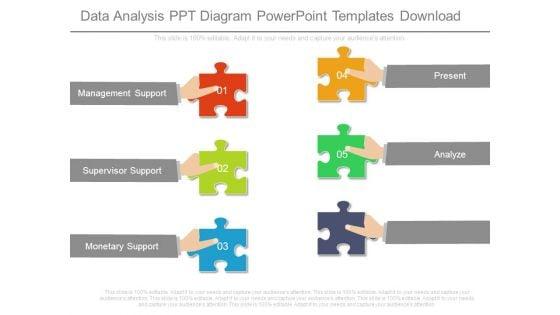
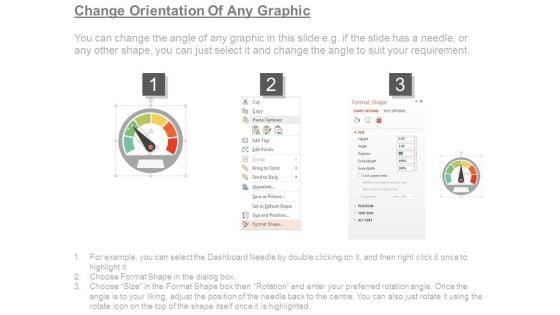
This is a data analysis ppt diagram powerpoint templates download. This is a five stage process. The stages in this process are management support, supervisor support, monetary support, present, analyze.




Slide 1 of 7
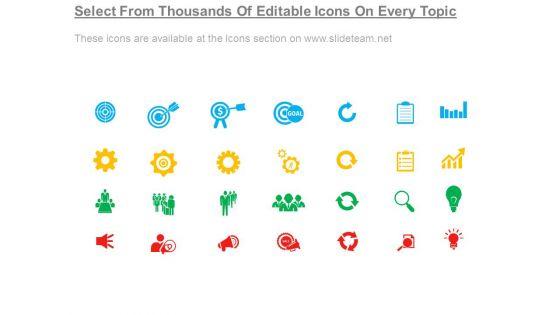
This is a consumer marketing data template presentation images. This is a six stage process. The stages in this process are customer analytics, promotion information, customer communications, geodmographic information, customer experience, product information.


Slide 1 of 7
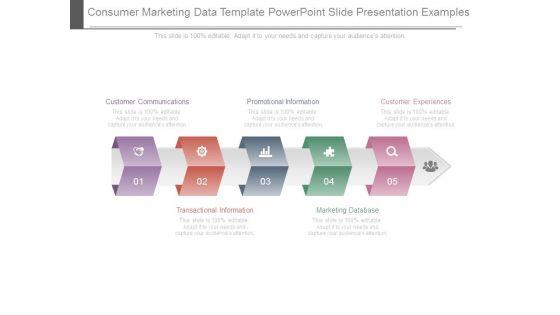
This is a consumer marketing data template powerpoint slide presentation examples. This is a five stage process. The stages in this process are customer communications, promotional information, customer experiences, transactional information, marketing database.


Slide 1 of 7
This is a data wrangler template layout presentation graphics. This is a four stage process. The stages in this process are analysis, data preparation, modeling, validation.


Slide 1 of 7
This is a data archeology template diagram presentation pictures. This is a five stage process. The stages in this process are volume, data mapping, variety, veracity, data profiling.



Slide 1 of 7
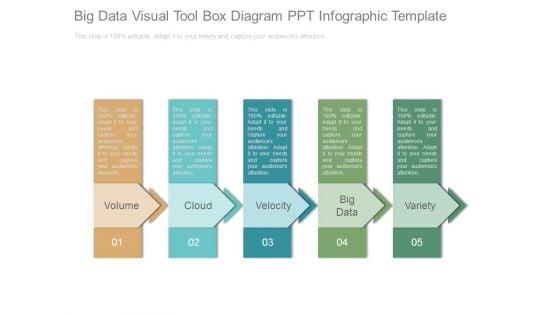
This is a big data visual tool box diagram ppt infographic template. This is a five stage process. The stages in this process are volume, cloud, velocity, big data, variety.
Slide 1 of 7
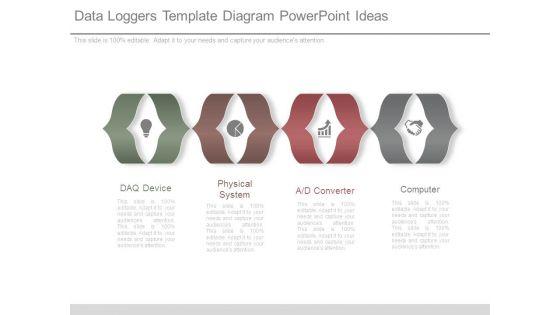
This is a data loggers template diagram powerpoint ideas. This is a four stage process. The stages in this process are daq device, physical system, a d converter, computer.




Slide 1 of 7
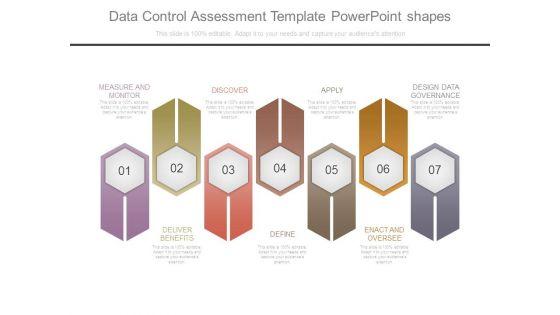
This is a data control assessment template powerpoint shapes. This is a seven stage process. The stages in this process are measure and monitor, deliver benefits, discover, define, apply, enact and oversee, design data governance.


Slide 1 of 7
This is a process of data driven attribution diagram powerpoint presentation templates. This is a four stage process. The stages in this process are drive, search, email, target .




Slide 1 of 7
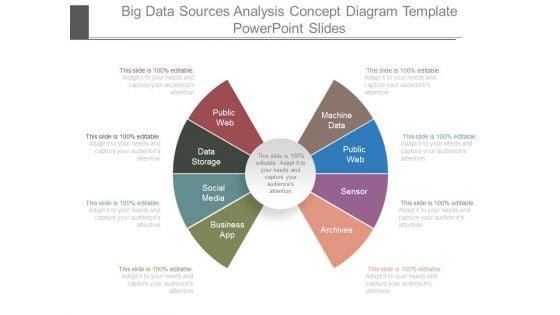
This is a big data sources analysis concept diagram template powerpoint slides. This is a eight stage process. The stages in this process are public web, data storage, social media, business app, machine data, sensor, archives.



Slide 1 of 7
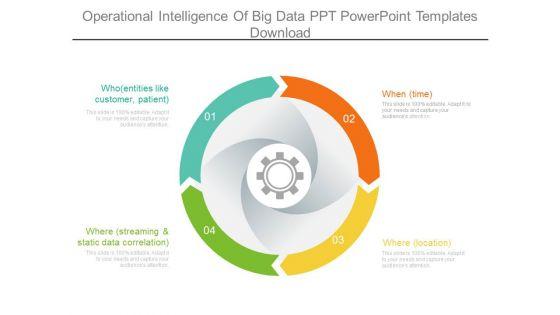
This is a operational intelligence of big data ppt powerpoint templates download. This is a four stage process. The stages in this process are who entities like customer, patient, when time, where streaming and static data correlation, where location.


Slide 1 of 7
This is a data element template example ppt slides. This is a four stage process. The stages in this process are image processing, speech recognition, recommendation engines, text processing.


Slide 1 of 7
This is a data driven web site progressive enhancement sample diagram powerpoint templates. This is a four stage process. The stages in this process are act, experiment, hypothesis, metrics.


Slide 1 of 7
This is a data management practices layout ppt templates. This is a four stage process. The stages in this process are clean, transform, visualize, model.


Slide 1 of 7
This is a assemble an analytic data repository powerpoint presentation templates. This is a five stage process. The stages in this process are assemble an analytic data repository, track all customer interactions, monitor customer experience scores, determine customer behavior changes, evaluate customer value impacts.


Slide 1 of 7
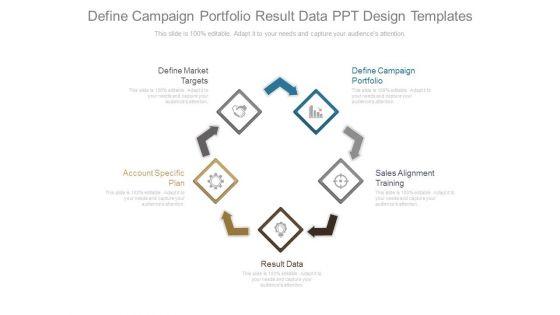
This is a define campaign portfolio result data ppt design templates. This is a five stage process. The stages in this process are define market targets, account specific plan, define campaign portfolio, sales alignment training, result data.

Slide 1 of 7
This is a submit data collection request ppt design templates. This is a thirteen stage process. The stages in this process are refine data collection approach and schedule, submit data collection request, organize and kick of projects, currently being used for future use metric, critical reporting requirements definition, meet with and interview president and executive leadership, currents state assessment gap and analysis and process capability, conduct key stakeholders alignment meeting, conduct vision workshop with executive leadership, information and data assessment, internal reporting requirements, future state capability vision, implementation considerations and high level plan.




Slide 1 of 7
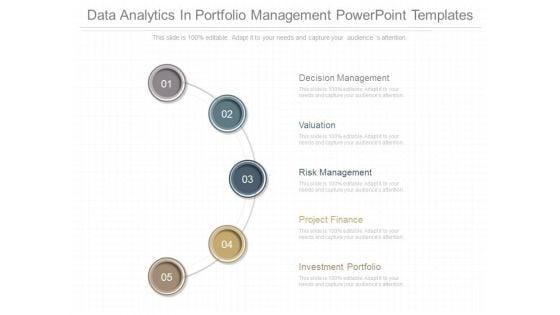
This is a data analytics in portfolio management powerpoint templates. This is a five stage process. The stages in this process are decision management, valuation, risk management, project finance, investment portfolio.




Slide 1 of 7
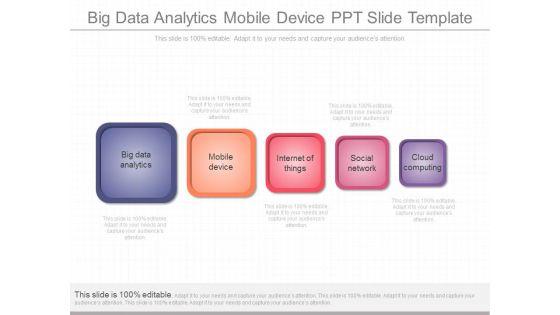
This is a big data analytics mobile device ppt slide template. This is a five stage process. The stages in this process are big data analytics, mobile device, internet of things, social network, cloud computing.




Slide 1 of 7
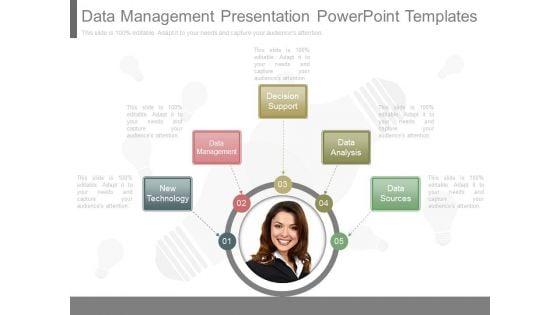
This is a data management presentation powerpoint templates. This is a five stage process. The stages in this process are new technology, data management, decision support, data analysis, data sources.
Slide 1 of 6
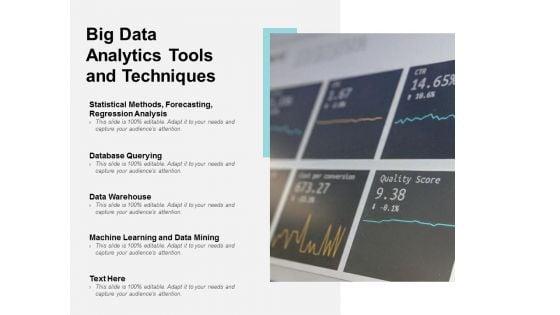
Presenting this set of slides with name big data analytics tools and techniques ppt powerpoint presentation infographic template good. This is a one stage process. The stages in this process are big data analysis, data management, technologies segmentation. This is a completely editable PowerPoint presentation and is available for immediate download. Download now and impress your audience.
Slide 1 of 6
Presenting this set of slides with name data representation vector icon ppt powerpoint presentation infographic template samples. This is a one stage process. The stages in this process are data visualization icon, research analysis, business focus. This is a completely editable PowerPoint presentation and is available for immediate download. Download now and impress your audience.


Slide 1 of 6
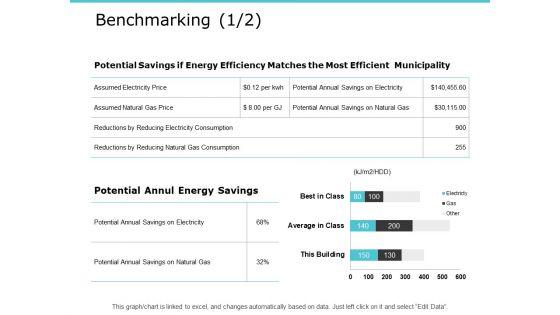
Presenting this set of slides with name benchmarking edit data ppt powerpoint presentation infographic template images. The topics discussed in these slides are marketing, business, management, planning, strategy. This is a completely editable PowerPoint presentation and is available for immediate download. Download now and impress your audience.


Slide 1 of 6
This is a data analysis for customer relationship management consulting ppt powerpoint presentation ideas templates. This is a one stage process. The stages in this process are employee performance review, job evaluation, customer 360.


Slide 1 of 6
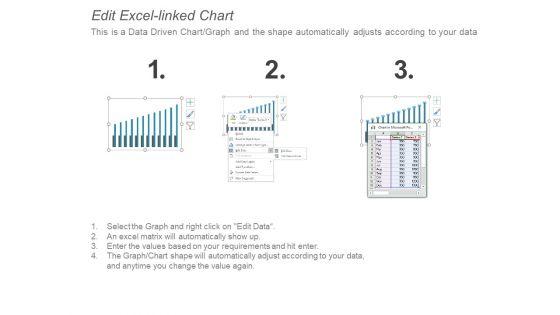
This is a global growth data analysis bar graph ppt powerpoint presentation infographic template outfit. The topics discussed in this diagram are market growth, market opportunity, market profitability. This is a completely editable PowerPoint presentation, and is available for immediate download.

Slide 1 of 6
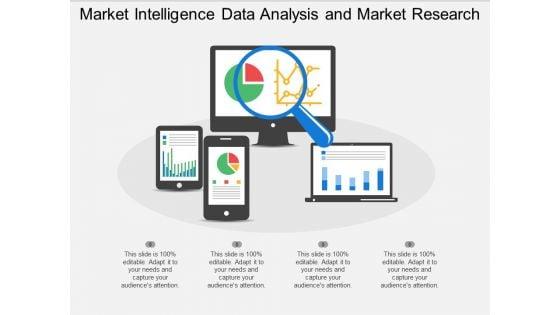
This is a market intelligence data analysis and market research ppt powerpoint presentation professional templates. This is a four stage process. The stages in this process are digital analytics, digital dashboard, marketing.



Slide 1 of 6
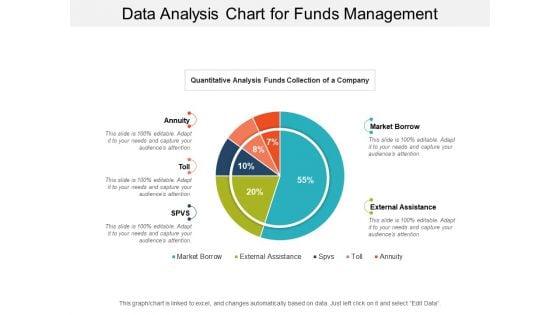
This is a data analysis chart for funds management ppt powerpoint presentation infographic template files. This is a five stage process. The stages in this process are financial analysis, quantitative, statistical modelling.
Slide 1 of 6
This is a data representation vector icon ppt powerpoint presentation infographic template example file. This is a four stage process. The stages in this process are data visualization icon, data management icon.



Slide 1 of 6
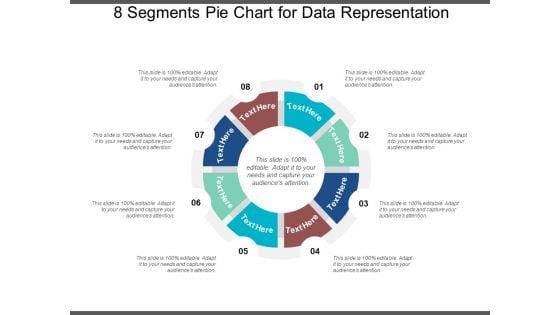
This is a 8 segments pie chart for graphical display of data ppt powerpoint presentation infographic template templates. This is a eight stage process. The stages in this process are 6 piece pie chart, 6 segment pie chart, 6 parts pie chart.
Slide 1 of 6
This is a 8 segments pie chart for data representation ppt powerpoint presentation infographics design templates. This is a eight stage process. The stages in this process are 6 piece pie chart, 6 segment pie chart, 6 parts pie chart.


Slide 1 of 6
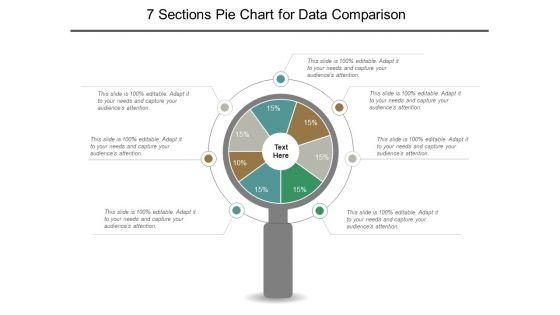
This is a 7 sections pie chart for data comparison ppt powerpoint presentation file graphics template. This is a seven stage process. The stages in this process are 6 piece pie chart, 6 segment pie chart, 6 parts pie chart.


Slide 1 of 5
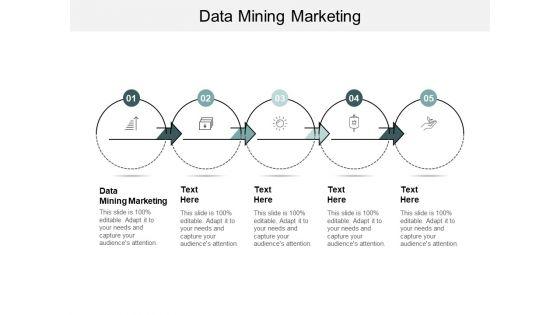
Presenting this set of slides with name data mining marketing ppt powerpoint presentation infographic template rules cpb. This is an editable Powerpoint five stages graphic that deals with topics like data mining marketing to help convey your message better graphically. This product is a premium product available for immediate download and is 100 percent editable in Powerpoint. Download this now and use it in your presentations to impress your audience.


Slide 1 of 5
Presenting this set of slides with name magnifying glass big data analysis ppt powerpoint presentation diagram templates. This is a four stage process. The stages in this process are technology, marketing, planning, business, management. This is a completely editable PowerPoint presentation and is available for immediate download. Download now and impress your audience.


Slide 1 of 5
Presenting this set of slides with name summary of accomplishments template data analysis ppt powerpoint presentation styles layout ideas. This is a six stage process. The stages in this process are timeline, process, management, planning, business. This is a completely editable PowerPoint presentation and is available for immediate download. Download now and impress your audience.


Slide 1 of 5
Presenting this set of slides with name data analytics techniques ppt powerpoint presentation infographic template smartart cpb. This is an editable Powerpoint five stages graphic that deals with topics like data analytics techniques to help convey your message better graphically. This product is a premium product available for immediate download and is 100 percent editable in Powerpoint. Download this now and use it in your presentations to impress your audience.


Slide 1 of 5
Presenting this set of slides with name data warehouse lifecycle ppt powerpoint presentation file templates cpb. This is an editable Powerpoint five stages graphic that deals with topics like data warehouse lifecycle to help convey your message better graphically. This product is a premium product available for immediate download and is 100 percent editable in Powerpoint. Download this now and use it in your presentations to impress your audience.


Slide 1 of 5
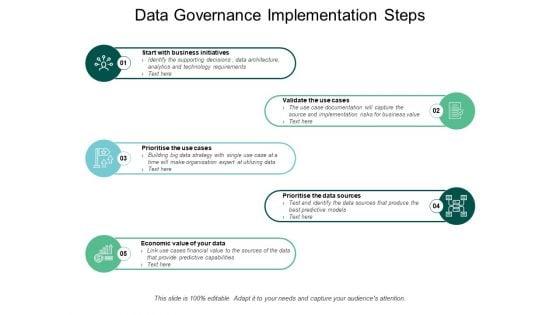
Presenting this set of slides with name data governance implementation steps ppt powerpoint presentation model graphics template. This is a five stage process. The stages in this process are big data strategy, data governance strategy, big data technology. This is a completely editable PowerPoint presentation and is available for immediate download. Download now and impress your audience.
Slide 1 of 5
Presenting this set of slides with name data report icon with various statistics ppt powerpoint presentation infographic template clipart. This is a one stage process. The stages in this process are data report, infographics brochure, business statement. This is a completely editable PowerPoint presentation and is available for immediate download. Download now and impress your audience.

Slide 1 of 5
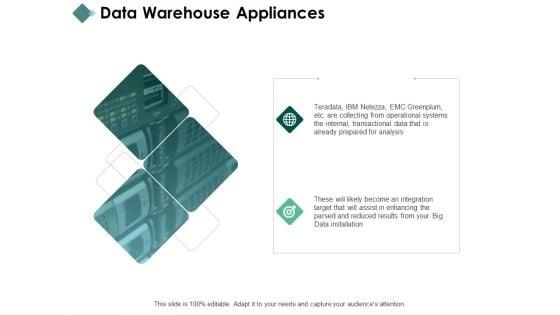
Presenting this set of slides with name data warehouse appliances arrows ppt powerpoint presentation infographics templates. This is a two stage process. The stages in this process are business, management, planning, strategy, marketing. This is a completely editable PowerPoint presentation and is available for immediate download. Download now and impress your audience.
Slide 1 of 5
Presenting this set of slides with name data analytics icons slide checklist management ppt powerpoint presentation slides design templates. The topics discussed in these slides are business, management, planning, strategy, marketing. This is a completely editable PowerPoint presentation and is available for immediate download. Download now and impress your audience.



Slide 1 of 5
Presenting this set of slides with name thank you open source data ppt powerpoint presentation portfolio infographic template. This is a one stage process. The stages in this process are thank you. This is a completely editable PowerPoint presentation and is available for immediate download. Download now and impress your audience.
Slide 1 of 5
Presenting this set of slides with name data analytics icon ppt powerpoint presentation file design templates. The topics discussed in these slides are heat map, data analytics, business quarterly. This is a completely editable PowerPoint presentation and is available for immediate download. Download now and impress your audience.


Slide 1 of 5
Presenting this set of slides with name data intelligence tools resources ppt powerpoint presentation professional design templates cpb. This is an editable Powerpoint four stages graphic that deals with topics like data intelligence tools resource to help convey your message better graphically. This product is a premium product available for immediate download and is 100 percent editable in Powerpoint. Download this now and use it in your presentations to impress your audience.

Slide 1 of 5
Presenting this set of slides with name disadvantages data intelligence ppt powerpoint presentation infographic template rules cpb. This is an editable Powerpoint three stages graphic that deals with topics like disadvantages data intelligence to help convey your message better graphically. This product is a premium product available for immediate download and is 100 percent editable in Powerpoint. Download this now and use it in your presentations to impress your audience.
SHOW
- 60
- 120
- 180
DISPLAYING: 60 of 1452 Item(s)
Page
